 Antonios N. Pouliopoulos1
 Daniella A. Jimenez1
 Alexander Frank1
 Alexander Robertson1
 Lin Zhang1
 Alina R. Kline-Schoder1
 Vividha Bhaskar1
 Mitra Harpale1
 Elizabeth Caso1
 Nicholas Papapanou1
 Rachel Anderson1
 Rachel Li1
 Elisa E. Konofagou1,2*
- 1Department of Biomedical Engineering, Columbia University, New York, NY, United States
- 2Department of Radiology, Columbia University, New York, NY, United States
Non-invasive blood-brain barrier (BBB) opening using focused ultrasound (FUS) is being tested as a means to locally deliver drugs into the brain. Such FUS therapies require injection of pre-formed microbubbles, currently used as contrast agents in ultrasound imaging. Although their behavior during exposure to imaging sequences has been well-described, our understanding of microbubble stability within a therapeutic field is still not complete. Here, we study the temporal stability of lipid-shelled microbubbles during therapeutic FUS exposure in two timescales: the short timescale (i.e., μs of low-frequency ultrasound exposure) and the long timescale (i.e., days post-activation). We first simulated the microbubble response to low-frequency sonication, and found a strong correlation between viscosity and fragmentation pressure. Activated microbubbles had a concentration decay constant of 0.02 d−1 but maintained a quasi-stable size distribution for up to 3 weeks (<10% variation). Microbubbles flowing through a 4-mm vessel within a tissue-mimicking phantom (5% gelatin) were exposed to therapeutic pulses (fc: 0.5 MHz, peak-negative pressure: 300 kPa, pulse length: 1 ms, pulse repetition frequency: 1 Hz, n = 10). We recorded and analyzed their acoustic emissions, focusing on emitted energy and its temporal evolution, alongside the frequency content. Measurements were repeated with concentration-matched samples (107 microbubbles/ml) on day 0, 7, 14, and 21 after activation. Temporal stability decreased while inertial cavitation response increased with storage time both in vitro and in vivo, possibly due to changes in the shell lipid content. Using the same parameters and timepoints, we performed BBB opening in mice (n = 3). BBB opening volume measured through T1-weighted contrast-enhanced MRI was equal to 19.1 ± 7.1 mm3, 21.8 ± 14 mm3, 29.3 ± 2.5 mm3, and 38 ± 20.1 mm3 on day 0, 7, 14, and 21, respectively, showing no significant difference over time (p-value: 0.49). Contrast enhancement was 24.9 ± 1.7%, 23.7 ± 11.7%, 28.9 ± 5.3%, and 35 ± 13.4%, respectively (p-value: 0.63). In conclusion, the in-house made microbubbles studied here maintain their capacity to produce similar therapeutic effects over a period of 3 weeks after activation, as long as the natural concentration decay is accounted for. Future work should focus on stability of commercially available microbubbles and tailoring microbubble shell properties toward therapeutic applications.
Introduction
Focused ultrasound (FUS) in combination with intravenous injection of microbubbles (MBs) can be used to non-invasively, locally, and reversibly open the blood-brain barrier (BBB) [1, 2]. MBs disperse throughout the vasculature and begin vibrating when exposed to the alternating phases of the FUS wave, undergoing a complex set of behaviors termed acoustic cavitation [3]. Intravascular stresses exerted by these vibrations allow for the temporary permeabilization of the otherwise impenetrable BBB. Although a lot of efforts have focused on the development of FUS systems able to perform targeted therapies [4–7], the behavior of MBs exposed to therapeutic FUS has been relatively understudied.
MBs were originally designed and are routinely used as contrast agents in ultrasound imaging applications [8]. As such, their behavior under exposure to center frequencies and pulse lengths relevant to ultrasound imaging has been well-described [9, 10]. MB lipid shell composition significantly affects the acoustic dissolution rate, fragmentation threshold, and lipid shedding during ultrasound imaging [11]. MB behavior during such sequences is dominated by surfactant shedding during the on-time of μs-long pulses and by gas diffusion during the off-time at kHz pulse repetition frequencies (PRF) [12]. Gas diffusion and stability within circulation can be modified through the addition of poly-ethylene glycol (PEG) in the constituent phospholipids. The degree and type of PEG-ylation had a limited effect on the circulation time and echogenicity of lipid-shelled MBs [13]. In contrast, the lipid molar ratio had a significant effect in the back-scattered power, most likely due to different shell viscosity [14]. There is evidence that a decrease in the molar content of PEG-ylated emulsifier increases the shell stiffness [15, 16]. Finally, viscosity and stiffness decrease with temperature elevation, unlike the size distribution which remains largely unaffected [17].
In the therapeutic ultrasound realm, most previous work has focused on drug-loaded MBs [18]. In terms of brain therapy, it has been shown that the MB type [19] and size distribution [20] are defining factors in BBB opening efficiency. Size-isolated MBs [21] with larger average diameters produced larger BBB opening volumes [22], due to enhanced engagement with the surrounding microvasculature [23]. In terms of the physicochemical properties of the MB shell, longer hydrophobic chains in the phospholipid layer led to increased acoustic emissions and drug delivery, especially at high acoustic pressures [24]. Heavy gas cores are required to avoid fast dissolution through the lipid shell, but the gas type does not appear to significantly influence the BBB opening efficiency [25].
Therapeutic pulses differ from imaging pulses in terms of their center frequency and pulse length. Low-frequency (<1.5 MHz) and ms-long (>500 cycles) pulses are typically used for BBB opening and targeted drug delivery applications [26–29]. Such pulses promote primary [30, 31] and secondary [32, 33] Bjerknes forces, lower the inertial cavitation threshold [34, 35], favor coalescence [36, 37] and produce sustained acoustic streaming within the blood vessels [38–40]. All these effects are expected to influence the stability of MBs during therapeutic ultrasound exposure, and in turn, the resulting bioeffect [41]. Low-frequency insonation leads to significantly higher MB expansion ratios compared to imaging center frequencies [42]. MB stability during therapeutic ultrasound exposure depends on the characteristics of the ultrasound pulse sequence used [43, 44]. Short pulses emitted at PRFs on the order of kHz prolong the MB lifetime [43], improve the spatiotemporal uniformity of cavitation activity [44], and eliminate standing-wave formation within the skull [45, 46]. Enhanced temporal stability along with uniform cavitation activity have produced uniform and minute-lasting BBB opening [47, 48]. All these studies were conducted with a specified MB formulation and shed light on the influence of the exposure conditions to the MB stability.
To date, there has been no study to investigate the temporal stability of MBs with variable phospholipid molar ratios in ultrasound therapy, and in particular in the context of BBB opening. Furthermore, an important parameter which may be useful in both pre-clinical and clinical investigations is the stability of MBs during therapeutic exposure after long-term storage following activation. One study examining Definity® MB stability over a period of 15 days post-activation found a large variation in the MB collapse threshold, which did not follow a linear trend over time [49]. Size-isolated MBs had stable size distributions over time for up to a month post-activation [21]. Here, we studied temporal stability of polydisperse lipid-shelled MBs in two timescales: (a) short timescale, i.e., μs of therapeutic ultrasound exposure, and (b) long timescale, i.e., days post-activation. We conducted numerical simulations, in vitro phantom experiments and in vivo BBB opening in mice, in order to establish the characteristics of the acoustic emissions over these two timescales. Our hypothesis was that the lipid molar ratio and storage time do not significantly change the temporal stability and the BBB opening potential of lipid-shelled MBs.
Methods
Numerical Simulations
To evaluate the effect of shell parameters on the MB oscillation dynamics, and more importantly the break-up or fragmentation pressure, we implemented the Marmottant model [50] in MATLAB (The Mathworks, Natick, MA, USA). This model is based on the Rayleigh-Plesset equation, modified to include the effect of the shell characteristics [50]:
with surface tension σ(R) being:
All parameters used here were based on reported literature (Table 1). Shell compression modulus χ and surface dilatational viscosity κs were estimated based on previous work [14], assuming a linear increase of both with increasing molar ratio. Lipid layer elasticity has been shown to increase with a reduction of the DSPE-PEG2000 content [15, 16], or conversely, an increase in the DSPC:DSPE-PEG2000 molar ratio in this study. Similar observations have been made regarding shell viscosity [14, 51]. Yet, the elasticity and viscosity increase with molar ratio is an assumption and may influence the validity of the simulations. Furthermore, we assumed a thin lipid shell of thickness ε equal to 1 nm [51]. χ and κs of the thin lipid shell were calculated by multiplying the relative bulk moduli with the shell thickness, i.e., χ = 3Gsε and κS = 3μlipidε [50, 52], where Gs and μlipid were the bulk shear modulus and the bulk viscosity of the lipids constituting the shell [14]. The Marmottant model assumes that ε < < R, which is generally true for lipid-shelled MBs. However, ε can be up to 650 nm in polymer-shelled MBs [53]. In this study, the buckling radius was assumed to be equal to the equilibrium radius (i.e., 1.2 μm). Equation (1) was solved using the built-in ode45 solver in MATLAB, a fourth-order Runge-Kutta algorithm, with an evaluation time step of 10 ns. This time step was identical to the sampling period used in the in vitro and in vivo experiments, to allow for meaningful comparison.
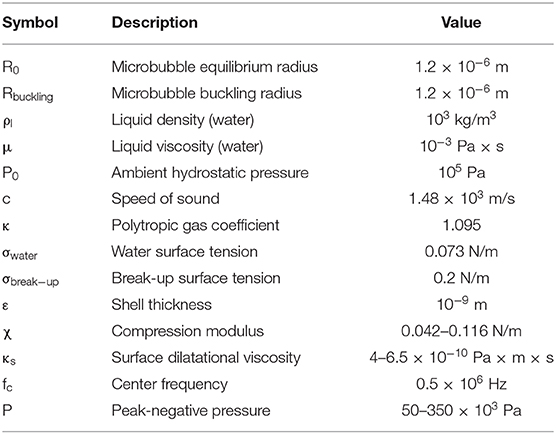
Table 1. Parameters for numerical simulations of microbubble stability.
Microbubble Formulation
Lipid-shelled MBs were prepared in-house following previously described chemical synthesis protocols [21, 54]. Briefly, the shell constituted of two lipids, 1,2-distearoyl-sn-glycero-3-phosphocholine (DSPC) and 1,2-distearoyl-sn-glycero-3-phosphoethanolamine-N-[methoxy(polyethylene glycol)-2000] (DSPE-PEG2000 or DSPE-PEG2K hereafter) (No. 850365 and 880120, purity > 99%; Avanti Polar Lipids, Alabaster, AL, USA) mixed at variable molar ratios (6:1, 9:1, and 12:1—or in percentage format, 86:14, 90:10, and 92:8; Figure 1A). In vivo experiments and most in vitro experiments were conducted with the 9:1 molar ratio, which is typically used for BBB opening [20] and corresponds to a Definity-like mixture [55]. The ratios of 6:1 and 12:1 were selected on either side of the established ratio, to investigate the effect of using less or more emulsifier on the cavitation response. Lipids were mixed within a solution of 80% v/v PBS, 10% v/v glycerol, and 10% v/v 1,2-propanediol (Sigma Aldrich, St. Louis, MI, USA). Perfluorobutane (C4F10; FluoroMed LP, Round Rock, TX, USA) was introduced in the empty head space of the hosting vial, and was then mechanically mixed with the lipid solution using an amalgamator for 45 s (Vialmix; Lantheus Imaging, North Billerica, MA, USA). MB activation was performed on day 0, but MBs were counted and sized prior to every experiment (Figure 1B), in order to have concentration-matched populations for each sonication. MBs were stored in room temperature to avoid large temperature gradients during the course of the experiments, which could influence the size distribution or shell properties [17]. Following activation, MB vials were covered with parafilm to reduce the amount of gas exchange between the vial and the environment. Yet, nitrogen and oxygen transfer into the perfluorobutane core is likely to affect the stability and inertial cavitation response over time [56].
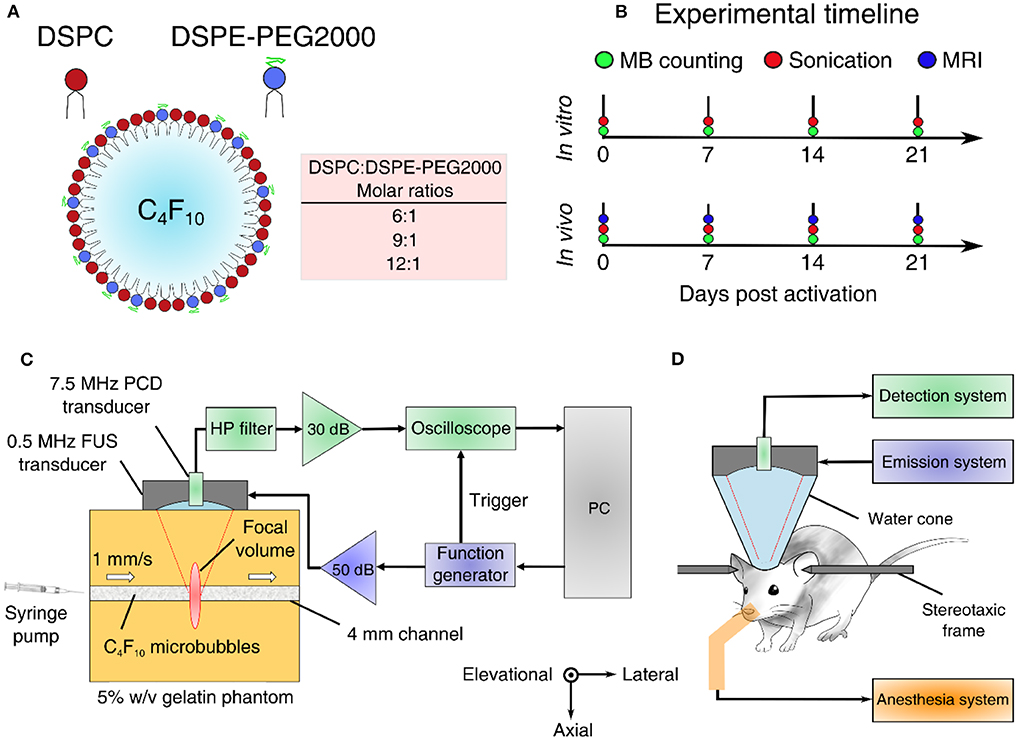
Figure 1. Experimental outline and setups. (A) Microbubble formulation. DSPC and DSPE-PEG2000 were mixed at different lipid molar ratios to produce microbubbles of variable shell stiffness and viscosity. (B) Experimental timeline for estimating microbubble stability in vitro and in vivo. (C) In vitro experimental setup using a 5% w/v tissue-mimicking phantom. (D) In vivo experimental setup for non-invasive blood-brain barrier opening in mice. FUS, focused ultrasound; PCD, passive cavitation detection; HP, 1.2-MHz high-pass.
Experimental Setup
In vitro and in vivo experiments were conducted using the same experimental setup (Figures 1C,D), described in detail elsewhere [57]. Briefly, a 0.5 MHz spherical-segment single-element FUS transducer (Part No. H-204; Sonic Concepts, Bothell, WA, USA) was driven by a waveform generator (33500B series; Agilent technologies, Santa Clara, CA, USA) through a 50 dB radiofrequency power amplifier (Model A075; E&I, Rochester, NY, USA). The focal volume (2 mm × 11 mm) was placed either at the center of the 4-mm channel of the tissue-mimicking gelatin phantom (concentration: 5% w/v) or at the caudate putamen structure of the murine brain. For the in vitro experiment, MBs were flowing through the channel at a constant velocity of 1 mm/s, to imitate the slow flow of capillaries. Acoustic emissions were captured with a 7.5 MHz single-element passive cavitation detector (Part No. U8423539, V320, diameter: 12.7 mm, focal depth: 76.2 mm; Olympus Industrial, Waltham, MA, USA) which was inserted and co-aligned with FUS transducer, having overlapping foci. A high-pass filter was used to filter out the fundamental and the second harmonic reflections (Part No. ZFHP-1R2-S+, cut-off frequency 1.2 MHz; Mini Circuits, Brooklyn, NY, USA). Recorded signals were amplified by 30-dB with a pulser-receiver (Part No. 5072; Olympus Industrial) and then recorded using a GaGe oscilloscope card (Part No. CSE1422, 14 bit; Dynamic Signals LLC, Lockport, IL, USA). We captured segments of 114,688 time points at a sampling frequency of 100 MSa/s.
Signal Processing
Acoustic cavitation emissions were processed offline in MATLAB. Time-domain signal (Figure 2A) was used to estimate the energy (Figure 2B) emitted during a single therapeutic pulse through:
where V was the voltage at each time point in volts and Δt was the sampling period equal to 10 ns or 10−8 s. In this calculation, it was assumed that the electrical energy in the detection system was proportional to the acoustic energy emitted by the MBs. We also assumed a dimensionless resistance value of 1 for simplicity, therefore energy units are given in V2s and not in Joule. Control sonications without MBs were used to estimate the baseline signal [58], whose energy was subtracted from the MB acoustic emissions at each time point [43]. We then assessed the normalized cumulative energy (Figure 2C) to investigate the temporal distribution of cavitation emissions during the pulse. To do so, two temporal constants were calculated at each condition, following previous work [43, 44]. The constants t20 and t80 were defined as the time required for the 20 and 80% of the total acoustic energy to be emitted (Figure 2C). Based on these two values, a third stability metric was introduced, namely temporal bias (TB). TB was defined as:
TB equal to 0 would indicate a symmetric profile of emissions over time, since for “linear emission curves” t80 would be four times t20. Negative TB values (i.e., t80 < 4t20) would indicate early emission bias, while positive TB values (i.e., t80 > 4t20) would indicate late emission bias.
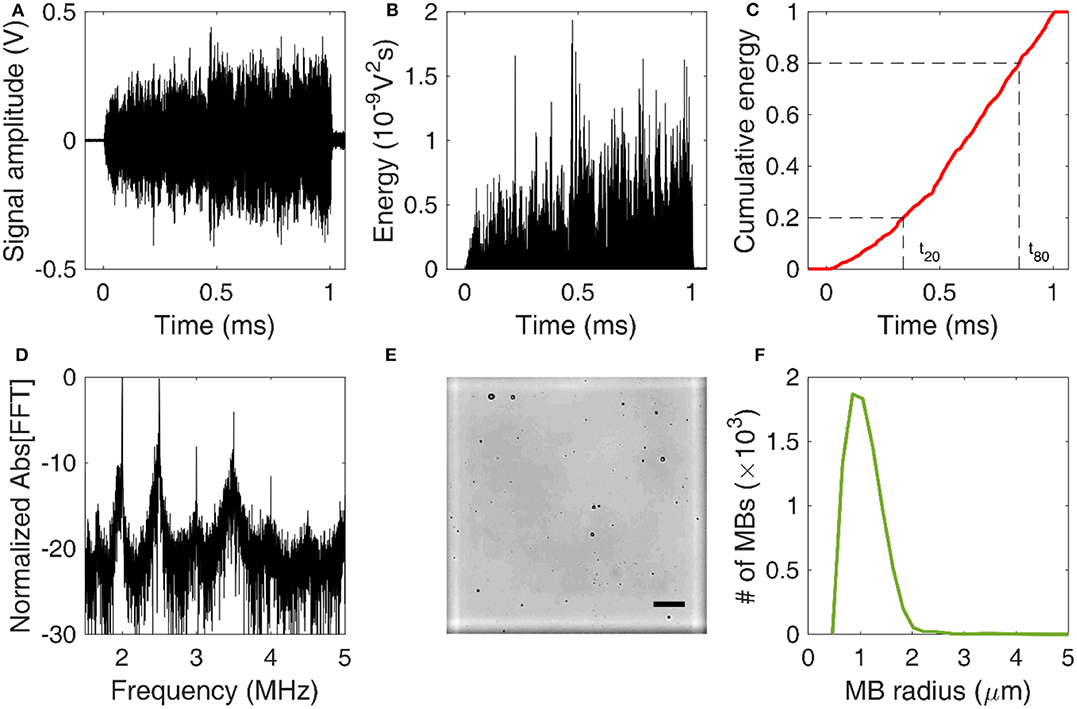
Figure 2. Signal and image processing. (A) Time-domain signal capturing cavitation emissions during the 1-ms-long therapeutic pulse. (B) Energy evolution during a single pulse. (C) Normalized cumulative energy during a single pulse. Time constants t20 and t80 were defined as the time required for 20 and 80% of the total acoustic energy to be emitted, respectively. (D) Normalized amplitude of fast Fourier Transform (FFT) performed over the cavitation emissions produced by a single pulse. (E) Example of an optical microscopy image acquired for microbubble counting and sizing. The marked square of the hemocytometer is in white. Scale bar: 50 μm. (F) Microbubble size distribution estimated through optical microscopy.
Frequency analysis was conducted to identify the cavitation mode at each experimental condition. A Fast Fourier transform (FFT) was performed in MATLAB (number of FFT points: 114,688). Based on the FFT (Figure 2D), three spectral areas were filtered and analyzed independently:
a) harmonic regions, fh, n = nfc (5)
b) ultraharmonic regions, fu, n = (n − 1/2)fc (6)
c) broadband regions fb, with fh, n + 10kHz < fb < fu, n−10kHz and fu, n + 10kHz < fb < fh, n + 1 − 10kHz (7).
where fc was the center frequency of the FUS transducer (i.e., 0.5 MHz) and n was the harmonic number (n = 3, 4, 5, …, 10). The fundamental and second harmonics were filtered out and ignored, due to strong reflections at these frequencies in control experiments.
Cavitation doses were calculated as described before [7, 59], based on the root-mean-square voltage detected in the respective spectral areas. Harmonic stable (SCDh), ultraharmonic stable (SCDu) and inertial cavitation (ICD) doses were defined as:
where the index i changed for harmonic, ultraharmonic, and broadband regions fi, to estimate SCDh, SCDu, and ICD, respectively. These doses were calculated for each acoustic pulse both for in vitro and in vivo experiments. Wherever appropriate, per-pulse cavitation doses (i.e., cavitation levels) were either averaged or summed to derive the mean and total cavitation doses.
Image Processing for MB Sizing
To estimate the MB size distribution, we followed an optical microscopy-based technique similar to previously described approaches [60–62]. Activated MBs were first diluted by 1,000 × in distilled water. Ten microliters of this solution were then injected into the chambers at either side of a disposable hemocytometer (part number: NC0435502; Fisher Scientific, Hampton, NH, USA). Each chamber had a height of 100 μm, so the total volume of each marked square was 0.1 mm3 (Figure 2E). MBs were imaged in bright field at 20 × magnification in an upright microscope (Leica DM6 B; Leica Microsystems Inc., Buffalo Grove, IL, USA). A total of 64 images were acquired, one for each marked square. The images were then cropped, removing the dark rim surrounding the squares of the hemocytometer. Cropped images were processed in MATLAB(C) using a purpose-built algorithm that detected individual MBs based on the circular Hough transform (function imfindcircles). Given the known volume, the total number of MBs allowed an approximation of the original MB concentration. Finally, the mean and maximum radius of each MB population was calculated at each time point. Different MB batches were used for in vitro and in vivo experiments, and each batch was measured separately. The same MB batch was used across time points, following activation on day 0.
In vitro Experiments
A tissue-mimicking phantom was prepared for the in vitro experiments. Gelatin powder (G2500; Sigma Aldrich, St. Louis, MI, USA) was slowly mixed in hot water (>60oC), which was continuously stirred with a magnetic stirrer. The final gelatin concentration was 5% w/v. A silicon elastomer tube (outer diameter: 4 mm; Saint-Gobain, Wayne, NJ, USA) was fixed between the inlet and outlet ports of a plastic container and served as the mold for the channel. The gelatin solution was poured into the container and left over night at 5oC to set.
The following day, the FUS transducer was placed on top of the gelatin phantom (Figure 1C). A raster scan was performed to locate the channel along the lateral and elevational dimensions. The focal volume was placed at the center of the channel along the axial dimension, using pulse echo. Control sonications were conducted with water flowing at a velocity of 1 mm/s in order to imitate slow capillary flow. Finally, MBs were diluted to the desired concentration (107 MBs/ml) based on the counting result (Figure 5) and were made to flow at the same fluid velocity. A total of 10 therapeutic pulses (Table 2) were emitted per condition.
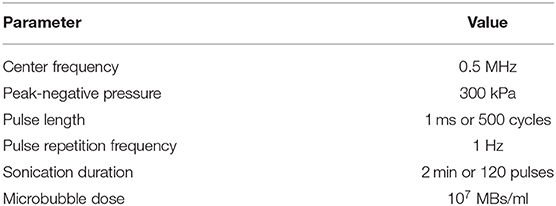
Table 2. Acoustic parameters used in both in vitro and in vivo experiments.
In vivo Experiments
All animal experiments were approved by the Institutional Animal Care and Use Committee (IACUC) of Columbia University. Three wild-type mice (C57BL/6, age: 4–8 months, mass: 28 ± 6 g) were exposed to therapeutic ultrasound on a weekly basis. Based on literature, n = 3 mice would suffice to produce statistically significant differences in terms of MRI-based BBB opening quantification [20, 63, 64]. Anesthesia was induced and maintained with inhalable isoflurane mixed with oxygen (2–3% for induction and 1.2–1.5% for maintenance), delivered through a digital vaporizer (SomnoSuite; Kent Scientific, Torrington, CT, USA). Mice were fixed within a stereotaxic frame (David Kopf Instruments, Tujunga, CA, USA) to allow for accurate targeting (Figure 1D). The head fur was removed with clippers and depilatory cream, applied for 10–20 s. Using a previously described metallic grid method [26], we targeted the caudate area (coordinates from lambdoid suture: +3 mm ventral, −2 mm lateral). A control sonication was performed prior to MB injection, to acquire a baseline signal, which was subsequently subtracted from the MB signal. MBs were injected through an intravenous catheter inserted into the tail vein, at a concentration of 107 MBs/ml of blood. This concentration was equivalent to 5 × the clinical dose of Definity® MBs recommended for ultrasound imaging applications. For each day during the 3 weeks post activation, the injected dose was calculated based on the concentration measured prior to every experiment (Figure 5C).
Following the 2-min ultrasound treatment using clinically relevant acoustic parameters (Table 2), we injected 200 μl of gadolinium(Gd)-based contrast agent (Omniscan; GE healthcare, Bronx, NY, USA) intraperitoneally. Mice were transferred to the MRI suite, anesthetized with 1–2% isoflurane, placed in a 3 cm birdcage coil and scanned with a small-animal 9.4T MRI system (Bruker, Billerica, MA, USA). A contrast-enhanced T1-weighted 2D FLASH scan (TR/TE: 230/3.3 ms, flip angle: 70o, number of excitations: 18, in-plane resolution: 85 μm × 85 μm, slice thickness: 500 μm, receiver bandwidth: 50 kHz) was acquired ~45 min after FUS exposure, along both axial and coronal planes.
Image Processing for MRI Quantification
MRI scans were loaded into MATLAB. Quantification was performed on the coronal slices. Firstly, a region of interest (ROI) was defined in the contralateral hemisphere to calculate the baseline intensity. The threshold intensity to define BBB opening was set as the average intensity within the control ROI plus 3 standard deviations. Every coronal slice was loaded sequentially, and a manual ROI was drawn within the entire ipsilateral hemisphere. All pixels having intensity higher than the threshold were counted to derive the BBB opening surface area in each slice. The total BBB opening volume (in mm3) per mouse was calculated by summing the BBB opening surface areas across all slices and then multiplying by the slice thickness. Finally, the contrast enhancement (in %) was calculated by dividing the mean intensity within the BBB opening areas with the mean intensity of the control ROI.
Statistics
In vitro experiments were repeated for n = 10 pulses and in vivo experiments were repeated for n = 3 mice (or 360 pulses) per day post-activation. Measurements are presented as mean ± standard deviation, unless otherwise stated. One-way ANOVA tests with post-hoc Bonferroni analysis were performed to compare metrics across the lipid molar ratios or days post-activation. Statistical significance was assumed at p < 0.05.
Results and Discussion
Numerical Simulations
Using equation (1), we simulated the radial oscillations of MBs exposed to therapeutic ultrasound (Figure 3). At low acoustic pressures (e.g., 50 kPa) MBs oscillated in a quasi-sinusoidal fashion around the equilibrium radius. Increasing the acoustic pressure led to asymmetric oscillations, with the expansion phase outweighing the compression phase (Figure 3A). At 200 kPa, the expansion ratio during the rarefactional phase reached up to 1.75 (i.e., maximum radius of 2.1 μm compared to equilibrium radius of 1.2 μm). Additionally, we observed a high-frequency oscillation during the compression phase at high pressures. This effect was more pronounced in MBs with lower DSPC:DSPE-PEG2K molar ratio (Figure 3B). Increasing the molar ratio or, conversely, the shell stiffness and viscosity, suppressed the instability during the MB collapse. Increasing the molar ratio decreased the amplitude of radial oscillations. Consequently, the fragmentation or break-up pressure increased with DSPC:DSPE-PEG2K ratio (Figure 3C). Surface dilatational viscosity had a significant effect on the fragmentation pressure, unlike shell compression modulus (Figure 3D). This is in accordance with previous studies that reported shell viscosity to be the major determinant in MB response [14, 51].
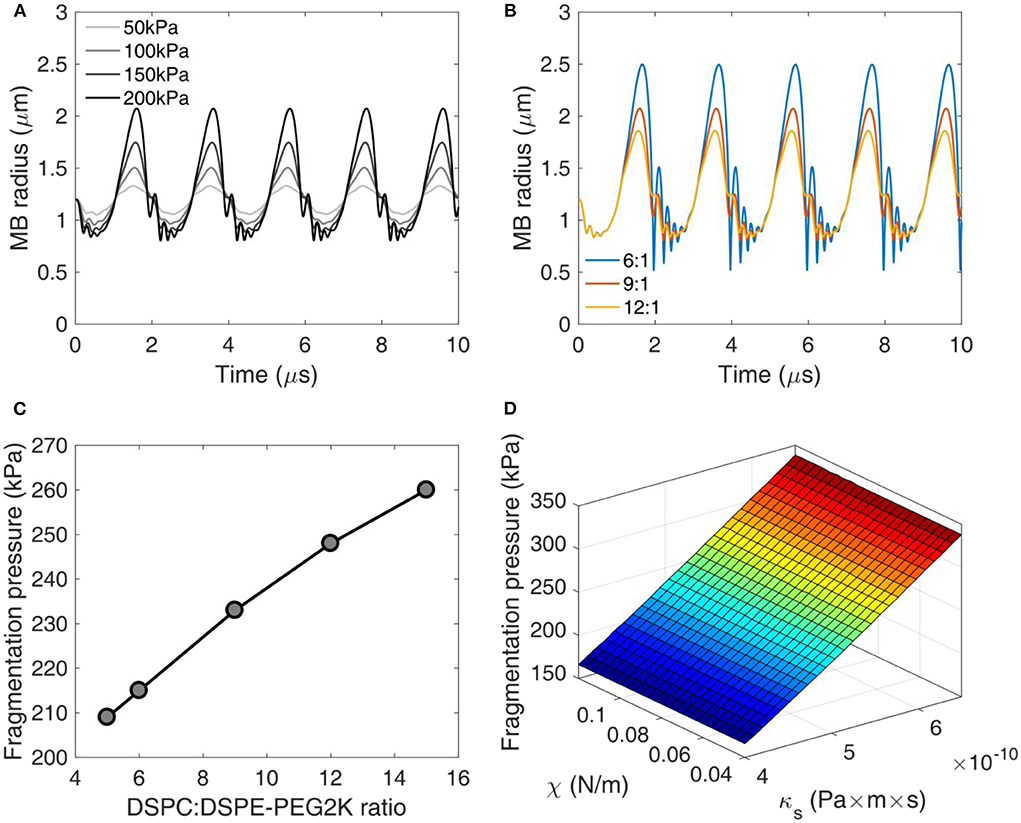
Figure 3. Numerical simulations of microbubble stability. (A) Radius over time for different acoustic pressures. DSPC:DSPE-PEG2K ratio: 9:1. (B) Radius over time for different DSPC:DSPE-PEG2K ratios. Peak-negative pressure: 200 kPa. (C) Fragmentation pressure across the DSPC:DSPE-PEG2K ratios. (D) Fragmentation pressure as a function of compression modulus χ and shell dilatational viscosity κs.
Effect of Molar Ratio on Cavitation Response
Changing the DSPC:DSPE-PEG2K molar ratio during MB preparation significantly affected most stability metrics (Figure 4). The total energy emitted during sonication was significantly different across the ratios (p = 1.16 × 10⁻⁶; one-way ANOVA). The ratio 9:1 produced significantly lower total energy compared to 6:1 and 12:1 (Figure 4A). Qualitatively, the average cumulative energy was similar across the ratios (Figure 4B). However, there were significant differences both in t20 (p = 0.005) and t80 (p = 2.48 × 10⁻⁵). Interestingly, 9:1 ratio had significantly higher t20 compared to the other ratios, indicating that early destruction of quasi-resonant MBs is avoided at this ratio (Figure 4C). In contrast, t80 increased with molar ratio, suggesting that surviving MBs with higher ratios are more stable compared to lower ratios. This is in accordance with the simulation results, showing that non-resonant MBs of 1.2 μm in radius are progressively less prone to fragmentation with increasing molar ratio (Figures 3C,D).
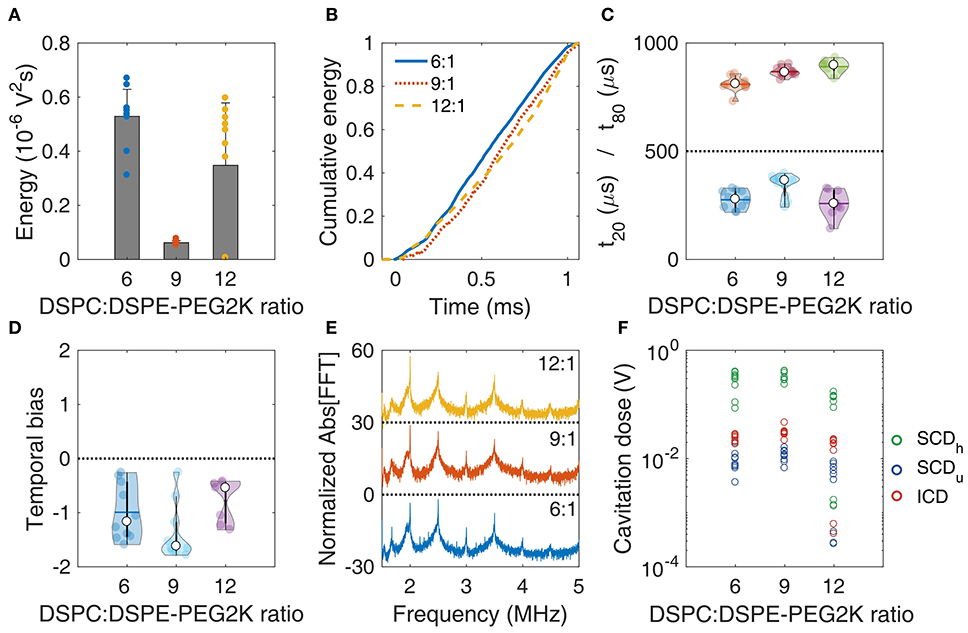
Figure 4. In vitro stability of microbubbles encapsulated with lipid shells of variable DSPC:DSPE-PEG2K lipid molar ratios. (A) Total acoustic energy emitted per therapeutic pulse. (B) Mean cumulative energy evolution (n = 10) for molar ratios of 6:1 (blue straight line), 9:1 (dotted orange line), and 12:1 (yellow dashed line). (C) Temporal constants t20 (t < 500 μs) and t80 (t > 500 μs). (D) Temporal bias. (E) Normalized spectra averaged across pulses (n = 10). (F) Stable harmonic (green circles), stable ultraharmonic (blue circles), and inertial (red circles) cavitation doses. Peak-negative pressure: 300 kPa.
There was no significant difference in the temporal bias across the molar ratios (p = 0.054; Figure 4D). Average spectra of different ratios had similar features, with a notable increase of both harmonic and broadband peaks for the 9:1 ratio. This was evident in the cavitation doses, where we found a significant difference across ratios, for SCDh (p = 1.87 × 10⁻⁶), SCDu (p = 4.92 × 10⁻⁴), and ICD (p = 4.99 × 10⁻⁵). 9:1 ratio had higher SCDh, SCDu, and ICD compared to the other ratios (significantly higher only compared to 12:1). Higher doses indicated sustained acoustic emissions over time, despite the lower total energy emitted (Figure 4A), which may be associated with reduced MB destruction. Taken together, these data indicate that the molar ratio of 9:1 provided the higher stability during the 1-ms pulse, thus it was chosen as the most suitable formulation for therapeutic applications.
Stability of Microbubble Size Distribution
Long-term storage of activated MBs may be an important factor of reducing cost and allowing widespread use of MB-based FUS therapies, such as BBB opening. For that reason, we first measured the stability of MB size distribution over time (Figure 5). In this study, we used an optical microscopy based counting technique (Figures 2E,F). We first compared the size distribution acquired using this method with an alternative technique, based on Multisizer counting (Figure 5A). The derived distributions peaked at different radii (1.24 μm for optical microscopy and 0.75 μm for Multisizer) and had lower degree of agreement in MB radii below 2 μm. Optical microscopy gave a larger MB density for radii between 1 and 2 μm compared to Multisizer. The root mean square error in MB density estimation was 0.22 or 22%. Over time, the MB size distributions had similar characteristics (Figure 5B), with a moderate shift of the peak radius toward smaller radii. MB concentration decreased over time (Figure 5C). An exponential fit was performed, assuming that the decay rate was proportional to the remaining MB number. The characteristic decay constant was estimated as λ = 0.02d−1, yielding a MB half-life of 35 days. However, the concentration was practically stable between day 14 and 21 in our measurements. The mean and maximum radius had a limited variation throughout the 3 weeks of measurements (Figure 5D). Mean radius ranged between 1.37 ± 0.56 μm and 1.52 ± 0.63 μm (9.9% variation), while the largest radius measured was between 6.47 μm and 6.94 μm (6.7% variation). This is in accordance with published literature on size-isolated MBs, whose size distribution was stable for up to a month after activation [21].
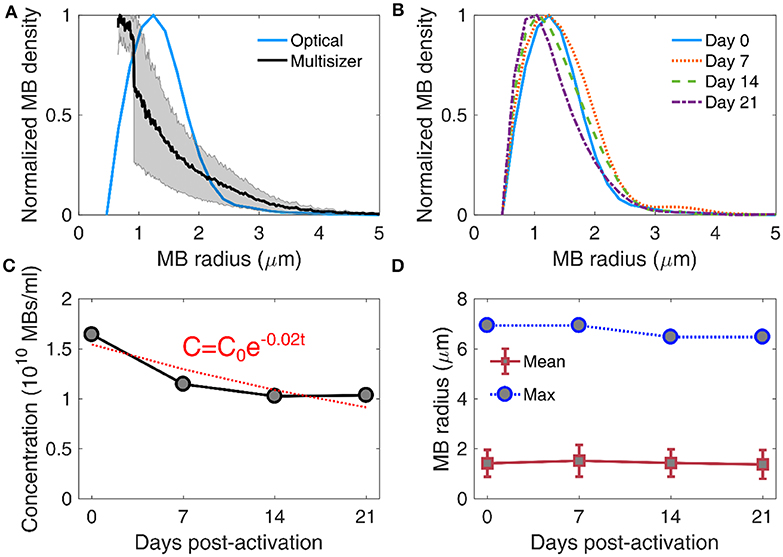
Figure 5. Stability of microbubble size distribution and concentration. (A) Comparison between size distribution estimated through Coulter multisizer (black line; gray area denotes standard deviation, n = 3) and bright field microscopy (blue line). The root mean square error in microbubble density estimation between the two techniques was 0.22 or 22%. (B) Size distribution evolution over time, measured on day 0 (blue straight line), day 7 (dotted orange line), day 14 (dashed green line), and day 21 (dotted-dashed purple line) post-activation. (C) Microbubble concentration over time (gray circles), fitted with an exponential decay curve (red dotted line). The exponential decay factor was estimated at 0.02. C0 denotes microbubble concentration on day 0, and t is storage time in days. (D) Evolution of mean (red boxes) and maximum (blue circles) microbubble radius over time. Mean radii are given as mean ± standard deviation.
Previous work has identified discrepancies in the measured size distribution when using different techniques. For example, size distributions were different between Accusizer, which is based on light scattering, and Multisizer, which is based on electrical impedance sensing of displaced electrolyte volume [21, 65]. Similarly to this study, it has been previously shown that optical microscopy-based size distribution is not identical to Multisizer measurements [66]. Despite the differences, our main interest was to evaluate the evolution of MB population over time, measured with the same technique (Figure 5D). Critically, the measured concentration (Figure 5C) was used to study the response of concentration-matched samples at every time point, for both in vitro and in vivo experiments.
Microbubble Stability in vitro
MBs with DSPC:DSPE-PEG2K molar ratio of 9:1 were activated on day 0 and were stored in room temperature (~18–20oC) for 21 days. Concentration-matched MBs were made to flow through the tissue-mimicking phantom (Figure 1C) and were exposed to therapeutic pulses (Table 2), on days 0, 7, 14, and 21. The total emitted energy was significantly different across days (p < 10−27), and peaked on day 14 (Figure 6A). Cumulative energy had a smoother slope on day 0 compared to following days (Figure 6B), suggesting slower MB destruction during the first half of the pulse. This was corroborated by the temporal constants. Both t20 and t80 were significantly different across days (p = 4.5 × 10⁻¹² and 5 × 10⁻⁵, respectively). Both constants progressively decreased over time (Figure 6C), with the effect being stronger on t20 (i.e., at the beginning of the pulse). Sonications on days 7, 14, and 21 yielded significantly lower t20 compared to day 0, but there was no significant difference between them. In terms of t80, days 14 and 21 had significantly lower measurements compared to days 0 and 7, but there was no difference between each of the first or last 2 days. Negative temporal bias on day 0 was indicatory of delayed acoustic emissions (Figure 6D). The bias was progressively eliminated toward day 21, due to the more uniform distribution of these emissions over time (Figure 6B). Harmonic amplitude decreased over time compared to the broadband floor (Figure 6E). This was reflected on the cavitation doses (Figure 6F). In contrast to harmonic stable cavitation doses which decreased over time (slope: −10 mV/d), ultraharmonic and inertial cavitation doses rose over time (slope: 0.46 and 0.8 mV/d, respectively.
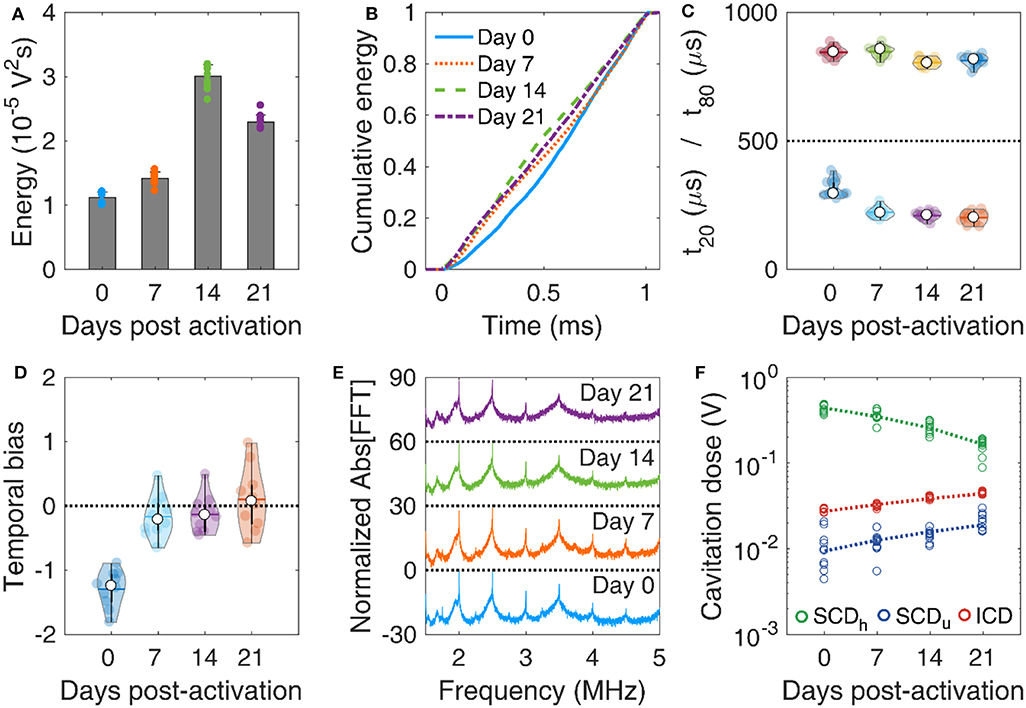
Figure 6. In vitro microbubble stability over time. (A) Total acoustic energy emitted per therapeutic pulse over time post-activation. (B) Mean cumulative energy evolution (n = 10) for microbubbles exposed to ultrasound on day 0 (blue straight line), day 7 (dotted orange line), day 14 (dashed green line), and day 21 (dotted-dashed purples line) post-activation. (C) Temporal constants t20 (t < 500 μs) and t80 (t > 500 μs) over time post-activation. (D) Temporal bias over time. (E) Normalized spectra averaged across pulses (n = 10). (F) Stable harmonic (green circles), stable ultraharmonic (blue circles), and inertial (red circles) cavitation doses over time. A linear fit was performed on each dose (dashed lines) to investigate the average effect of storage time on cavitation dose.
Taken together, these results demonstrate that MBs get progressively less stable under therapeutic exposure in vitro over time. Given the limited variation in the size distribution for 3 weeks post-activation (Figure 5D), it is unlikely that changes in MB size drove this transition. It is likely that the lipid content is modified during storage, due to either ambient pressure or ambient temperature variations [17]. Surfactant shedding may change the total amount or the DSPC:DSPE-PEG2K ratio in the MB membrane [12, 67]. According to our simulation results, a decrease in the lipid molar ratio would lead to MBs more prone to fragmentation (Figure 3C). A possible explanation is that DSPC is naturally expelled out of the MB shell in the examined timescale, possibly due to its charge and MB zeta-potential [68–70]. If the expulsion rate of the neutral emulsifier DSPE-PEG2K was lower than the respective rate of DSPC, the DSPC:DSPE-PEG2K molar ratio would effectively decrease over time. This would lead to MBs with decreased compression modulus and, most importantly, viscosity (Figure 3D). Apart from lipid shedding, lipid degradation and peroxidation may influence the shell properties over time, especially given the gas exchange between the activated vial and atmospheric air. However, this remains a hypothesis that will be tested in future work, possibly using fluorescently-tagged lipids [71, 72]. Finally, shell modifications would change the resonance frequency of both isolated MBs [73] and MB populations [74, 75], thereby affecting their fragmentation threshold [76, 77].
Microbubble Stability in vivo
MBs with reduced stability during therapeutic pulses in vitro were expected to have similar but not identical behavior in vivo, due to the different boundary conditions [78–81]. Despite the large variation of emitted energy per pulse in each mouse, the total energy emitted during the 2-min FUS treatment was not significantly different across days (p = 0.46, n = 3 mice per day; Figure 7A). The average energy initially decreased at day 7, but then increased on average until day 21. We observed similar temporal distributions of the cumulative energy across days (Figure 7B). Temporal constants presented a wide deviation across all pulses per day (Figure 7C). When examining the average constants per mouse, t20 was not found significantly different across days (p = 0.06, n = 3 mice per day) and t80 was marginally different (p = 0.02; only statistical difference was observed between day 7 and 21). Both constants had a similar general trend, initially decreasing on day 7 and then increasing until day 21. In other words, MBs appeared more stable during sonication on day 21, compared to days 7 and 14, and similarly stable compared to day 0. The inverse trend was observed in the temporal bias (Figure 7D; p = 0.03), initially increasing above 0 (i.e., early emission bias) and then decreasing below 0 on day 21 (i.e., late emission bias). A possible explanation lies in the experimental variations on day 21, e.g., injection of moderately higher MB concentration. Alternatively, MB response under confinement within the microvasculature in vivo is expected to be different compared to relatively unconfined oscillations occurring in the in vitro experiment [78, 82]. However, this hypothesis should be tested in future work with variable confinement scales, for example using elastic tubes of different diameters on the micrometer scale [81].
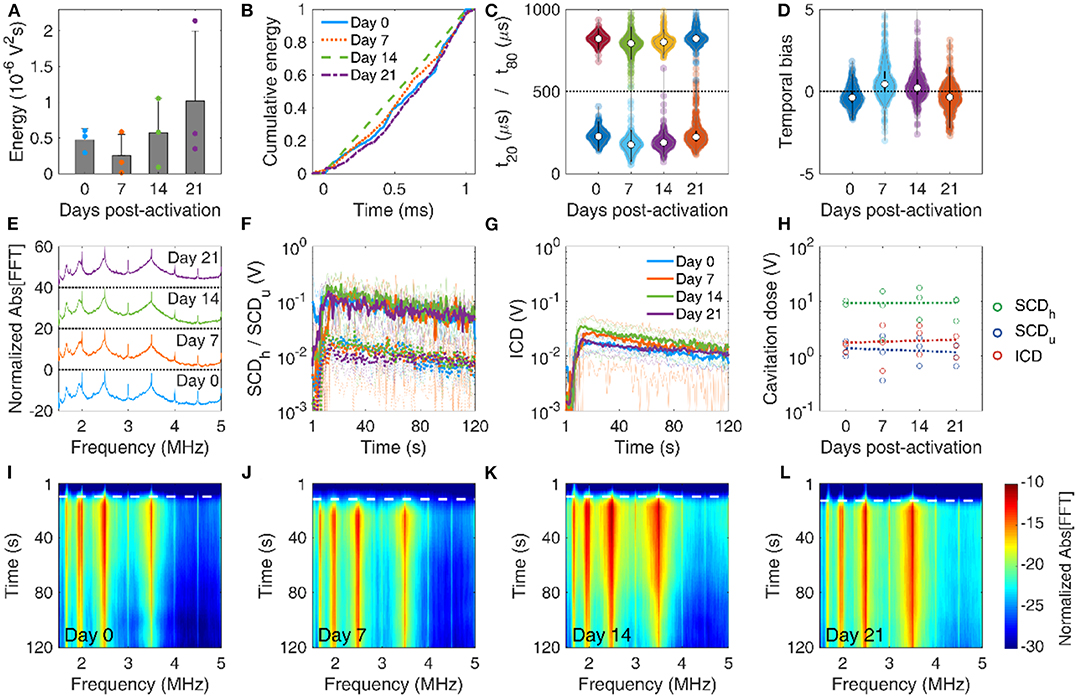
Figure 7. In vivo microbubble stability over time. (A) Mean acoustic energy emitted per mouse over time post-activation. (B) Mean cumulative energy evolution (n = 10) for mice treated with focused ultrasound on day 0 (blue straight line), day 7 (dotted orange line), day 14 (dashed green line), and day 21 (dotted-dashed purples line) post-activation. (C) Temporal constants t20 (t < 500 μs) and t80 (t > 500 μs) over time post-activation. Temporal constants are plotted for each pulse and for each mouse (n = 360) on a given time point. (D) Temporal bias over time. Temporal bias is plotted for each pulse and each mouse (n = 360) on a given time point. (E) Normalized spectra averaged across pulses (n = 10). (F) Temporal evolution of harmonic (straight lines) and ultraharmonic (dashed lines) stable cavitation levels over the course of a treatment session (t = 120 s), averaged across mice (n = 3). Transparent lines indicate the evolution of harmonic cavitation levels for each mouse. (G) Temporal evolution of inertial cavitation levels over the course of a treatment session (t = 120 s), averaged across mice (n = 3). Transparent lines indicate the evolution of inertial cavitation levels for each mouse. (H) Stable harmonic (green circles), stable ultraharmonic (blue circles), and inertial (red circles) cavitation doses over time. A linear fit was performed on each dose (dashed lines) to investigate the average effect of storage time on cavitation dose in vivo. (I–L) Spectrograms for FUS treatments on days 0, 7, 14, and 21 post-activation. Dashed white lines indicate the time point of MB entrance into the focal volume.
Average spectra were qualitatively similar across time points (Figure 7E). Harmonics and broadband signal had similar fine structure and relative amplitudes. We detected a Doppler shift from moving MBs as an asymmetric broadening of the harmonics toward lower frequencies, especially in the 4th harmonic (i.e., 2 MHz). This effect has been observed before in vitro [62, 83] and in vivo [84], and was also detected in the in vitro experiment presented here (Figure 6E). Stable (Figure 7F) and inertial (Figure 7G) cavitation doses rose upon MB entrance into the focus and were sustained throughout the 2-min sonication, albeit at a diminishing trend due to MB clearance from the bloodstream. Despite the large variation of cavitation doses during treatment, the total cavitation doses for each mouse had non-significant variation over storage time (p = 0.89 for SCDh, p = 0.92 for SCDu, and p = 0.71 for ICD; Figure 7H). Linear regression was performed taking into account all data points per dose (n = 3 mice per day, i.e., total of n = 12 data points), to identify potential trends over time. Harmonic stable and inertial cavitation doses moderately increased (slope 3.5 and 10 mV/d), while ultraharmonic stable cavitation dose decreased on average over time (slope −10 mV/d). The increase of inertial cavitation was evident in the spectrograms of FUS treatments for day 0 (Figure 7I), day 7 (Figure 7J), day 14 (Figure 7K), and day 21 (Figure 7L). Normalized broadband signal increased over time, especially for frequencies higher than 3.5 MHz (Figures 7I–L). The broadband emissions were sustained throughout treatment on day 21, despite their relatively lower amplitude compared to previous time points (Figures 7G,L).
In vivo data were in general agreement with the in vitro results (Figure 6). On average, inertial cavitation response increased with storage time (Figures 6F, 7H–L). Interestingly, despite the initial decrease of temporal stability, as indicated the t20 and t80 reduction (Figures 6C, 7C), the in vivo response rebounded and appeared higher on day 21 (Figure 7C). This may be due to the increased persistence of broadband emissions during the entire treatment (Figure 7L). The in vivo environment is different compared to the in vitro conditions, in terms of temperature (37oC vs. 20oC), host liquid viscosity (i.e., blood vs. water), blood flow rates, etc. Therefore, simulation results (Figure 3) may not apply directly in vivo, since many of the assumptions are violated. Importantly, spatial confinement of MBs within the microvasculature significantly affects their response and longevity [23, 78, 80, 85]. Due to the low MB concentration used here (107 MBs/ml or ~5 × the clinical imaging dose), in vivo experiments were more prone to sampling errors due to the minute volumes required for intravenous injections into mice. Therefore, intravascular MB density may be different compared to the phantom channel, and may also differ across mice. This would affect the bubble-bubble interactions and the resulting acoustic emissions [74, 75].
Blood-Brain Barrier Opening Stability
Our main hypothesis in this study was that BBB opening efficiency is not affected by the MB storage time. T1-weighted contrast-enhanced MRI scans confirmed BBB opening within the targeted structure in every treated mouse (Figure 8A). BBB opening volume was not significantly different across days (p = 0.49, n = 3 mice per day). However, the average volume increased over time. Specifically, it was measured as 19.1 ± 7.1 mm3, 21.8 ± 14 mm3, 29.3 ± 2.5 mm3, and 38 ± 20.1 mm3 on day 0, 7, 14, and 21, respectively (Figure 8B). Similar effects were observed in terms of contrast enhancement (Figure 8C). On average, there was no significant difference (p = 0.63, n = 3 mice per day). Yet, there was an increasing trend over time, with measured enhancements being 24.9 ± 1.7%, 23.7 ± 11.7%, 28.9 ± 5.3%, and 35 ± 13.4% on day 0, 7, 14, and 21, respectively.
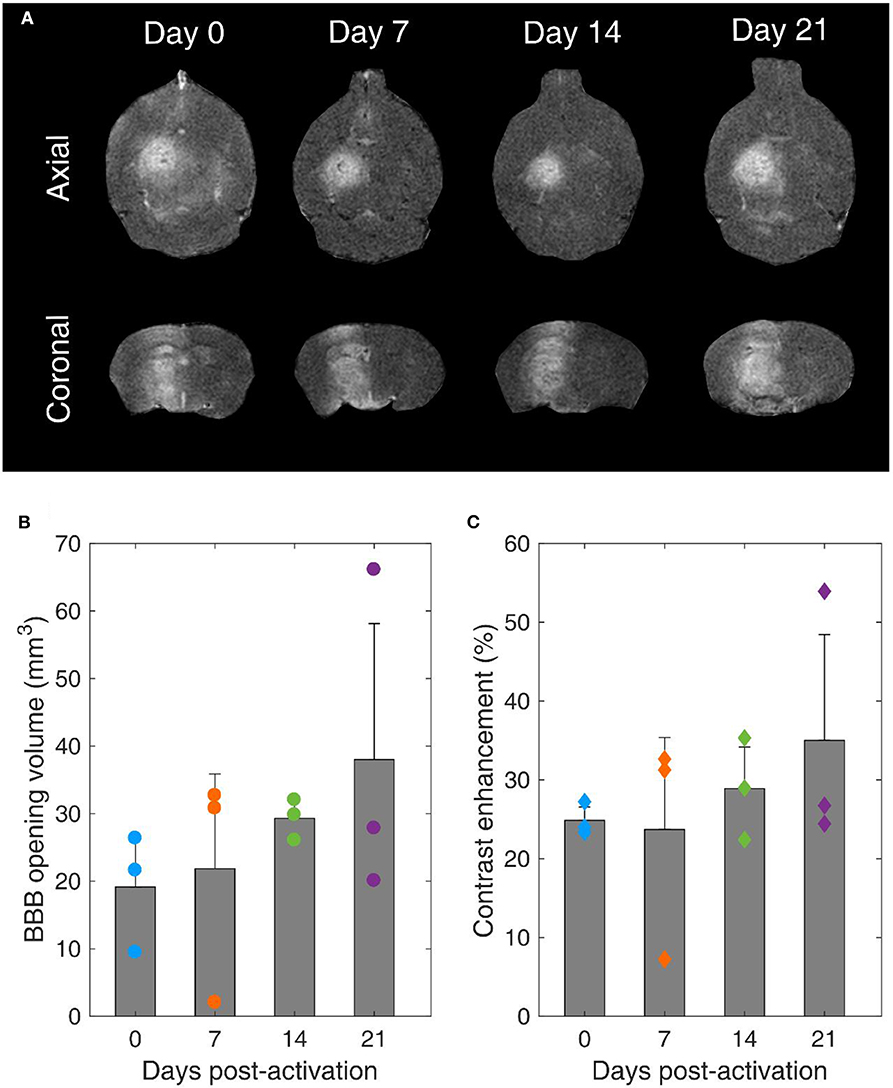
Figure 8. Blood-brain barrier opening over time. (A) Contrast-enhanced T1-weighted MRI axial (upper row) and coronal (lower row) scans for mice treated with FUS on day 0, 7, 14, and 21 after microbubble activation. (B) BBB opening volume over time. (C) Contrast enhancement over time. Gray bars indicate average values and error bars indicate standard deviation (n = 3 mice).
It is well-established that the MB response dictates both BBB opening volume and contrast enhancement [22, 63, 86, 87]. Despite the non-significant average differences, the increasing trends can be explained in the light of reduced stability during exposure and increased broadband response over time (Figures 6F, 7H–L). Broadband emissions are typically associated with existence of inertial cavitation [88]. Inertial MB collapses trigger jet formation and exert excessive stresses on the endothelial cells of vascular walls [89], thereby compromising safety [90]. Nevertheless, the relative amplitude of harmonic over broadband signals suggests that stable cavitation was the dominant mode both in vitro and in vivo with these treatment conditions (Table 2) at every time point (Figures 6F, 7H).
Our findings confirmed our initial hypothesis that long-term storage of activated MBs has no significant effect on BBB opening efficiency (Figures 8B,C). Currently, MBs are typically used once immediately after activation. We show here that this is not necessary, since MBs can be used multiple times following activation for up to 3 weeks post-activation without losing their therapeutic efficacy. This observation is likely to reduce the cost of both pre-clinical and clinical applications, provided that sterility is ensured throughout the storage period.
More importantly, the majority of the MBs used for therapeutic applications were originally designed and manufactured for contrast-enhanced ultrasound imaging applications. This study highlights the need for purpose-built MBs that are tailored to the intended therapeutic application, for example FUS-mediated BBB opening. Microbubble shell constitution affects the cavitation response of MBs exposed to therapeutic ultrasound pulses (Figure 4). Although contrast agents such as Definity® or SonoVue® are optimal in providing contrast when exposed to microsecond-long imaging pulses, future therapeutic MBs should present enhanced temporal stability during low-frequency millisecond-long exposure (Figure 7), to avoid compromising safety. The stability metrics provided in this study (Figures 2, 4, 6, 7) may aid in the characterization of future MB formulations designed for therapeutic applications.
Conclusions
In this study, we evaluated the temporal stability of lipid-shelled MBs during therapeutic ultrasound exposure. Simulations showed that the stiffness and viscosity of the MB shell influences the MB oscillation dynamics. We found that viscosity is the parameter dominating the fragmentation pressure at therapeutically-relevant insonation parameters. A DSPC:DSPE-PEG2K molar ratio of 9:1 was more stable experimentally compared to other shell configurations. MB concentration decreased over storage time, with a decay constant of 0.02 d−1. However, there was limited change in the mean and maximum radii of the MB population (<10% variation). Storage time decreased the in vitro MB stability, decreasing stable cavitation response and promoting inertial cavitation over time. Similar response was observed in vivo, where we detected sustained inertial cavitation during therapeutic pulses only on day 21 post-activation. BBB opening volume and contrast enhancement were not significantly different across the tested time points, yet both followed an increasing trend. Our findings may be useful in understanding MB dynamics under therapeutic exposure and prove that repeated treatments using stored MBs are possible for both pre-clinical and clinical applications. Finally, this study highlights the need for MBs tailored to therapeutic applications and provides tools for assessing MB stability in the ultrasound therapy regime.
Data Availability Statement
The datasets generated for this study are available on request to the corresponding author.
Ethics Statement
The animal study was reviewed and approved by The Institutional Animal Care and Use Committee (IACUC) of Columbia University.
Author Contributions
AP, DJ, and EK conceived and designed the study. AR developed the numerical simulations of MB stability. LZ, MH, EC, RA, and RL conducted the in vitro experiments using MBs with variable shell composition. DJ and VB conducted the in vitro experiments using MBs over different time points. AF and NP conducted the measurements for MB size distribution determination. AP and AF conducted the in vivo experiments. AK-S conducted the MRI scans for BBB opening verification. AP, DJ, and EK wrote the manuscript. All authors discussed the data and approved the final manuscript.
Funding
This work was supported by the National Institutes of Health grants 5R01EB009041 and 5R01AG038961.
Conflict of Interest
EK is an inventor and owns intellectual property on some aspects of the technology presented here.
The remaining authors declare that the research was conducted in the absence of any commercial or financial relationships that could be construed as a potential conflict of interest.
Acknowledgments
The authors acknowledge the members of the Ultrasound Elasticity and Imaging Laboratory (UEIL) at Columbia University for useful insights and stimulating discussions. AP is grateful to Emilia Weber for graphics assistance.
References
1. Hynynen K, McDannold N, Vykhodtseva N, Jolesz FA. Noninvasive MR imaging-guided focal opening of the blood-brain barrier in rabbits. Radiology. (2001) 220:640–6. doi: 10.1148/radiol.2202001804
2. Konofagou EE. Optimization of the ultrasound-induced blood-brain barrier opening. Theranostics. (2012) 2:1223–37. doi: 10.7150/thno.5576
3. Apfel R. Sonic effervescence: a tutorial on acoustic cavitation. J Acoust Soc Am. (1997) 101:1227–37.
4. Lipsman N, Meng Y, Bethune AJ, Huang Y, Lam B, Masellis M, et al. Blood–brain barrier opening in Alzheimer's disease using MR-guided focused ultrasound. Nat Commun. (2018) 9:2336. doi: 10.1038/s41467-018-04529-6
5. Carpentier A, Canney M, Vignot A, Reina V, Beccaria K, Horodyckid C, et al. Clinical trial of blood-brain barrier disruption by pulsed ultrasound. Sci Transl Med. (2016) 8:343re2. doi: 10.1126/scitranslmed.aaf6086
6. Wei K-C, Tsai H-C, Lu Y-J, Yang H-W, Hua M-Y, Wu M-F, et al. Neuronavigation-guided focused ultrasound-induced blood-brain barrier opening: a preliminary study in swine. AJNR Am J Neuroradiol. (2013) 34:115–20. doi: 10.3174/ajnr.A3150
7. Pouliopoulos AN, Wu S-Y, Burgess MT, Karakatsani ME, Kamimura HAS, Konofagou EE. A clinical system for non invasive blood brain barrier opening using a neuronavigation guided single element focused ultrasound transducer. Ultrasound Med Biol. (2020) 46:73–89. doi: 10.1016/j.ultrasmedbio.2019.09.010
8. Lindner JR. Microbubbles in medical imaging: current applications and future directions. Nat Rev Drug Discov. (2004) 3:527–32. doi: 10.1038/nrd1417
9. Cosgrove D. Ultrasound contrast agents: an overview. Eur J Radiol. (2006) 60:324–30. doi: 10.1016/j.ejrad.2006.06.022
10. Stride EP, Coussios CC. Cavitation and contrast: the use of bubbles in ultrasound imaging and therapy. Proc Inst Mech Eng Part H J Eng Med. (2010) 224:171–91. doi: 10.1243/09544119JEIM622
11. Borden MA, Kruse DE, Caskey CF, Shukui Zhao, Dayton PA, Ferrara KW. Influence of lipid shell physicochemical properties on ultrasound-induced microbubble destruction. IEEE Trans Ultrason Ferroelectr Freq Control. (2005) 52:1992–2002. doi: 10.1109/TUFFC.2005.1561668
12. O'Brien J-P, Stride E, Ovenden N. Surfactant shedding and gas diffusion during pulsed ultrasound through a microbubble contrast agent suspension. J Acoust Soc Am. (2013) 134:1416–27. doi: 10.1121/1.4812860
13. Owen J, Kamila S, Shrivastava S, Carugo D, Bernardino de la Serna J, Mannaris C, et al. The role of peg-40-stearate in the production, morphology, and stability of microbubbles. Langmuir. (2019) 35:10014–24. doi: 10.1021/acs.langmuir.8b02516
14. Hosny N a, Mohamedi G, Rademeyer P, Owen J, Wu Y, Tang M-X, et al. Mapping microbubble viscosity using fluorescence lifetime imaging of molecular rotors. Proc Natl Acad Sci USA. (2013) 110:9225–30. doi: 10.1073/pnas.1301479110
15. Lozano MM, Longo ML. Complex formation and other phase transformations mapped in saturated phosphatidylcholine/DSPE-PEG2000 monolayers. Soft Matter. (2009) 5:1822–34. doi: 10.1039/b820070j
16. Dicker S, Mleczko M, Siepmann M, Wallace N, Sunny Y, Bawiec CR, et al. Influence of shell composition on the resonance frequency of microbubble contrast agents. Ultrasound Med Biol. (2013) 39:1292–302. doi: 10.1016/j.ultrasmedbio.2013.02.462
17. Shekhar H, Smith NJ, Raymond JL, Holland CK. Effect of temperature on the size distribution, shell properties, and stability of definity®. Ultrasound Med Biol. (2018) 44:434–46. doi: 10.1016/J.ULTRASMEDBIO.2017.09.021
18. Mulvana H, Browning RJ, Luan Y, De Jong N, Tang MX, Eckersley RJ, et al. Characterization of contrast agent microbubbles for ultrasound imaging and therapy research. IEEE Trans Ultrason Ferroelectr Freq Control. (2017) 64:232–51. doi: 10.1109/TUFFC.2016.2613991
19. Wang S, Samiotaki G, Olumolade O, Feshitan J a, Konofagou EE. Microbubble type and distribution dependence of focused ultrasound-induced blood-brain barrier opening. Ultrasound Med Biol. (2014) 40:130–7. doi: 10.1016/j.ultrasmedbio.2013.09.015
20. Choi JJ, Feshitan JA, Baseri B, Shougang Wang, Yao-Sheng Tung, Borden MA, et al. Microbubble-Size dependence of focused ultrasound-induced blood–brain barrier opening in mice in vivo. IEEE Trans Biomed Eng. (2010) 57:145–54. doi: 10.1109/TBME.2009.2034533
21. Feshitan JA, Chen CC, Kwan JJ, Borden MA. Microbubble size isolation by differential centrifugation. J Colloid Interface Sci. (2009) 329:316–24. doi: 10.1016/j.jcis.2008.09.066
22. Sun T, Samiotaki G, Wang S, Acosta C, Chen CC, Konofagou EE. Acoustic cavitation-based monitoring of the reversibility and permeability of ultrasound-induced blood-brain barrier opening. Phys Med Biol. (2015) 60:9079. doi: 10.1088/0031-9155/60/23/9079
23. Chen H, Kreider W, Brayman A a, Bailey MR, Matula TJ. Blood vessel deformations on microsecond time scales by ultrasonic cavitation. Phys Rev Lett. (2011) 106:34301. doi: 10.1103/PhysRevLett.106.034301
24. Wu S-Y, Chen CC, Tung Y-S, Olumolade OO, Konofagou EE. Effects of the microbubble shell physicochemical properties on ultrasound-mediated drug delivery to the brain. J Control Release. (2015) 212:30–40. doi: 10.1016/j.jconrel.2015.06.007
25. Omata D, Maruyama T, Unga J, Hagiwara F, Munakata L, Kageyama S, et al. Effects of encapsulated gas on stability of lipid-based microbubbles and ultrasound-triggered drug delivery. J Control Release. (2019) 311–12:65–73. doi: 10.1016/j.jconrel.2019.08.023
26. Choi JJ, Pernot M, Small SA, Konofagou EE. Noninvasive, transcranial and localized opening of the blood-brain barrier using focused ultrasound in mice. Ultrasound Med Biol. (2007) 33:95–104. doi: 10.1016/j.ultrasmedbio.2006.07.018
27. McDannold N, Vykhodtseva N, Hynynen K. Effects of acoustic parameters and ultrasound contrast agent dose on focused-ultrasound induced blood-brain barrier disruption. Ultrasound Med Biol. (2008) 34:930–7. doi: 10.1016/j.ultrasmedbio.2007.11.009
28. Graham SM, Carlisle R, Choi JJ, Stevenson M, Shah AR, Myers RS, et al. Inertial cavitation to non-invasively trigger and monitor intratumoral release of drug from intravenously delivered liposomes. J Control Release. (2014) 178:101–7. doi: 10.1016/j.jconrel.2013.12.016
29. Morse SV, Boltersdorf T, Harriss BI, Chan TG, Baxan N, Jung HS, et al. Neuron labeling with rhodamine-conjugated Gd-based MRI contrast agents delivered to the brain via focused ultrasound. Theranostics. (2020) 10:2659–74. doi: 10.7150/thno.42665
30. Dayton PA, Allen JS, Ferrara KW. The magnitude of radiation force on ultrasound contrast agents. J Acoust Soc Am. (2002) 112:2183–92. doi: 10.1121/1.1509428
31. Koruk H, El Ghamrawy A, Pouliopoulos AN, Choi JJ. Acoustic particle palpation for measuring tissue elasticity. Appl Phys Lett. (2015) 107:223701–223704. doi: 10.1063/1.4936345
32. Kotopoulis S, Postema M. Microfoam formation in a capillary. Ultrasonics. (2010) 50:260–8. doi: 10.1016/j.ultras.2009.09.028
33. Lazarus C, Pouliopoulos AN, Tinguely M, Garbin V, Choi JJ. Clustering dynamics of microbubbles exposed to low-pressure 1-MHz ultrasound. J Acoust Soc Am. (2017) 142:3135–46. doi: 10.1121/1.5010170
34. Chen WS, Brayman AA, Matula TJ, Crum LA, Miller MW. The pulse length-dependence of inertial cavitation dose and hemolysis. Ultrasound Med Biol. (2003) 29:739–48. doi: 10.1016/S0301-5629(03)00029-2
35. Chen W-S, Brayman AA, Matula TJ, Crum LA. Inertial cavitation dose and hemolysis produced in vitro with or without optison. Ultrasound Med Biol. (2003) 29:725–37. doi: 10.1016/s0301-5629(03)00013-9
36. Segers T, Lohse D, Versluis M, Frinking P. Universal equations for the coalescence probability and long-term size stability of phospholipid-coated monodisperse microbubbles formed by flow-focusing. Langmuir. (2017) 3:10329–39. doi: 10.1021/acs.langmuir.7b02547
37. Postema M, Marmottant P, Lancée CT, Hilgenfeldt S, de Jong N. Ultrasound-induced microbubble coalescence. Ultrasound Med Biol. (2004) 30:1337–44. doi: 10.1016/j.ultrasmedbio.2004.08.008
38. Cho E, Chung SK, Rhee K. Streaming flow from ultrasound contrast agents by acoustic waves in a blood vessel model. Ultrasonics. (2015) 62:66–74. doi: 10.1016/j.ultras.2015.05.002
39. Doinikov AA, Bouakaz A. Acoustic microstreaming around a gas bubble. J Acoust Soc Am. (2010) 127:703–9. doi: 10.1121/1.3279793
40. Nyborg WL. Acoustic streaming near a boundary. J Acoust Soc Am. (1958) 30:329. doi: 10.1121/1.1909587
41. Alter J, Sennoga CA, Lopes DM, Eckersley RJ, Wells DJ. Microbubble stability is a major determinant of the efficiency of ultrasound and microbubble mediated in vivo gene transfer. Ultrasound Med Biol. (2009) 35:976–984. doi: 10.1016/J.ULTRASMEDBIO.2008.12.015
42. Ilovitsh T, Ilovitsh A, Foiret J, Caskey CF, Kusunose J, Fite BZ, et al. Enhanced microbubble contrast agent oscillation following 250 kHz insonation. Sci Rep. (2018) 8:16347. doi: 10.1038/s41598-018-34494-5
43. Pouliopoulos AN, Bonaccorsi S, Choi JJ. Exploiting flow to control the in vitro spatiotemporal distribution of microbubble-seeded acoustic cavitation activity in ultrasound therapy. Phys Med Biol. (2014) 59:6941–57. doi: 10.1088/0031-9155/59/22/6941
44. Pouliopoulos AN, Li C, Tinguely M, Garbin V, Tang M-X, Choi JJ. Rapid short-pulse sequences enhance the spatiotemporal uniformity of acoustically driven microbubble activity during flow conditions. J Acoust Soc Am. (2016) 140:2469–80. doi: 10.1121/1.4964271
45. O'Reilly MA, Waspe AC, Ganguly M, Hynynen K. Focused-Ultrasound disruption of the blood-brain barrier using closely-timed short pulses: influence of sonication parameters and injection rate. Ultrasound Med Biol. (2011) 37:587–94. doi: 10.1016/j.ultrasmedbio.2011.01.008
46. O'Reilly MA, Huang Y, Hynynen K. The impact of standing wave effects on transcranial focused ultrasound disruption of the blood-brain barrier in a rat model. Phys Med Biol. (2010) 55:5251–67. doi: 10.1088/0031-9155/55/18/001
47. Morse SV, Pouliopoulos AN, Chan TG, Copping MJ, Lin J, Long NJ, et al. Rapid short-pulse ultrasound delivers drugs uniformly across the murine blood-brain barrier with negligible disruption. Radiology. (2019) 291:459–66. doi: 10.1148/radiol.2019181625
48. Choi JJ, Selert K, Vlachos F, Wong A, Konofagou EE. Noninvasive and localized neuronal delivery using short ultrasonic pulses and microbubbles. Proc Natl Acad Sci USA. (2011) 108:16539–44. doi: 10.1073/pnas.1105116108
49. Gauthier M, King DA, O'Brien WD Jr. Evaluation of the temporal stability of definity using double passive cavitation detection. J Ultrasound Med. (2013) 32:1535–7. doi: 10.7863/ultra.32.9.1535
50. Marmottant P, van der Meer S, Emmer M, Versluis M, de Jong N, Hilgenfeldt S, et al. A model for large amplitude oscillations of coated bubbles accounting for buckling and rupture. J Acoust Soc Am. (2005) 118:3499–505. doi: 10.1121/1.2109427
51. Morgan KE, Allen JS, Dayton PA, Chomas JE, Klibaov AL, Ferrara KW. Experimental and theoretical evaluation of microbubble behavior: effect of transmitted phase and bubble size. IEEE Trans Ultrason Ferroelectr Freq Control. (2000) 47:1494–509. doi: 10.1109/58.883539
52. Chatterjee D, Sarkar K. A newtonian rheological model for the interface of microbubble contrast agents. Ultrasound Med Biol. (2003) 29:1749–57. doi: 10.1016/S0301-5629(03)01051-2
53. Härmark J, Hebert H, Koeck PJB. Shell thickness determination of polymer-shelled microbubbles using transmission electron microscopy. Micron. (2016) 85:39–43. doi: 10.1016/j.micron.2016.03.009
54. Sirsi S, Borden M. Microbubble compositions, properties and biomedical applications. Bubble Sci Eng Technol. (2009) 1:3–17. doi: 10.1179/175889709X446507
55. Segers T, Lassus A, Bussat P, Gaud E, Frinking P. Improved coalescence stability of monodisperse phospholipid-coated microbubbles formed by flow-focusing at elevated temperatures. Lab Chip. (2019) 19:158–67. doi: 10.1039/c8lc00886h
56. Shekhar H, Palaniappan A, Peng T, Lafond M, Moody MR, Haworth KJ, et al. Characterization and imaging of lipid-shelled microbubbles for ultrasound-triggered release of xenon. Neurotherapeutics. (2019) 16:878–90. doi: 10.1007/s13311-019-00733-4
57. Pouliopoulos AN, Burgess MT, Konofagou EE. Pulse inversion enhances the passive mapping of microbubble-based ultrasound therapy. Appl Phys Lett. (2018) 113:44102. doi: 10.1063/1.5036516
58. Heymans SV, Martindale CF, Suler A, Pouliopoulos AN, Dickinson RJ, Choi JJ. Simultaneous ultrasound therapy and monitoring of microbubble-seeded acoustic cavitation using a single-element transducer. IEEE Trans Ultrason Ferroelectr Freq Control. (2017) 64:1234–44. doi: 10.1109/TUFFC.2017.2718513
59. Wu S-Y, Aurup C, Sanchez CS, Grondin J, Zheng W, Kamimura H, et al. Efficient blood-brain barrier opening in primates with neuronavigation-guided ultrasound and real-time acoustic mapping. Sci Rep. (2018) 8:7978. doi: 10.1038/s41598-018-25904-9
60. Sennoga C, Mahue V, Loughran J, Casey J, Seddon JM, Tang M, et al. On sizing and counting of microbubbles using optical microscopy. Ultrasound Med Biol. (2010) 36:2093–6. doi: 10.1016/j.ultrasmedbio.2010.09.004
61. Shamout FE, Pouliopoulos AN, Lee P, Bonaccorsi S, Towhidi L, Krams R, et al. Enhancement of non-invasive trans-membrane drug delivery using ultrasound and microbubbles during physiologically relevant flow. Ultrasound Med Biol. (2015) 41:2435–48. doi: 10.1016/j.ultrasmedbio.2015.05.003
62. Pouliopoulos AN, Choi JJ. Superharmonic microbubble Doppler effect in ultrasound therapy. Phys Med Biol. (2016) 61:6154–71. doi: 10.1088/0031-9155/61/16/6154
63. Samiotaki G, Vlachos F, Tung YS, Konofagou EE. A quantitative pressure and microbubble-size dependence study of focused ultrasound-induced blood-brain barrier opening reversibility in vivo using MRI. Magn Reson Med. (2012) 67:769–77. doi: 10.1002/mrm.23063
64. Samiotaki G, Konofagou EE. Dependence of the reversibility of focused-ultrasound-induced blood-brain barrier opening on pressure and pulse length in vivo. IEEE Trans Ultrason Ferroelectr Freq Control. (2013) 60:2257–65. doi: 10.1109/TUFFC.2013.6644731
65. Borden MA, Zhang H, Gillies RJ, Dayton PA, Ferrara KW. A stimulus-responsive contrast agent for ultrasound molecular imaging. Biomaterials. (2008) 29:597–606. doi: 10.1016/j.biomaterials.2007.10.011
66. Sontum PC, Christiansen C. Precision and accuracy of analysis of air-filled albumin microspheres using coulter multisizer Mark II. J Pharm Biomed Anal. (1994) 12:1233–41. doi: 10.1016/0731-7085(94)00069-7
67. Borden MA, Longo ML. Dissolution behavior of lipid monolayer-coated, air-filled microbubbles: effect of lipid hydrophobic chain length. Langmuir. (2002) 18:9225–33. doi: 10.1021/la026082h
68. Smith MC, Crist RM, Clogston JD, McNeil SE. Zeta potential: a case study of cationic, anionic, and neutral liposomes. Anal Bioanal Chem. (2017) 409:5779–87. doi: 10.1007/s00216-017-0527-z
69. Lolicato F, Joly L, Martinez-Seara H, Fragneto G, Scoppola E, Baldelli Bombelli F, et al. The role of temperature and lipid charge on intake/uptake of cationic gold nanoparticles into lipid bilayers. Small. (2019) 15:1805046. doi: 10.1002/smll.201805046
70. du Plessis J, Ramachandran C, Weiner N, Müller DG. The influence of lipid composition and lamellarity of liposomes on the physical stability of liposomes upon storage. Int J Pharm. (1996) 127:273–8. doi: 10.1016/0378-5173(95)04281-4
71. Sierra C, Acosta C, Chen C, Wu S-Y, Karakatsani ME, Bernal M, et al. Lipid microbubbles as a vehicle for targeted drug delivery using focused ultrasound-induced blood-brain barrier opening. J Cereb Blood Flow Metab. (2016) 37:1236–50. doi: 10.1177/0271678X16652630
72. Luan Y, Lajoinie G, Gelderblom E, Skachkov I, van der Steen AFW, Vos HJ, et al. Lipid shedding from single oscillating microbubbles. Ultrasound Med Biol. (2014) 40:1834–46. doi: 10.1016/J.ULTRASMEDBIO.2014.02.031
73. van der Meer SM, Dollet B, Voormolen MM, Chin CT, Bouakaz A, de Jong N, et al. Microbubble spectroscopy of ultrasound contrast agents. J Acoust Soc Am. (2007) 121:648–56. doi: 10.1121/1.2390673
74. Stride E, Saffari N. Investigating the significance of multiple scattering in ultrasound contrast agent particle populations. IEEE Trans Ultrason Ferroelectr Freq Control. (2005) 52:2332–45. doi: 10.1109/TUFFC.2005.1563278
75. Yasui K, Lee J, Tuziuti T, Towata A, Kozuka T, Iida Y. Influence of the bubble-bubble interaction on destruction of encapsulated microbubbles under ultrasound. J Acoust Soc Am. (2009) 126:973–82. doi: 10.1121/1.3179677
76. Stride E, Saffari N. On the destruction of microbubble ultrasound contrast agents. Ultrasound Med Biol. (2003) 29:563–73. doi: 10.1016/S0301-5629(02)00787-1
77. Chomas JE, Dayton P, May D, Ferrara K. Threshold of fragmentation for ultrasonic contrast agents. J Biomed Opt. (2001) 6:141–50. doi: 10.1117/1.1352752
78. Martynov S, Stride E, Saffari N. The natural frequencies of microbubble oscillation in elastic vessels. J Acoust Soc Am. (2009) 126:2963–72. doi: 10.1121/1.3243292
79. Hosseinkhah N, Chen H, Matula TJ, Burns PN, Hynynen K. Mechanisms of microbubble-vessel interactions and induced stresses: a numerical study. J Acoust Soc Am. (2013) 134:1875–85. doi: 10.1121/1.4817843
80. Hosseinkhah N, Hynynen K. A three-dimensional model of an ultrasound contrast agent gas bubble and its mechanical effects on microvessels. Phys Med Biol. (2012) 57:785–808. doi: 10.1088/0031-9155/57/3/785
81. Caskey CF, Kruse DE, Dayton PA, Kitano TK, Ferrara KW. Microbubble oscillation in tubes with diameters of 12, 25, and 195 microns. Appl Phys Lett. (2006) 88:1–3. doi: 10.1063/1.2164392
82. Wiedemair W, Tuković Ž, Jasak H, Poulikakos D, Kurtcuoglu V. On ultrasound-induced microbubble oscillation in a capillary blood vessel and its implications for the bloodbrain barrier. Phys Med Biol. (2012) 57:1019–45. doi: 10.1088/0031-9155/57/4/1019
83. Pouliopoulos AN, Smith C, El Ghamrawy A, Tang M, Choi JJ. Doppler passive acoustic mapping for monitoring microbubble velocities in ultrasound therapy. J Acoust Soc Am. (2017) 141:3491. doi: 10.1121/1.4987287
84. Pouliopoulos AN. Controlling microbubble dynamics in ultrasound therapy. (2017) 142:3135. doi: 10.25560/58142
85. Chen H, Brayman AA, Matula TJ. Characteristic microvessel relaxation timescales associated with ultrasound-activated microbubbles. Appl Phys Lett. (2012) 101:163704. doi: 10.1063/1.4761937
86. Vlachos F, Tung YS, Konofagou E. Permeability dependence study of the focused ultrasound-induced blood-brain barrier opening at distinct pressures and microbubble diameters using DCE-MRI. Magn Reson Med. (2011) 66:821–30. doi: 10.1002/mrm.22848
87. Chen H, Konofagou EE. The size of blood-brain barrier opening induced by focused ultrasound is dictated by the acoustic pressure. J Cereb Blood Flow Metab. (2014) 34:1197–204. doi: 10.1038/jcbfm.2014.71
88. Shi WT, Forsberg F, Tornes A, Østensen J, Goldberg BB. Destruction of contrast microbubbles and the association with inertial cavitation. Ultrasound Med Biol. (2000) 26:1009–19. doi: 10.1016/S0301-5629(00)00223-4
89. Hwang JH, Tu J, Brayman AA, Matula TJ, Crum LA. Correlation between inertial cavitation dose and endothelial cell damage in vivo. Ultrasound Med Biol. (2006) 32:1611–9. doi: 10.1016/j.ultrasmedbio.2006.07.016
Keywords: focused ultrasound, microbubbles, temporal stability, contrast agents, passive cavitation detection, blood-brain barrier
Citation: Pouliopoulos AN, Jimenez DA, Frank A, Robertson A, Zhang L, Kline-Schoder AR, Bhaskar V, Harpale M, Caso E, Papapanou N, Anderson R, Li R and Konofagou EE (2020) Temporal Stability of Lipid-Shelled Microbubbles During Acoustically-Mediated Blood-Brain Barrier Opening. Front. Phys. 8:137. doi: 10.3389/fphy.2020.00137
Received: 27 November 2019; Accepted: 08 April 2020;
Published: 06 May 2020.
Edited by:
Anthony Novell, UMR8081 Imagerie par Résonance Magnétique Médicale et Multi-Modalités (IR4M), FranceReviewed by:
Jean-Michel Escoffre, INSERM U1253Imagerie et Cerveau (iBrain), FranceShashank Sirsi, The University of Texas at Dallas, United States
Copyright © 2020 Pouliopoulos, Jimenez, Frank, Robertson, Zhang, Kline-Schoder, Bhaskar, Harpale, Caso, Papapanou, Anderson, Li and Konofagou. This is an open-access article distributed under the terms of the Creative Commons Attribution License (CC BY). The use, distribution or reproduction in other forums is permitted, provided the original author(s) and the copyright owner(s) are credited and that the original publication in this journal is cited, in accordance with accepted academic practice. No use, distribution or reproduction is permitted which does not comply with these terms.
*Correspondence: Elisa E. Konofagou, ZWsyMTkxQGNvbHVtYmlhLmVkdQ==