- 1V.E. Zuev Institute of Atmospheric Optics, Siberian Branch, Russian Academy of Sciences, Tomsk, Russia
- 2Tomsk Scientific Center, Siberian Branch, Russian Academy of Sciences, Tomsk, Russia
- 3Scientific and Innovative Enterprise TOPAZ, Tomsk, Russia
The results of our investigations on the control over the orbital angular momentum (OAM) of a laser beam synthesized through combination of wave fields of a fiber array are reviewed. Peculiarities of OAM formation in the case of control over the value of phase shifters of individual sub-beams are studied theoretically and experimentally. The conditions for formation of vortex beams with the given value of the orbital angular momentum are determined. The information coding by the OAM value is demonstrated in laboratory experiments. Statistical characteristics of vortex Laguerre—Gaussian and synthesized laser beams propagating through the turbulent atmosphere are studied theoretically. Versatile models are proposed for the probability density function of radiation intensity fluctuations in the cross section of an arbitrary-type beam propagating through turbulence of different strength. The spectrum of azimuthal modes of the synthesized vortex beam at its formation and propagation is analyzed.
Introduction
In the last decades, the great attention is paid to laser beams with orbital angular momentum (OAM) [1–3] due to their particular properties, which have found a lot of applications [4–8]. The beams of this kind are referred to as optical vortices or vortex beams due to the presence of the transverse circulation component of the Pointing vector [1]. In particular, the feasibility of using optical vortices for information coding and transmission is intensely studied [7, 8]. The generation of vortex beams has become a new field of the new optical science – singular optics [9]. However, the development of relevant technologies requires creation of fast devices for generation of vortex beams with a tunable topological charge or OAM. Generation methods based on spatial light modulators (SLM) [10–12] are insufficiently fast and, as a rule, inefficient in conversion of one beam type into another. Their application allows beam OAM to be tuned with a frequency no higher than few kilohertzs. As a result, the development of new high-speed methods and devices for generation of vortex laser beams comes to the forefront. In some tasks, they should operate under conditions of high radiation intensity. In our opinion, the method of formation of vortex optical beams with the changeable orbital angular momentum based on an array of coherent fiber radiators is most adequate to the formulated problem. It implements the approach, whose idea occurred to us upon publication of Lachinova and Vorontsov [13]. The approach is based on the control over the phase of individual radiating subapertures. These subapertures are arranged hexagonally and make up a cluster (array) to provide for the phase progression of 2mπ while circling around the center of the synthesized beam. The main advantage of this approach is the possibility of fast (with a frequency higher than 109 Hz) phase shift at subapertures, which provides for a change of OAM.
This review analyzes the possibility of creating a system for generation of laser beams, in particular, vortex laser beams, with the spatial structure controllable in real time based on the Coherent Beam Combining principles [13, 14]. First, some peculiarities of formation of vortex beams synthesized from the different number of sub-beams are determined [15–19]. Then, the corresponding experimental setup is schematically described, along with its main operating principles and experimental results obtained with it [20, 21]. Finally, the results of numerical simulation of the propagation of synthesized beams in the turbulent atmosphere are given [15–17, 22].
Generation of Vortex Beam Based on Coherent Combining of Fields From Elements of the Fiber Cluster. Numerical Experiment
The complex amplitude of the field of a synthesized vortex beam can be presented in the following form
where Na is the number of sub-beams (subapertures) in the array, and are coordinates of the centers of sub-beams arranged in a circle or a hexagon, asub is the sub-aperture radius. It should be noted that the central sub-beam has the coordinates xc = 0, yc = 0. In addition, if the synthesized beam is formed from several sub-beam rings (Na= 18, 36, 60, and so on), internal rings may be absent.
We take the Laguerre—Gaussian beam
as a reference for the comparison with the synthesized beam given by Equations (1–4). Here, and θ = arctan(y/x) are polar coordinates, a is the beam radius, m is the radial mode index, and l is the value of the topological charge.
The amplitude and phase distributions for the field of this beam with the topological charge l = 3 are shown in Figure 1. It can be seen that the number of subapertures making up the synthesized vortex beam analogous to the fundamental Laguerre—Gaussian beam (5) determines the radius of an individual subaperture. In addition, it is obvious that the number of subapertures also determines the maximal possible value of the topological charge of the vortex beam, which can be achieved in this way.
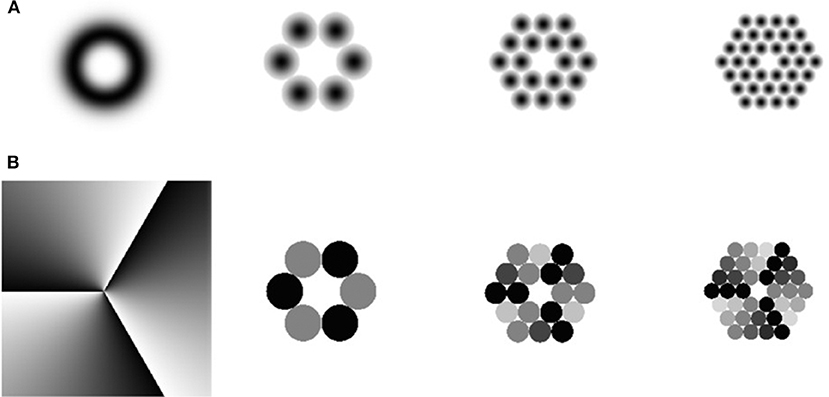
Figure 1. (A) Amplitude and (B) phase distributions of the fields of Laguerre –Gaussian (Equation 5) and synthesized vortex (Equations 1–4) beams with a topological charge l = 3 [17].
Figure 2 shows the amplitude and phase distribution of the field of the synthesized vortex beam with the topological charge l = 3 upon propagation in the free space to the distance equal to a half diffraction length (k0 = 2π/λ is the wave number, λ is wavelength) corresponding to the traditional Laguerre—Gaussian beam of the radius a. It can be seen that during the propagation, the amplitude and phase of vortex beams synthesized from 18 or 36 subapertures behave similarly to those of the Laguerre—Gaussian beam – the ring amplitude distribution and the screw phase distribution with the progression of 2lπ while circling around the beam center are observed. However, as the beam synthesized of six apertures propagates, no vortex components appears, and only the interference pattern from the interaction between subaperture radiation is seen. This is explained by the fact that no less than 3l radiation sources are necessary to generate a field with the nonzero orbital angular momentum l. In this case, for formation of a vortex beam with the topological charge l = 3, the minimal number of subapertures arranged in a circle should be nine.
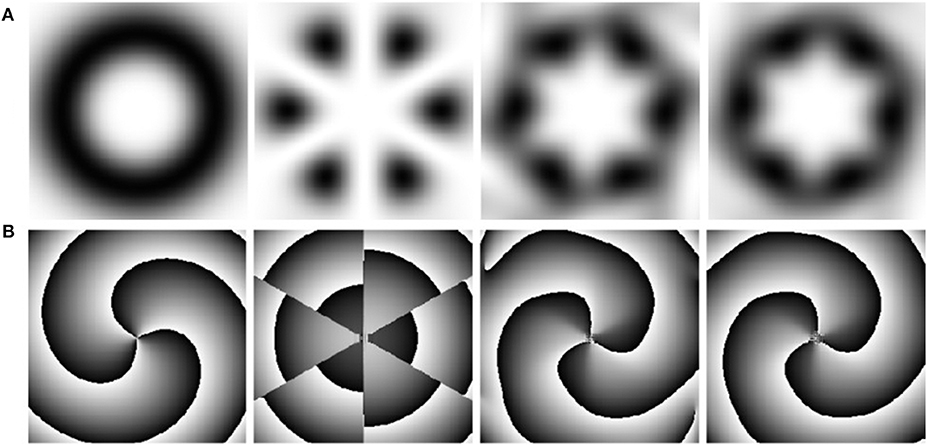
Figure 2. (A) Amplitude and (B) phase distributions of the fields of the Laguerre –Gaussian and synthesized vortex beams shown in Figure 1 during the beam propagation in a free space to a distance z = 0.5 k0a2 [17].
In the study of the influence of the synthesized beam structure (number of sub-beam rings) on the formation of an optical vortex, it was found that the radiation from subapertures lying in the inner ring of the fiber cluster weakly affects the formation of the orbital angular momentum of the synthesized vortex beam. In this case, the maximal topological charge lmax is determined by the number of subapertures in the outer ring () and is independent of the number of inner rings (lmax=/3). It should be also noted that for the topological charge close to the maximal value lmax, the smoothed amplitude and phase distributions of the field form much more quickly (at shorter distances) if there is only one ring (no inner rings). The main property of field (1–4) manifests itself at the propagation in a free space. It consists in the fact that the intensity and phase distributions of the synthesized and ordinary Laguerre—Gaussian beams are widely different in the near zone (at short distances z < < zd) and close in the far zone (at distances comparable with the Rayleigh diffraction length zd = 0.5 k0a2 and longer) [16, 17]. Let us consider the free propagation of the field with initial distribution (1–4) by representing it as an expansion in azimuthal modes
and calculate the energy fractions corresponding to the modes of different order n
where,
We have succeeded in determining [17] that as the synthesized beam propagates at the initial part of the distance in the near-axial zone (whose size is comparable with the initial size of the beam), the energy transfers between modes corresponding to different values of n. In the course of the propagation, the energy of the mode n, whose order is equal to the given topological charge l, increases and saturates to the level close to 100% of the total energy. Thus, as the synthesized vortex beam propagates to the distance exceeding several tenth fractions of the Rayleigh diffraction length, the beam properties in the near-axial zone approach the properties of the Laguerre—Gaussian beam (5).
We have studied the orbital angular momentum of the synthesized beam (1), as well as the structure of its wavefront [18, 19]. For this purpose, we have calculated the transverse component of the Pointing vector, which can be represented in the following form in the paraxial approximation [1]
where I(r, z) and φ(r, z) are the intensity and phase of the field E(x, y, z). With allowance for Equation (10), we can write the equation for the normalized (specific) density of the orbital angular momentum [1]
where is the power of radiation, nz is the unit vector in the direction of the radiation propagation axis.
The orbital angular momentum of the laser beam at the distance z upon normalization to the beam power [1] is calculated by as follows:
The calculation of the orbital angular momentum by Equation (12) for the initial field specified by Equations (1–4) gives zero values for any values of the parameters l and Na both in the initial plane and at any distance from it.
It should be reminded that as the number of subapertures in the fiber cluster increases, the transverse phase distribution in the central part of the beam in the course of its propagation becomes closer to the screw structure characteristic of the Laguerre—Gaussian vortex beam. It was assumed in the calculations that all the radiating subapertures form nested hexagonal rings. This structure in the initial plane is shown in Figure 3.

Figure 3. Geometry of subaperture arrangement (A), intensity (B), and phase (C) distribution for the synthesized beam of 36 subapertures in the plane; l = 1 [18].
In this configuration of 36 subapertures, according to Equations (1–4), the subaperture phase φsub takes 24 different values. Every three phase values at the subapertures lying at six rays outgoing from the center are equal.
We assume that the propagation of laser beams in the atmosphere is described quite accurately by the parabolic equation for the complex amplitude of the field:
where n1(x, y, z) are variations of the refractive index (in this section n1(x, y, z) = 0). Our computational schemes employ the method for numerical solution of Equation (13) based on splitting by physical factors [23] implemented in the parallel code [24].
To study the dependence of the received OAM value on the radius of the receiving aperture, the integration over the unlimited plane in Equation (12) was replaced with the integration over a circle with the radius at and the center at the beam axis
where
Figure 4 shows the results of calculation of the intensity, phase, and OAM density distributions for the beam formed of 36 sub-beams at the distance , where , is the radius of the synthesized beam as determined in Figure 3A.
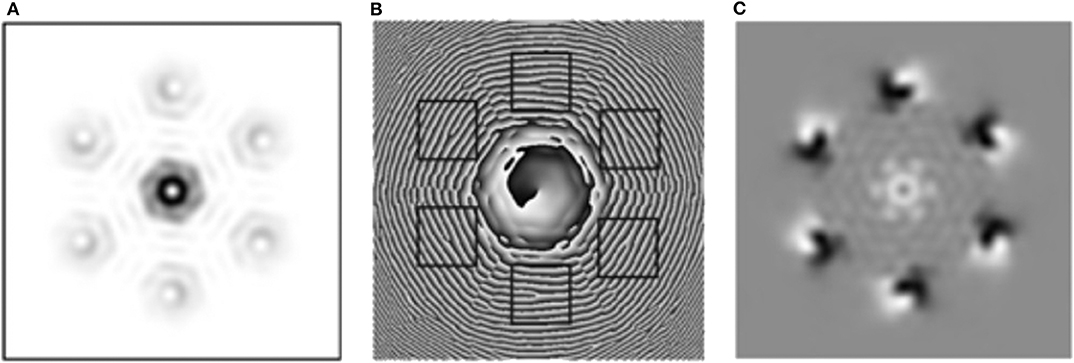
Figure 4. Intensity (A), phase (B), and OAM density (Equation 11) (C) distributions of the synthesized vortex beam at the end of the distance z/zd0 = 0.4, simulation domain of L/a0 = 80, 3096 × 3096 computational grid. Squares show the zones containing peripheral screw phase dislocations at the vertices of the regular hexagon [18].
The OAM density (Equation 11) distribution is shown in Figure 4C. The light shade in this figure corresponds to the positive density, while the dark one is for the negative density values. It can be seen that the OAM density is nonzero in the central part, where the density is positive. In addition, there are six zones located at the hexagon vertices at the beam periphery, within which the OAM density is nonzero. The OAM density at these zones takes both positive and negative values. Thus, in the interference field of the synthesized beam, the zone of nonzero OAM density is multiply connected and alternating-sign in contrast to the simply connected OAM density of the Laguerre—Gaussian beam [25].
The received power and Lz(at) as functions of the radius at are shown in Figure 5. One can see that for the receiving aperture with the radius at/a0 ≤ 3 the OAM value is close to unity, while for the receiving aperture with the radius at/a0 > 6 the OAM value is close to zero.
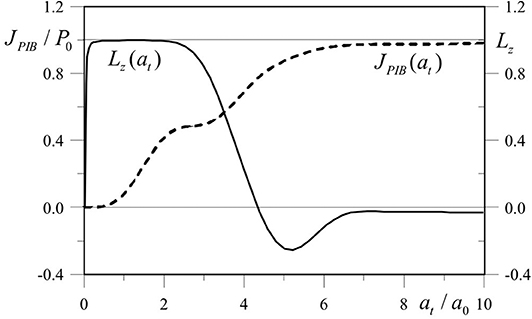
Figure 5. Energy and OAM as functions of the radius of the receiving aperture. The parameters of the calculations are the same as in Figure 4 [18].
The behavior of the OAM curve in Figure 5 demonstrates how the presence of positive and negative values of the OAM density described by Equation (11) affects the OAM value within the limited aperture (14). It can be seen that Lz(at) tends to zero at at → ∞. Thus, the OAM value of the synthesized beam fully intercepted by the receiving aperture is equal to zero at any point of the path. This result reflects the principle of OAM conservation.
The study of the phase gradient circulation demonstrates [18, 19] that this characteristic also reflects the features of hexagonal arrangement of subapertures. In the near-axial part of the beam, there is a limited zone, within which the integral of the OAM density is equal to unity. The circulation of the phase gradient over the perimeter of this zone is equal to 2π.
Thus, in Dudorov et al. [15] and Aksenov et al. [16–19] we have studied theoretically the influence of the number of radiating apertures Na, and their arrangement on the phase and intensity distribution of the synthesized beam in the far wave field for different given values of OAM. It has been shown that OAM of the beam synthesized by the proposed method is equal to zero at the complete interception by the receiving aperture. However, the aperture limitation of the beam in the receiving area allows us to separate the central part of the synthesized beam and to assign the non-zero OAM to it. In this case, the central ring of the vortex beam carries about 50% of the power emitted by the synthesized aperture at Na = 6, l = 1 and 70% of the power at Na = 18, l = 1.
Vortex Beam Generation Based on Coherent Combining of Fields of the Fiber Cluster. Experimental Setup and Laboratory Studies
Vortex beams with l = 1 and l =2 were obtained experimentally for the first time by us with an array of six coherent Gaussian sub-beams arranged in a circle by setting a fixed phase shift between neighboring sub-beams [20]. In Aksenov et al. [21], the experimental setup was significantly modernized, and new experimental data were obtained. Further on, we follow the paper Aksenov et al. [21].
Consider the experiment and, in the first turn, the experimental setup in detail (Figure 6).
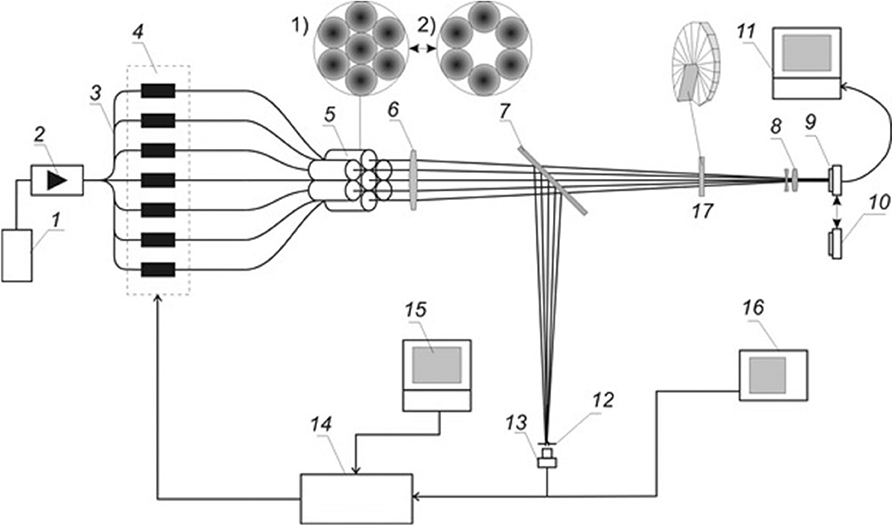
Figure 6. Diagram of the experimental setup: narrowband laser (1), optical fiber amplifier (2), fiber splitter (3), phase modulators (4), fiber collimators (5), long-focus lens (6), beam splitting plate (7), lenslet (8), beam profiler (9), Shack–Hartmann sensor (10), computer (11), pinhole (12), broadband photodetector (13), optimizing multichannel SPGD processor (14), control computer (15), oscilloscope (16), spiral phase plate (17). Arrangement of subapertures for coherent beam combining: 1) in the experiment on synthesis of a beam with maximal intensity at the axis, 2) in the experiment on synthesis of a vortex beam [21].
In our experiment, the linearly polarized radiation of narrow-band (Δf = 3 MHz) semiconductor laser 1 with the central wavelength λ = 1,064 nm and the output power up to 150 mW was amplified by fiber amplifier 2 with the tunable amplification factor from 0 to 33 dBm. The amplified radiation was split into eight channels (power of every channel up to 15 mW) with fiber splitters 3. Six or seven working channels were used in the experiment. Every channel was connected by an optical fiber with one of seven integral LiNbO3 phase modulators 4 with the modulation frequency up to 150 MHz with the controllable phase shift in the range from 0 to > 6π in response to the applied voltage. Seven fiber collimators 5 (F = 100 mm) arranged hexagonally and forming a cluster of sub-beams [(1) in Figure 6] were installed at the output.
Each collimator formed a sub-beam with the Gaussian intensity distribution and the diameter dsub = 22 mm. The optical axes of all the sub-beams were aligned in parallel to each other thus forming an aperture with the diameter D = 90 mm. The set of sub-beams was focused by lens 6 with the focal length F = 1535 mm. Ophir-Spiricon SP503U beam profiler 9 with 1X10 micro-objective 8 was set in the focal plane of lens 6. The recorded intensity distribution of the synthesized beam was displayed at the monitor of computer 11. To provide for the phase control of the synthesized beam, 50:50 beam-splitting plate 7 was set in the radiation propagation channel. Plate 7 directed a part of the beam to Thorlabs PDA10CF-EC photodetector 13 equipped with pinhole 12. Photodetector 13 recorded the intensity of the interference maximum formed as a result of sub-beam superposition in the plane of pinhole 12. The signal from photodetector 13 was processed by multichannel processor 14 operating according to the stochastic parallel gradient descent (SPGD) algorithm [26]. The multichannel SPGD processor [27] with the clock frequency up to 240 kHz (100 kHz in the experiment) generated control signals for phase modulators 4 to maintain the maximal level of the signal at photodetector 13. Control parameters were set with computer 15. According to the SPGD algorithm, the maximum of the signal recorded by photodetector 13 corresponded to the in-phase state of all the sub-beams. Thus, the feedback loop providing for the phase synchronization of radiation of the constructed fiber array was formed.
To synthesize the vortex beam, it is first necessary to perform the initial synchronization of sub-beam phases, since the system is unstable due to thermal and acoustic fluctuations in the system elements including optical fiber [28].
The phase synchronization of the sub-beams forming the cluster was performed with the SPGD algorithm. As the SPGD was turned on, the in-phase state of the channels was achieved for the time shorter than 10 ms. Then the SPGD controller was turned off, and the signal drop was recorded at photodetector 13. The typical oscillogram of this process is shown in Figure 7. The time for one reading is 0.0325 s. The time for signal drop down to the 1/ level upon averaging over 10 realizations is 4.75 s. The signal drop time is caused by random phase progressions in fiber channels under experimental conditions and characterizes the particular system. During this time, the phase state of the system can be considered as frozen and sufficient for the phase modulation. Once the state of phase synchronization was achieved for all the six beams, the SPGD controller applied the voltages corresponding to the necessary phase shift to the phase modulators [20, 21]. The intensity distribution recorded by beam profiler 9 is shown in Figure 8.
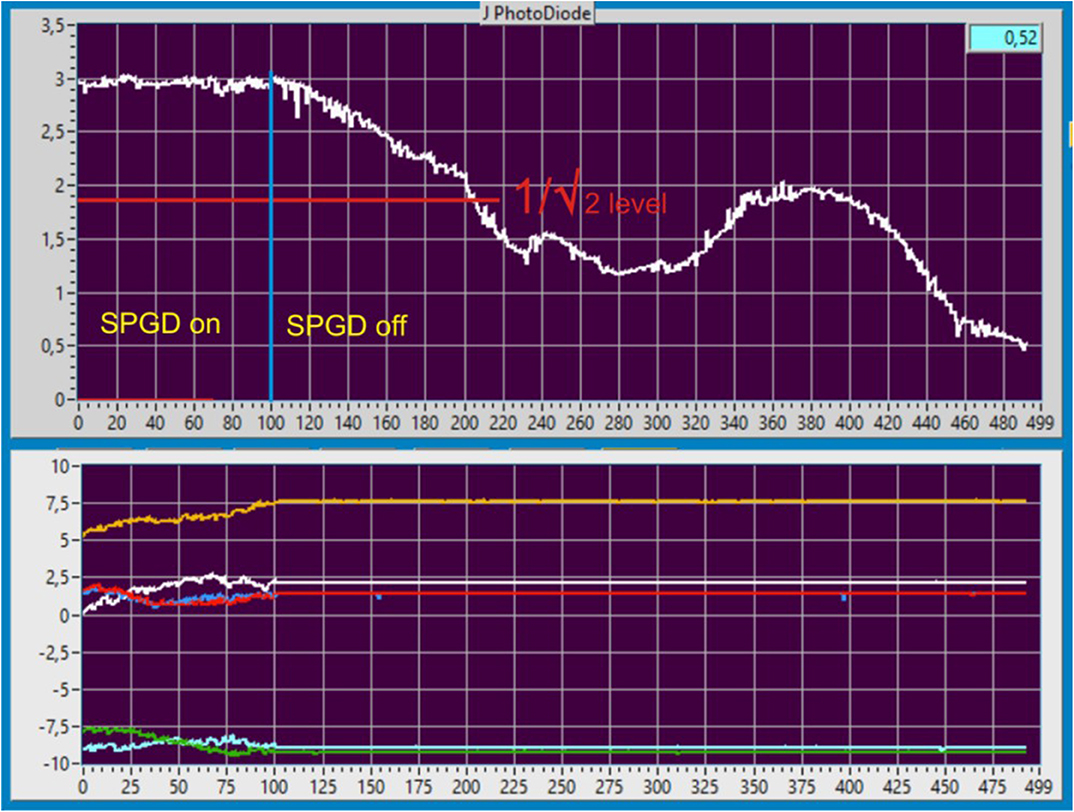
Figure 7. Oscillogram of the signal at photodetector 13 with the SPGD controller turned off (top oscillogram). Dynamics of voltage at phase modulators (bottom oscillogram). Once SPGD is turned off, all voltages at the phase modulators are zero. The blue vertical line in the top oscillogram is for the time of SPGD turning off, the red horizontal line is for the signal decrease √2 times [20].
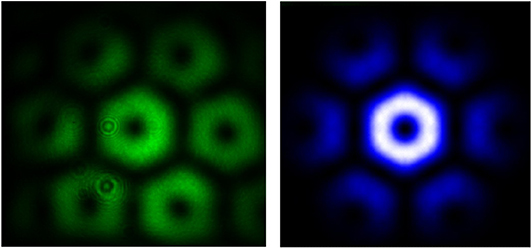
Figure 8. Experimental intensity distribution of the vortex beam l = 1 (left); result of numerical simulation [21] (right).
The intensity distribution has the nearly ring shape at the center and six surrounding rings formed in the zones of peripheral intensity maxima. The additional studies revealed that the stable lifetime of this pattern is no shorter than 2 s.
To check whether the obtained beam is a vortex beam, we used Shack–Hartmann sensor 10 (Thorlabs WFS20-5C-M) installed in place of the beam profiler. It allowed us to record the distribution of local wavefront tilts. Figure 9 shows two versions of the calculated radiation intensity distribution at the photodetector array of the Shack–Hartmann sensor, as well as the measured intensity distribution and measured wavefront tilts of the synthesized beam.
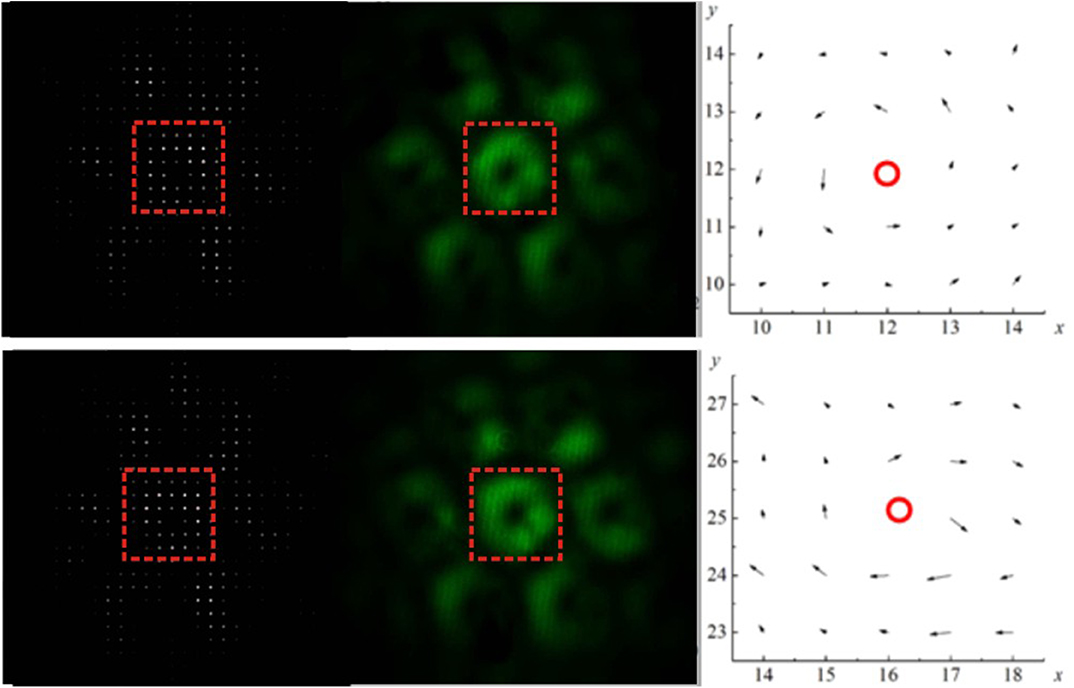
Figure 9. Calculated radiation intensity distribution at the photodetector array of the Shack–Hartmann sensor (left), measured radiation intensity distribution (center), and measured local wavefront tilts (right) of the synthesized vortex beam. Local wavefront tilts correspond to the zone shown by the red rectangle. Numbers of lenslets (lenslet array) of the Shack–Hartmann sensor are plotted at the axes. Red circle show the zone of the vortex center. The top line is for the optical vortex with l= +1, and the bottom line is for the optical vortex with l = −1 [21].
To determine the OAM sign and the degree of correspondence of the obtained intensity distribution to the vortex beam, we used additionally spiral phase plate 17. It was set in front of the beam profiler at the place where the sub-beams do not overlap and do not interfere yet. Its radial phase relief performed the uniformly distributed (over a circle with 32 levels) phase shift of the incident radiation from 0 to 2π (within λ = 1,064 nm) [29].
Thus, each of the six sub-beams corresponded to a special zone of the phase plate, at which the average phase shift differed from the average phase shift at the adjacent zone by 2π/6. Upon the passage through the plate, all the sub-beams acquired the extra phase shift by this value. If the direction of increase of the phase shift of the incident sub-beams coincided with the direction of increase of the phase shift at the spiral plate, then each sub-beam acquired an extra phase shift growing in the direction of increase of the phase shift at the plate. At the same time, the topological charge of the synthesized beam in the zone of overlapping of the sub-beams increased by one, while the profile of the intensity distribution kept the central zero value. However, if the direction of increase of the phase shift of the plate was opposing to the direction of increase of the phase shift of the sub-beams, each sub-beam, upon passage through the spiral phase plate, acquired the same extra phase shift, but opposite in sign. In this case, the phases of the sub-beams became equal to each other, and the resultant profile of the intensity distribution corresponded to the coherent combining of the beams.
Thus, the sigh of OAM of the synthesized vortex beam can be set by turning the spiral phase plate by 180° around any axis lying in its surface plane.
Propagation Of The Synthesized Beam Through The Turbulent Atmosphere
As was already mentioned, we studied the propagation of laser beams in the turbulent medium through the solution of parabolic wave Equation (13) with application of the phase screen method. In this case, the modified Andrews spectrum of fluctuations of the refractive index [29] in the following form was used:
Here, is the structure characteristic of the refractive index, κl = 3.3/l0, κ0 = 2π/L0, l0 and L0 are the inner and outer scales of turbulence.
The turbulent conditions of propagation were specified with the Rytov complex parameter or the Fried radius [30]. Here, z is the path length, k0 is the wave number. The statistical characteristics of intensity fluctuations were studied in numerical experiments. The following designations were used: the mean intensity 〈I(r)〉, where the square brackets are for the averaging over realizations of the turbulent medium, the variance of intensity fluctuations , and the relative variance of intensity fluctuations (scintillation index)
The scintillation index (17) was calculated under various turbulent conditions of propagation for the synthesized and fundamental beams [15, 16]. Statistical characteristics entering into Equation (17) were calculated through numerical simulation of more than 5,000 random realizations of the medium.
The same number of random realizations of the medium was used to calculate the statistical characteristics of azimuthal modal components (9) of the vortex beam propagating in the turbulent atmosphere and OAM of this beam [31]. However, in this case, the beam propagating through the turbulent atmosphere was no longer synthesized. Figure 10 shows random realizations and averaged spectra of angular harmonics of the Laguerre—Gaussian beam with the initial topological charge l = 4 upon propagation of the path length z = 2000 m in the statistically uniform and isotropic medium with the turbulence strength corresponding to the Rytov parameter 0.743.
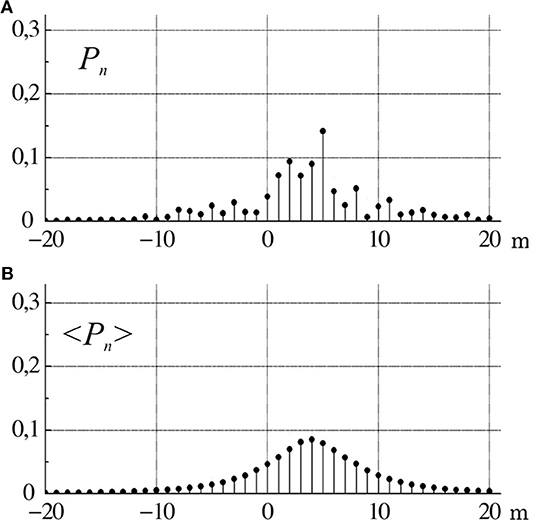
Figure 10. Spectrum of angular harmonics of the beam upon passage of the pathlength z = 2000 m in the medium with the Rytov index = 0.743: (A) random realization, (B) averaging over 5000 realizations.
Now let us dwell on the study of the probability density function (PDF) P(I) of intensity fluctuations of the traditional and synthesized beam [16, 17, 22].
Comparing the average intensities of the synthesized and Laguerre—Gaussian beams (Figure 11), we can see that they are approximately identical, and the variance of intensity fluctuations of the synthesized beam decreases with the increasing number of subapertures and tends to the corresponding values for the Laguerre—Gaussian beam.
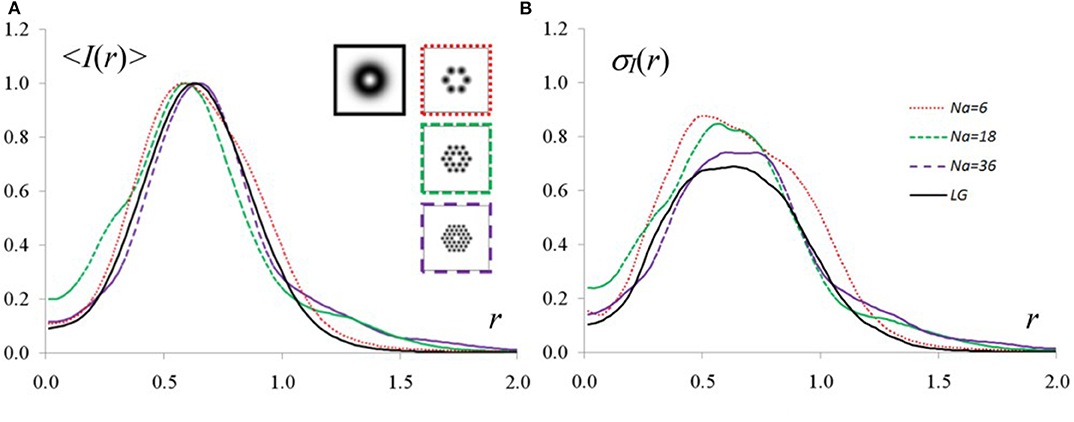
Figure 11. Distribution of the average intensity (A) and relative variance of intensity fluctuations (B) at the propagation of the traditional and synthesized vortex beams in the turbulent atmosphere. The beam parameters and propagation conditions are the following: l = 1, z = 0.1k0 a2 and D/r0 = 4 (D = 2a is the beam diameter, is the Fried parameter) [17].
Figure 12 compares PDFs of intensity fluctuations of the Gaussian, Laguerre—Gaussian, and synthesized (Na = 36) beams as obtained from the numerical experiment with the lognormal and gamma distributions [30, 32]. Atmospheric parameters correspond to the conditions of weak turbulence.
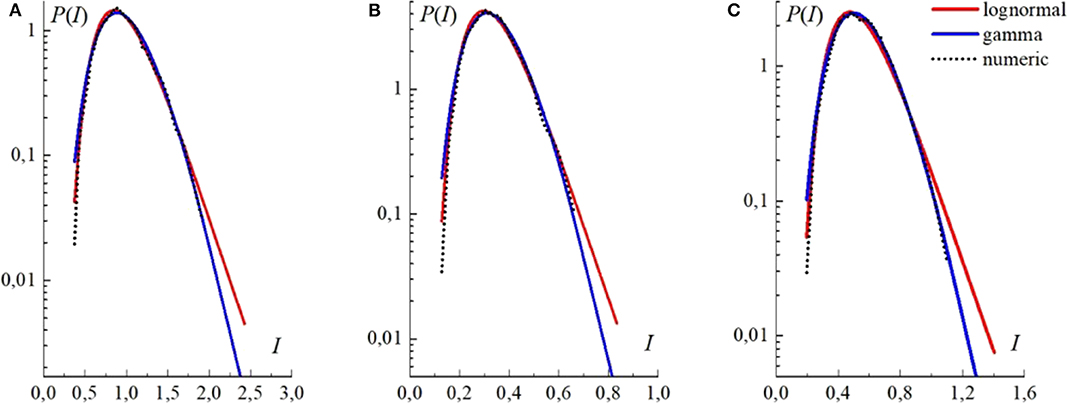
Figure 12. Probability density functions (PDFs) of intensity fluctuations (solid curves) (A) at the axis (r = 0) of the Gaussian beam, (B) at the peak point (r = 0.47a) of the average intensity distribution of the Laguerre—Gaussian beam, and (C) at the peak point (r = 0.47a) of the synthesized beam (Na= 36); σI(r) = 0.31, and σI(r) = 0.30 σI(r) = 0.31, respectively. Here, l = 1, z = 0.1zd, and the Rytov parameter . Dotted curves correspond to the lognormal distribution [30], and the dashed curve corresponds to the gamma distribution [32].
As the observation point shifts along the beam radius from the position of the maximal average intensity (the ring-shaped zone) to the beam periphery, the scintillation index increases and the PDF changes its shape.
Figure 13 demonstrates the numerical and analytical PDFs of intensity fluctuations of the Gaussian, Laguerre—Gaussian, and synthesized beams at the cross-section points lying at different distances from the center. It follows from the figure that the PDFs obtained in the numerical experiment do not follow the analytical models of PDF, although the propagation conditions correspond to weak turbulence (). The numerical PDFs in this case nearly coincide with the gamma distribution for the beams of all types.
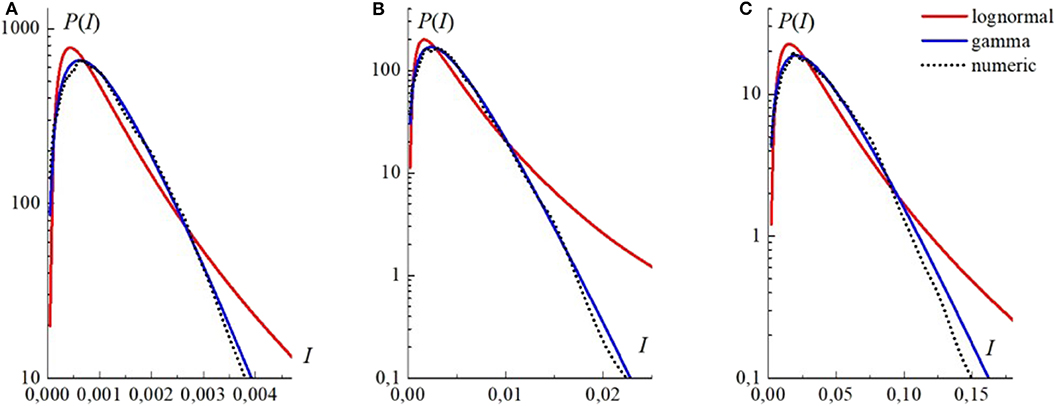
Figure 13. Probability density function (PDF) of intensity fluctuations for (A) the Gaussian beam at the point r = 1.9a; (B) for the Laguerre—Gaussian beam at the point r = 1.4a, and (C) for the synthesized beam at the point r = 0.94a; σ1(r) = 0.67, σ1(r) = 0.68, and σ1(r) = 0.69, respectively. The propagation conditions and the curve descriptions are the same as in Figure 12 [16].
The curves demonstrating the PDF behavior in Figure 13 can be well described by the gamma distribution. For the numerically obtained values of the scintillation coefficient, this distribution transforms into the negative exponential one [30], which is characteristic of the so-called strong intensity fluctuations, although the turbulent conditions of propagation still correspond to weak turbulence ().
Figure 14 shows the numerical and analytical PDFs of radiation intensity fluctuations at the axis (r = 0) of the Laguerre—Gaussian and synthesized beams, as well as at the periphery (r = 1.9a) of the Gaussian beam. It can be seen that at the very close scintillation indices for all the three beams, the shape of the PDFs is nearly identical as well.
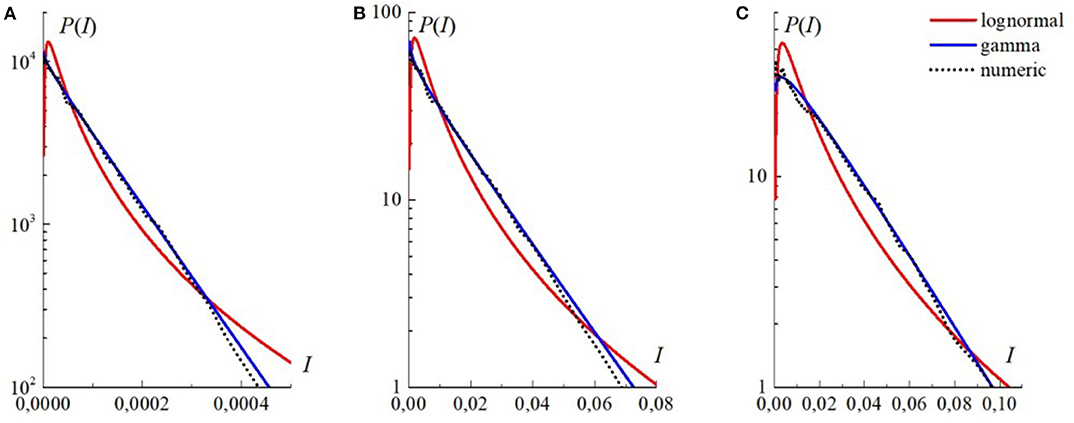
Figure 14. Probability density distribution: (A) at the axis (r = 0) of the Laguerre—Gaussian beam; (B) at the periphery (at the point r = 1.9a) of the Gaussian beam; (C) at the axis (r = 0) of the synthesized vortex beam with the unit topological charge and Na = 36. The values of σI(r) are 1.04, 1.02, and 0.95, respectively. The path length z = 0.1zd, and the Rytov parameter = 0.1. Dots correspond to the lognormal distribution density [30], dashed curves are drawn by the equation of the gamma distribution [15].
As a result of numerical experiments, the analysis of the PDFs obtained for various propagation conditions has shown that, regardless of the beam type and the position of the observation point at the beam axis, the PDF is determined by the scintillation index and the average radiation intensity at a given point. For intensity fluctuations with the scintillation index the probability density is well approximated by the gamma distribution. When the scintillation index the PDF behavior can be well approximated by the fractional exponential distribution [33]. Similarly to the gamma distribution, this distribution tends to the negative exponential distribution [30], when the scintillation index tends to unity.
Summary and Conclusion
In this paper, we have reviewed the results of numerical simulation, presented schematically the experimental setup, and reported the results of laboratory experiments on generation of a vortex laser beam through coherent combining of laser sub-beams formed by a cluster (array) of fiber radiators. The synthesized wave field is formed as a result of interference of individual sub-beams at the given relations between phase pistons of these sub-beams.
The results obtained mostly by the authors have been described. The requirements on parameters of the vortex beam generator (number and size of subapertures and their mutual arrangement) have been formulated. The spatial evolution of the wave field structure during formation of the synthesized beam has been considered. The problems have been formulated and the methods to achieve the temporal stability of the synthesized beam have been proposed. The feasibility of on-line control of the orbital angular momentum of the beam has been studied. The spatial dynamics of the synthesized beam is analyzed in the comparison with the traditional Laguerre—Gaussian beam in a free space and in the turbulent atmosphere. The statistical characteristics of intensity fluctuations in the cross section of the synthesized beam propagating through the turbulent atmosphere have been investigated. The distribution laws of intensity fluctuations have been examined and new models for their description have been proposed. The theoretical analysis of propagation of these beams in the turbulent atmosphere indicates that the statistical regularities of intensity fluctuations and OAM fluctuations mostly follow the statistical regularities of propagation of already well-studied Laguerre—Gaussian beams [25, 33–38].
It should be noted that different aspects of development of the technology for generation of vortex beams through coherent combining of wave fields from an array of coherent radiators and the propagation of synthesized optical beams are also studied by other research groups [39, 40].
Our plans for further development of this field of research include the analysis of applicability of the coherent combining technology to generation of vector vortex beams, which are now generated by other methods [41]. In addition, it should be noted that the practical application of this technology, as well as other technologies, for information transfer by a laser beam in open atmospheric channel face the problem of turbulent distortions of a beam. That is why the issues of adaptive compensation of these distortions are quite urgent. Our tentative results demonstrate that the methods of adaptive optics can be included in communication systems based on this technology without significant extra expenses.
Author Contributions
VA and VD formulated the concept, form, and subject of the study and wrote sections Introduction and Generation of Vortex Beam Based on Coherent Combining of Fields From Elements of the Fiber Cluster. Numerical Experiment. VK and ML wrote section Vortex Beam Generation Based on Coherent Combining of Fields of the Fiber Cluster. Experimental Setup and Laboratory Studies. VA, VD, and VK contributed to section Propagation of the Synthesized Beam Through the Turbulent Atmosphere. All authors took part in editing the manuscript, read and approved the final version.
Funding
Russian Science Foundation (18-19-00437); Russian Foundation for Basic Research (18-29-20115\18); Ministry of Science and Higher Education of the Russian Federation (Project No. AAAA-A17-117021310143-2).
Conflict of Interest
ML was employed by company Scientific and Innovative Enterprise TOPAZ.
The remaining authors declare that the research was conducted in the absence of any commercial or financial relationships that could be construed as a potential conflict of interest.
References
1. Allen L, Beijersbergen MW, Spreew RJC, Woerdman JP. Orbital angular momentum of light and the transformation of Laguerre-Gaussian laser modes. Phys Rev. A. (1992) 45:8185–9. doi: 10.1103/PhysRevA.45.8185
2. Franke-Arnold S, Allen L, Padgett MJ. Advances in optical angular momentum. Laser&Photon Rev. (2008) 2:299–313. doi: 10.1002/lpor.200810007
3. Torres JP, Torner LE, editors. Twisted photons: Applications of Light with Orbital Angular Momentum. Weinheim: Wiley-VCH (2011). doi: 10.1002/9783527635368
4. Yao AM, Padgett MJ. Orbital angular momentum: origins, behavior and applications. Adv Opt Photon. (2011) 3:161–204. doi: 10.1364/AOP.3.000161
5. Friese MEJ, Enger J, Rubinsztein-Dunlop H, Heckenberg NR. Optical angular-momentum transfer to trapped absorbing particles. Phys Rev A. (1996) 54:1593–6. doi: 10.1103/PhysRevA.54.1593
6. Fickler R, Lapkiewicz R, Plick WN, Krenn M, Schae C, Ramelow S, et al. Quantum entanglement of high angular momenta. Science. (2012) 338:640–3. doi: 10.1126/science.1227193
7. Wang J, Yang JY, Fazal IM, Ahmed N, Yan Y, Huang H, et al. Terabit free-space data transmission employing orbital angular momentum multiplexing. Nat Photon. (2012) 6:488–96. doi: 10.1038/nphoton.2012.138
8. Willner AE, Huang H, Yan Y, Ren Y, Ahmed N, Xie G, et al. Optical communications using orbital angular momentum beams. Adv Opt Photon. (2015) 7:66–106. doi: 10.1364/AOP.7.000066
9. Soskin MS, Vasnetsov MV. Singular Optics. Progress Optics. (2001) 42:219–76. doi: 10.1016/S0079-6638(01)80018-4
10. Moreno I, Davis JA, Melvin B, Pascoguin L, Mitry MJ, Cottrell DM. Vortex sensing diffraction gratings. Opt Lett. (2009) 34:2927–9. doi: 10.1364/OL.34.002927
11. Barboza R, Bortolozzo U, Clerc MG, Residori S, Vidal-Henriquez E. Optical vortex induction via light-matter interaction in liquid-crystal media. Adv Opt Photon. (2015) 7:635–83. doi: 10.1364/AOP.7.000635
12. Forbes A, Dudley A, McLaren M. Creation and detection of optical modes with spatial light modulators. Adv Opt Photon. (2016) 8:200–27. doi: 10.1364/AOP.8.000200
13. Lachinova SL, Vorontsov MA. Exotic laser beam engineering with coherent fiber-array systems. J Opt. (2013) 15:105501. doi: 10.1088/2040-8978/15/10/105501
14. Wang L, Wang L, Zhu S. Formation of optical vortices using coherent laser beam arrays. Opt Commun. (2009) 282:1088–94 doi: 10.1016/j.optcom.2008.12.004
15. Dudorov VV, Aksenov VP, Kolosov VV. Characterization of vortex beams synthesized on the basis of a fiber laser array. Proc SPIE. (2015) 9680:96802D1–7. doi: 10.1117/12.2206152
16. Aksenov VP, Dudorov VV, Kolosov VV. Vortex beam generation based on fiber array combining and propagation through a turbulent atmosphere. Proc SPIE. (2016) 9979:997908. doi: 10.1117/12.2237604
17. Aksenov VP, Dudorov VV, Kolosov VV. Properties of vortex beams formed by an array of fibre lasers and their propagation in a turbulent atmosphere. Quantum Electron. (2016) 46:726–32. doi: 10.1070/QEL16088
18. Aksenov VP, Dudorov VV, Kolosov VV, Filimonov GA. Generation of laser vortex beams with zero orbital angular momentum and nonzero topological charge. Optika Atmosfery i Okeana. (2017) 30:905–9 (in Russian).
19. Aksenov VP, Dudorov VV, Filimonov GA, Kolosov VV, Venediktov V. Vortex beams with zero orbital angular momentum and non-zero topological charge. Opt Laser Technol. (2018) 104:159–63. doi: 10.1016/j.optlastec.2018.02.022
20. Dudorov VV, Aksenov VP, Kolosov VV, Levitsky ME, Petukhov TD, Rostov AP. Generation of vortex and partially coherent laser beams on fiber array coherent combining. Proc SPIE. (2018) 12:10787. doi: 10.1117/12.2502158
21. Aksenov VP, Atuchin VV, Dudorov VV, Kolosov VV, Levitsky ME, Petukhov TD. Vortex beam formation by means of control of the piston shift of a fiber array. Proc SPIE. (2019) 11322:1132214. doi: 10.1117/12.2550555
22. Aksenov VP, Dudorov VV, Kolosov VV. Statistical characteristics of common and synthesized vortex beams in a turbulent atmosphere. Proc SPIE. (2016) 10035:100352. doi: 10.1117/12.2249488
23. Fleck JA, Morris JR, Feit MD. Time-dependent propagation of high energy laser beams through the atmosphere. Applied Physics A. (1976) 10:129–60. doi: 10.1007/BF00896333
24. Konyaev PA, Tartakovskii EA, Filimonov GA. Computer simulation of optical wave propagation with the use of parallel programming. Atmos Ocean Opt. (2011) 24:425. doi: 10.1134/S1024856011050095
25. Aksenov VP, Kolosov VV, Filimonov GA, Pogutsa CE. Orbital angular momentum of a laser beam in a turbulent medium: Preservation of the average value and variance of fluctuations. J Opt. (2016) 18:054013. doi: 10.1088/2040-8978/18/5/054013
26. Vorontsov MA Carhart GW, Cohen M, Cauwenberghs G. Adaptive optics based on analog parallel stochastic optimization∧ analysis and experimental demonstration. JOSA A. (2000) 17:1440–53. doi: 10.1364/JOSAA.17.001440
27. Rostov AP. Kontroller formirovatelya fazovogo fronta mnogokanal'nogo lazernogo puchka. In: Optika Atmosfery I Okeana. Fizika atmosfery. Materialy XXIII Mezhdunarodnogo simpoziuma. Tomsk: Izdatel'stvo IOA SO RAN. (2017) p. B39-B42 (in Russian).
28. Augst SJ, Fan TY, Sanchez A. Coherent beam combining and phase noise measurement of ytterbium fiber amplifiers. Opt Lett. (2004) 29:474–6. doi: 10.1364/OL.29.000474
29. Starikov FA, Kochemasov GG, Kulikov SM, Manachinsky AN, Maslov NV, Ogorodnikov AV, et al. Wavefront reconstruction of an optical vortex by a Hartmann-Shack sensor. Opt Lett. (2007) 32:2291–3. doi: 10.1364/OL.32.002291
30. Andrews LC Phillips RL. Laser Beam Propagation through Random Media. Bellingham: SPIE Optical Engineering Press. (2005). doi: 10.1117/3.626196
31. Aksenov VP, Dudorov VV, Kolosov VV, and Pogutsa CE, Abramova ES. Recording of orbital angular momentum of laser beam through its expansion in optical vortices and its use in communication systems in the turbulent atmosphere. Optika Atmosfery i Okeana (in Russian). (2020) 33:347–57. doi: 10.15372/AOO20200504
32. Korn G, Korn T. Mathematics Handbook for Scientific Workers and Engineers (in Russian). Moscow: Fizmatlit. (1984).
33. Aksenov VP, Dudorov VV, Kolosov VV, Venedictov V. Probability distribution of intensity fluctuations of arbitrary-type laser beams in the turbulent atmosphere. Opt Express. (2019) 27:24705–16. doi: 10.1364/OE.27.024705
34. Aksenov VP, Kolosov VV. Probability density of field and intensity fluctuations of structured light in a turbulent atmosphere. J Opt. (2019) 21:035605. doi: 10.1088/2040-8986/aafffd
35. Aksenov VP, Kolosov VV. Scintillations of optical vortex in randomly inhomogeneous medium. Photon Res. (2015) 3:44–7. doi: 10.1364/PRJ.3.000044
36. Aksenov VP, Kolosov VV, Pogutsa CE. The influence of the vortex phase on the random wandering of a Laguerre-Gaussian beam propagating in a turbulent atmosphere: a numerical experiment. J Opt. (2013) 15:044007. doi: 10.1088/2040-8978/15/4/044007
37. Aksenov VP, Kolosov VV, Pogutsa CE. Random wandering of laser beams with orbital angular momentum during propagation through atmospheric turbulence. Appl. Opt. (2014) 53:3607–14. doi: 10.1364/AO.53.003607
38. Aksenov VP, Dudorov VV, Kolosov VV. Singular atmospheric optics: from wave front dislocations to synthesis of vortex laser beams. Atmospheric and Oceanic Optics. (2020) 33:109–15. doi: 10.1134/S1024856020010029
39. Yu T, Xia H, Fan Z, Xie W, Zhang P, Liu J, et al. Generation of bessel-Gaussian vortex beam by combining technology. Wuli Xuebao. (2018) 67:134203. doi: 10.7498/aps.67.20180325
40. Hou T, Zhang Yu, Chang Q, Ma P, Su R, Wu J, et al. High-power vortex beam generation enabled by a phased beam array fed at the nonfocal-plane. Opt Express. (2019) 27:4046–59. doi: 10.1364/OE.27.004046
Keywords: singular optics, optical vortex, orbital angular momentum, coherent combining, fiber array, turbulent atmosphere, statistical characteristics
Citation: Aksenov VP, Dudorov VV, Kolosov VV and Levitsky ME (2020) Synthesized Vortex Beams in the Turbulent Atmosphere. Front. Phys. 8:143. doi: 10.3389/fphy.2020.00143
Received: 19 February 2020; Accepted: 14 April 2020;
Published: 15 May 2020.
Edited by:
Igor Mokhun, Chernivtsi University, UkraineReviewed by:
Han Zhang, Shenzhen University, ChinaJianming Wen, Kennesaw State University, United States
Copyright © 2020 Aksenov, Dudorov, Kolosov and Levitsky. This is an open-access article distributed under the terms of the Creative Commons Attribution License (CC BY). The use, distribution or reproduction in other forums is permitted, provided the original author(s) and the copyright owner(s) are credited and that the original publication in this journal is cited, in accordance with accepted academic practice. No use, distribution or reproduction is permitted which does not comply with these terms.
*Correspondence: Valerii P. Aksenov, YXZwQGlhby5ydQ==
 Valerii P. Aksenov
 Vadim V. Dudorov1