- 1Anhui Province Key Laboratory of Optoelectric Materials Science and Technology, Department of Physics, Anhui Normal University, Wuhu, China
- 2Wuhan National Laboratory for Optoelectronics (WNLO), Huazhong University of Science and Technology, Wuhan, China
To further improve the detection sensitivity of surface-enhanced laser-induced breakdown spectroscopy (SENLIBS), the number of repeating sample preparations in a fixed area was increased. The trace elements in an aqueous solution were quantitatively analyzed successfully. The results showed that the spectral intensities were strengthened. The limit of detection (LoD) values of Cu, Pb, Cr, and Cd were reduced from 0.072~0.36 to 0.027~0.057 μg/mL by increasing the number of repeating sample preparations from 1 to 8. This demonstrated that quantitative analytical sensitivity of SENLIBS could be improved by repeating sample preparations without increasing the cost of equipment.
Introduction
Spectral analysis technology has been applied to the analysis of gas, solids, and liquids [1–4]. Laser-induced breakdown spectroscopy (LIBS) as a booming analysis technology has been proven as a promising method for waste-water monitoring [5]. Although LIBS has unique advantages such as micro-volume sample analysis, in situ, online, and stand-off analysis capabilities [6–10], it still faces a technical bottleneck of poor sensitivity in determining trace elements in aqueous solutions [11–13]. To improve the detection sensitivity, some methods have been proposed, such as changing the liquid samples from a static liquid to dynamic liquid using sampling equipment (e.g., meinhard nebulizer, pump, and nozzle) [14–16], assisting LIBS with additional equipment (e.g., magnetic field, electric field, and laser) [17–19], and converting the liquid samples from liquid phase to solid phase using liquid nitrogen, adsorbent materials, electrodeposition, and non-absorbent materials [20–23] etc.
Recently, surface-enhanced LIBS (SENLIBS), as a new liquid-to-solid phase transition method, has been considered as a versatile analytical technique for liquid samples [24–35], power samples [36], and solid samples [37]. The powder sample was mixed with viscous liquid as the liquid sample. The solid sample was changed to the liquid sample by chemical treatment. Next, the liquid sample was dried as a solid layer or deposited as the gel-like layer on a non-absorbent substrate surface, and then analyzed by LIBS. Up to now, many methods have been proposed to further improve detection sensitivity or the spectrum intensity of SENLIBS, which included the liquid microextraction (e.g., single drop microextraction and dispersive liquid–liquid microextraction) [29, 38, 39], chemical replacement [27], and double-pulse LIBS (DP-LIBS) [35]. However, liquid microextraction will introduce additional chemical agents, as chemical replacement is only suitable for analysis of inert metal ions, and DP-LIBS will increase the cost of equipment.
To further improve the detection sensitivity of SENLIBS, a sample preparation method was introduced in this work, which will increase the element concentration per unit area by increasing the number of sample preparations in a fixed point. Therefore, experimental conditions, spectral enhancement, and quantitative analysis of the trace elements in aqueous solution were investigated and discussed in detail.
Experimental
LIBS Instrument
The experimental setup for LIBS is schematically illustrated in Figure 1A, which was described in our previous work [40]. Briefly, the Q-switched Nd:YAG laser was used as an ablation source to ablate the samples. The laser beam was reflected and focused on the sample by a reflector mirror and a plano-convex lens (f = 100 mm). The defocusing amount for ablation of the sample is 4 mm. The speed of the 2D motorized translation stage loaded with samples is 5 mm/s. The plasma emission was coupled into an echelle spectrometer (Andor Tech., Mechelle 5000) through the light collector (f = 200 mm) and optical fiber (50 μm × 200 cm). An intensified charge-coupled device camera (ICCD) (Andor Tech., iStar 334T) was attached to the spectrometer, which can convert the optical signal into an electrical signal for analysis.
Sample Preparation
The stock solution was prepared with the analytical reagents [CrCl3, CdCl2, CuCl2, and Pb(NO3)2]. The concentration of each element (Cu, Pb, Cd, and Cr) in the stock solution was 500 μg/mL. The stock solution was diluted with deionized water to prepare 11 standard aqueous solutions. The concentration range of each element in the standard solutions ranged from 0.1 to 10 μg/mL.
A zinc target, without analytical elements, was used as a metallic substrate. To increase the sample preparation repeatability, a 6 mm diameter filter paper was placed on the surface of the Zn-metal substrate as reported in our previous work [40]. The sample pretreatment procedures of each aqueous solution are shown in Figure 1B, which included: (1) the Zn-metal substrate with filter papers was placed on a heating plate; (2) a microdroplet of standard solution was deposited on the filter paper by a micropipette; (3) After drying, step 2 was repeated as needed; (4) finally, the filter paper was taken off. The standard aqueous solution was prepared as a 6 mm diameter solid prepared layer on the surface of the Zn-metal substrate.
To further improve the LIBS spectral stability, the spectral was obtained by concentric analysis of each droplet deposition area as shown in our previous work [40]. Each spectrum was accumulated for 90 shots. Figure 2 shows the optimization of sample preparation conditions. As shown in Figure 2A, the maximum spectral intensities of trace elements increased with the sample volume. As shown in Figure 2B, the higher the temperature is, the less time is needed for drying. In this work, 40 μL was selected as the sample volume for each microdroplet, 70°C was chosen as the drying temperature, and the drying time for each sample preparation was about 4 min.
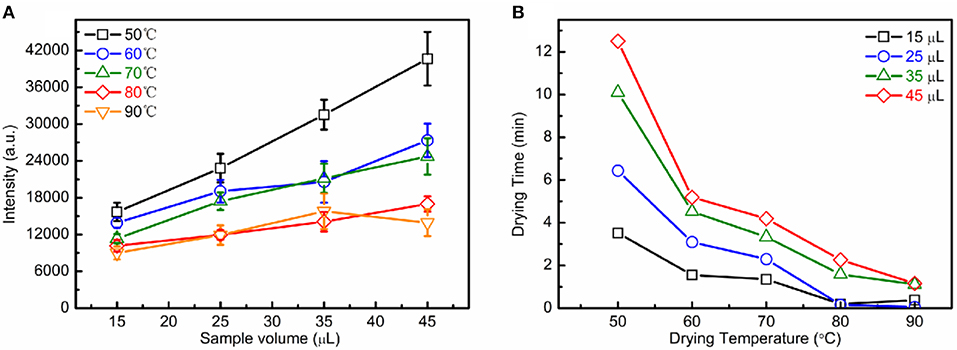
Figure 2. Optimization of sample preparation conditions: the effect of sample volume on the spectral intensity (A); the drying temperature on the drying time (B).
Results and Discussion
Optimization of the Analytical Parameters
For high detection sensitivity, a higher signal-to-noise ratio (SNR) is needed. The laser energy and gate delay time were optimized for the highest SNR. Figure 3 shows the evolution trends of SNRs of analytical lines (Cu I 324.75 nm, Pb I 405.78 nm, Cd I 508.58 nm, and Cr I 520.84 nm) on laser pulse energies (gate delay: 3 μs; and gate width: 0.5 μs) and gate delay times (laser energy: 40 mJ; and gate width: 0.5 μs). The SNR values were calculated based on the ratio of the maximum analytical line intensities and the noise calculated by the background near the analytical lines. The 369.43–369.61 nm for Cu, 398.66–398.55 nm for Pb, and 537.23-537.33 nm for both Cd and Cr were chosen as the background. As shown in Figure 3, the SNRs of all analytic lines increased first and then decreased with increasing laser energy and gate delay time, respectively. Therefore, 40 mJ of laser energy, the 2 μs of both gate delay and gate width were selected as the optimum experimental parameter.
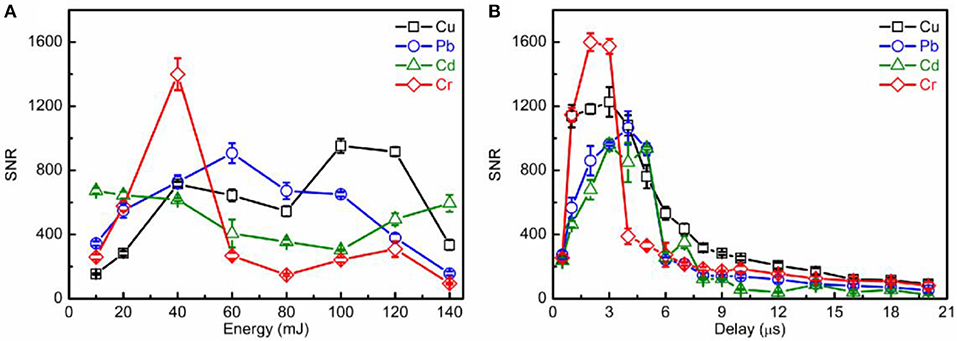
Figure 3. Evolution trends of SNRs for analytical lines (Cu I 324.75 nm, Pb I 405.78 nm, Cd I 508.58 nm, and Cr I 520.84 nm) on laser energy (A) and gate delay time (B).
Spectral Enhancement
As is widely known, as the element concentration per unit area on the metal surface enlarged, the spectral intensity will be enhanced. With an increase in the number of repeating sample preparations within a fixed range, the element concentration per unit area will be enlarged. As the results, the spectral intensity will be strengthened. Figure 4A shows the relationship between spectral intensities and the number of repeating sample preparations. As shown, the spectral intensities for each element were increased with the number of repeating sample preparations. However, the spectral intensities of the substrate element lines (Zn II 250.19 nm, Zn II 255.79 nm, and Zn I 472.21 nm) decreased with the number of repeating sample preparations, as shown in Figure 4B. For SENLIBS, the prepared layer and the metallic substrate were ablated simultaneously. The ablation amount of the substrate decreased with the increase of prepared layer thickness, with the increase of the number of repeating sample preparations under the same experimental conditions.
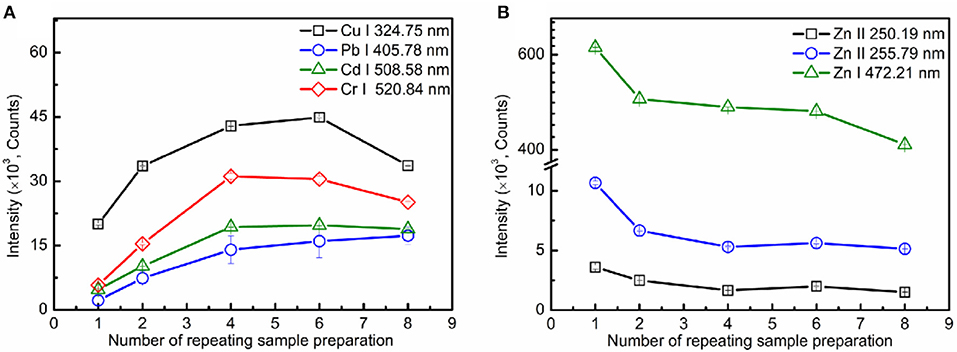
Figure 4. Evolution trends of spectral intensity for analytical lines (A) and substrate element lines (B) on the number of repeating sample preparations.
Calibration Curves and Limits of Detection
As is well-known, the detection sensitivity will be improved with the spectral intensity enhancement. For SENLIBS, the ablation amount of the substrate will be reduced with the increase in thickness of the prepared layer under the same experimental conditions. To reduce the effect of different thicknesses of the prepared layer, the substrate element Zn was selected as the reference element for quantitative analysis as shown in our previous work [40]. Figure 5 shows the calibration curves of analytical lines (Cu I 324.75 nm, Pb I 405.78 nm, Cd I 508.58 nm, and Cr I 520.84 nm) analyzed by SENLIBS with different number of repeating sample preparations. As shown the slope of the calibration curve (S) with linear fit, increased with the number of repeating sample preparations. The self-absorption effect increased with the number of repeating sample preparations, which was evident from the bend of calibration curves with the quadratic fit. As shown in Figure 6, the LoDs for SENLIBS were decreased with the number of repeating sample preparations. And the LoDs were improved from 0.072~0.36 to 0.027~0.057 μg/mL. The results demonstrate that the sensitivity of SENLIBS could be improved by increasing the element concentration per unit area through increasing the number of sample preparations, and the saturation of sensitivity would be reached owing to the self-absorption effect.
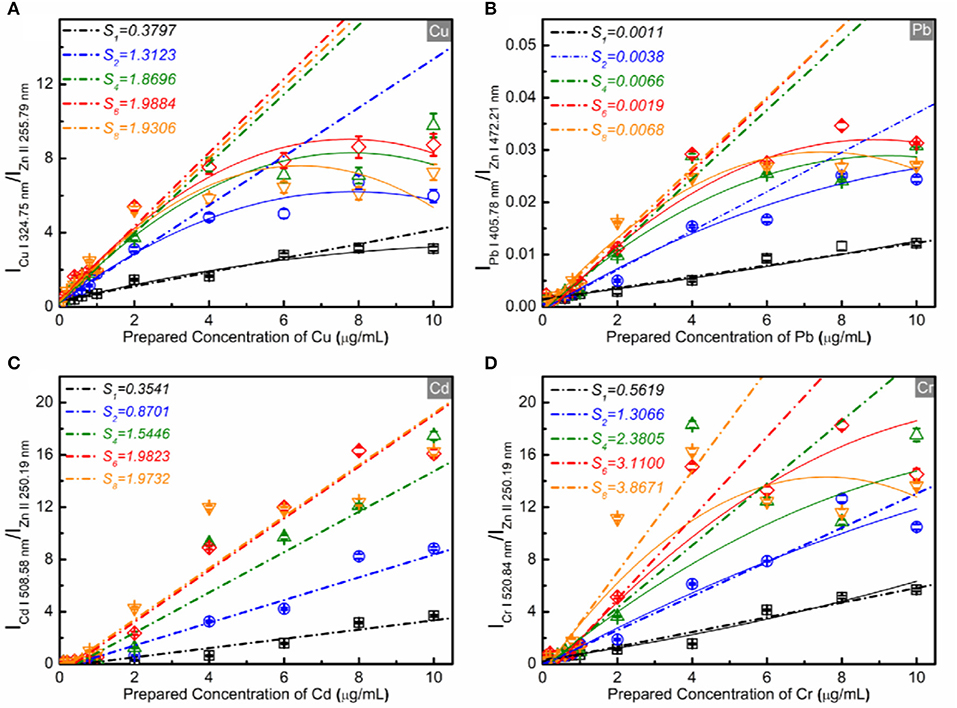
Figure 5. Calibration curves with linear fit (short dash dots line) and a quadratic fit (solid line) of trace elements [Cu (A), Pb (B), Cd (C), and Cr (D)] in the standard samples analyzed by SENLIBS with different number of repeating sample preparations.
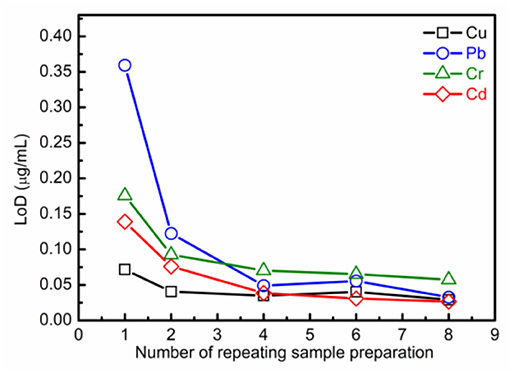
Figure 6. Evolution trends of LoDs for analytical lines (Cu I 324.75 nm, Pb I 405.78 nm, Cd I 508.58 nm, and Cr I 520.84 nm) on the number of repeating sample preparations.
As reported, sensitivity of LIBS for analysis of aqueous solution could be improved by use of supplementary instrumentation [16–18], e.g., DP-LIBS, LIBS-LIF, LIBS combined with magnetic field etc. Therefore, those reported methods could be introduced to reduce the sample preparation time and to improve the sensitivity of SENLIBS. Although the sample preparation time with repeating sample preparations is about 16 min, both the cost and complexity of equipment was reduced compared to those of reported methods. As is generally known, the sample preparation time of SENLIBS depends on the liquid volume and spreading area. Therefore, the number of repeating sample preparations, with the same element concentration per unit area, could be reduced by reducing the spreading area with the same liquid volume. As the results, the sample preparation time will be decreased. These results showed that the introduced method is a feasible method in improving the sensitivity of SENLIBS.
Conclusions
A new sample preparation method for improving the sensitivity of SENLIBS was proposed, by repeating sample preparations in a fixed point. Using this method, both the spectral intensity and detection sensitivity of trace elements (Cu, Pb, Cd, and Cd) in aqueous solution, using SENLIBS, were improved by increasing the number of sample preparations in a fixed point. The unique advantages of this method include the low cost of equipment and its higher sensitivity. Accordingly, this proposed method is an economical method for the analysis of trace elements in a liquid sample.
Data Availability Statement
The datasets generated for this study are available on request to the corresponding author.
Author Contributions
XY, XL, and ZC planned and supervised the experiments, processed the raw data, and wrote and revised the manuscript. GY, ZZ, and KL advised on data processing. All authors contributed to the article and approved the submitted version.
Funding
This work was supported National Natural Science Foundation of China (No. 61805002), Anhui Provincial Key Research and Development Program (No. 1804a0802193), Anhui University Natural Science Research Project (No. KJ2018A0308), and Innovation Funds of Anhui Normal University (No. 2018XJJ104).
Conflict of Interest
The authors declare that the research was conducted in the absence of any commercial or financial relationships that could be construed as a potential conflict of interest.
References
1. Lorenzen CJ, Carlhoff C, Hahn U, Jogwich M. Applications of laser-induced emission spectral analysis for industrial process and quality control. J Analy Atomic Spectr. (1992) 7:1029–35. doi: 10.1039/ja9920701029
2. Ma Y, He Y, Patimisco P, Sampaolo A, Qiao S, Yu X, et al. Ultra-high sensitive trace gas detection based on light-induced thermoelastic spectroscopy and a custom quartz tuning fork. Appl Phys Lett. (2020) 116:011103. doi: 10.1063/1.5129014
3. Ma Y, Qiao S, Patimisco P, Sampaolo A, Wang Y, Tittel FK, et al. In-plane quartz-enhanced photoacoustic spectroscopy. Appl Phys Lett. (2020) 116:061101. doi: 10.1063/1.5142330
4. Britske MÉ, Sukach YS, Filimonov LN. High-frequency induction discharge in emission spectral analysis. Zhurnal Prikladnoi Spektroskopii. (1976) 25:5–11. doi: 10.1007/BF00605147
5. Rai V, Yueh F, Singh J. Chapter 10: Laser-induced breakdown spectroscopy of liquid samples. In: Singh JP, Thakur SN, editors. Laser Induced Breakdown Spectroscopy. 1st ed. Amsterdam: Elsevier Publications (2007). p. 223–54. doi: 10.1016/B978-044451734-0.50013-2
6. Cheng X, Yang X, Zhu Z, Guo L, Li X, Lu Y, et al. On-stream analysis of iron ore slurry using laser-induced breakdown spectroscopy. Appl Opt. (2017) 56:9144–9. doi: 10.1364/AO.56.009144
7. Chu YW, Tang SS, Ma SX, Ma YY, Hao ZQ, Guo YM, et al. Accuracy and stability improvement for meat species identification using multiplicative scatter correction and laser-induced breakdown spectroscopy. Opt Express. (2018) 26:10119–27. doi: 10.1364/OE.26.010119
8. Li C, Hao Z, Zou Z, Zhou R, Li J, Guo L, et al. Determinations of trace boron in superalloys and steels using laser-induced breakdown spectroscopy assisted with laser-induced fluorescence. Opt Express. (2016) 24:7850–7. doi: 10.1364/OE.24.007850
9. Li W, Yang X, Li X, Tang S, Li J, Yi R, et al. A portable multi-collector system based on an artificial optical compound eye for stand-off laser-induced breakdown spectroscopy. J Anal Atom Spectrom. (2017) 32:1975–9. doi: 10.1039/C7JA00173H
10. Fu X, Li G, Dong D. Improving the detection sensitivity for laser-induced breakdown spectroscopy: a review. Front Phys. (2020) 8:68. doi: 10.3389/fphy.2020.00068
11. Yang X, Guo L, Li J, Yi R, Hao Z, Shen M, et al. Laser-induced breakdown spectroscopy of liquid solutions: a comparative study on the forms of liquid surface and liquid aerosol. Appl Opt. (2016) 55:7406–11. doi: 10.1364/AO.55.007406
12. Wachter JR, Cremers DA. Determination of uranium in solution using laser-induced breakdown spectroscopy. Appl Spectrosc. (1987) 41:1042–8. doi: 10.1366/0003702874447897
13. Sarkar A, Alamelu D, Aggarwal SK. Determination of thorium and uranium in solution by laser-induced breakdown spectrometry. Appl Opt. (2008) 47:G58–64. doi: 10.1364/AO.47.000G58
14. Kumar A, Yueh FY, Miller T, Singh JP. Detection of trace elements in liquids by laser-induced breakdown spectroscopy with a Meinhard nebulizer. Appl Optics. (2003) 42:6040–6. doi: 10.1364/AO.42.006040
15. Rai NK, Rai AK, Kumar A, Thakur SN. Detection sensitivity of laser-induced breakdown spectroscopy for Cr II in liquid samples. Appl Optics. (2008) 47:G105–11. doi: 10.1364/AO.47.00G105
16. Feng Y, Yang J, Fan J, Yao G, Ji X, Zhang X, et al. Investigation of laser-induced breakdown spectroscopy of a liquid jet. Appl Opt. (2010) 49:C70–4. doi: 10.1364/AO.49.000C70
17. Rai VN, Rai AK, Yueh F-Y, Singh JP. Optical emission from laser-induced breakdown plasma of solid and liquid samples in the presence of a magnetic field. Appl Opt. (2003) 42:2085–93. doi: 10.1364/AO.42.002085
18. Rifai K, Laville S, Vidal F, Sabsabi M, Chaker M. Quantitative analysis of metallic traces in water-based liquids by UV-IR double-pulse laser-induced breakdown spectroscopy. J Anal Atom Spectrom. (2012) 27:276–83. doi: 10.1039/C1JA10178A
19. Loudyi H, Rifaï K, Laville S, Vidal F, Chaker M, Sabsabi M. Improving laser-induced breakdown spectroscopy (LIBS) performance for iron and lead determination in aqueous solutions with laser-induced fluorescence (LIF). J Anal Atom Spectrom. (2009) 24:1421–8. doi: 10.1039/b909485g
20. Jantzi SC, Motto-Ros V, Trichard F, Markushin Y, Melikechi N, De Giacomo A. Sample treatment and preparation for laser-induced breakdown spectroscopy. Spectrochim. Acta B. (2016) 115:52–63. doi: 10.1016/j.sab.2015.11.002
21. Sobral H, Sanginés R, Trujillo-Vázquez A. Detection of trace elements in ice and water by laser-induced breakdown spectroscopy. Spectrochim. Acta B. (2012) 78:62–6. doi: 10.1016/j.sab.2012.09.005
22. Matsumoto A, Tamura A, Koda R, Fukami K, Ogata YH, Nishi N, et al. On-site quantitative elemental analysis of metal ions in aqueous solutions by underwater laser-induced breakdown spectroscopy combined with electrodeposition under controlled potential. Anal Chem. (2015) 87:1655–61. doi: 10.1021/ac503737c
23. Lin Q, Bian F, Wei Z, Wang S, Duan Y. A hydrogel-based solidification method for the direct analysis of liquid samples by laser-induced breakdown spectroscopy. J Anal Atom Spectrom. (2017) 32:1412–9. doi: 10.1039/C7JA00143F
24. Aguirre M, Legnaioli S, Almodóvar F, Hidalgo M, Palleschi V, Canals A. Elemental analysis by surface-enhanced Laser-Induced Breakdown Spectroscopy combined with liquid–liquid microextraction. Spectrochim. Acta B. (2013) 79:88–93. doi: 10.1016/j.sab.2012.11.011
25. Bae D, Nam S-H, Han S-H, Yoo J, Lee Y. Spreading a water droplet on the laser-patterned silicon wafer substrate for surface-enhanced laser-induced breakdown spectroscopy. Spectrochim. Acta B. (2015) 113:70–8. doi: 10.1016/j.sab.2015.09.005
26. Jijón D, Costa C. Pencil lead scratches on steel surfaces as a substrate for LIBS analysis of dissolved salts in liquids. In: Journal of Physics: Conference Series. Lima: IOP Publishing, (2011). p. 012077. doi: 10.1088/1742-6596/274/1/012077
27. Yang X, Hao Z, Li C, Li J, Yi R, Shen M, et al. Sensitive determinations of Cu, Pb, Cd, and Cr elements in aqueous solutions using chemical replacement combined with surface-enhanced laser-induced breakdown spectroscopy. Opt Express. (2016) 24:13410–7. doi: 10.1364/OE.24.013410
28. Yang X, Hao Z, Yi R, Li J, Yu H, Guo L, et al. Simultaneous determination of La, Ce, Pr, and Nd elements in aqueous solution using surface-enhanced laser-induced breakdown spectroscopy. Talanta. (2017) 163:127–31. doi: 10.1016/j.talanta.2016.10.094
29. M. de Jesus, Aguirre MÁ, Hidalgo M, Canals A, Pereira-Filho ER. The determination of V and Mo by dispersive liquid–liquid microextraction (DLLME) combined with laser-induced breakdown spectroscopy (LIBS). J Anal Atom Spectrom. (2014) 29:1813–8. doi: 10.1039/C4JA00151F
30. Xiu J, Bai X, Negre E, Motto-Ros V, Yu J. Indirect laser-induced breakdown of transparent thin gel layer for sensitive trace element detection. Appl Phys Lett. (2013) 102:244101. doi: 10.1063/1.4811245
31. Xiu J, Motto-Ros V, Panczer G, Zheng R, Yu J. Feasibility of wear metal analysis in oils with ppm and sub-ppm sensitivity using laser-induced breakdown spectroscopy of thin oil layer on metallic target. Spectrochim. Acta B. (2014) 91:24–30. doi: 10.1016/j.sab.2013.11.003
32. Zheng L, Cao F, Xiu J, Bai X, Motto-Ros V, Gilon N, et al. On the performance of laser-induced breakdown spectroscopy for direct determination of trace metals in lubricating oils. Spectrochim. Acta B. (2014) 99:1–8. doi: 10.1016/j.sab.2014.06.005
33. Metzinger A, Kovács-Széles É, Almási I, Galbács G. An assessment of the potential of laser-induced breakdown spectroscopy (LIBS) for the analysis of cesium in liquid samples of biological origin. Appl Spectrosc. (2014) 68:789–93. doi: 10.1366/13-07297
34. Barnett C, Bell C, Vig K, Akpovo A, Johnson L, Pillai S, et al. Development of a LIBS assay for the detection of Salmonella enterica serovar Typhimurium from food. Anal Bioanal Chem. (2011) 400:3323–30. doi: 10.1007/s00216-011-4844-3
35. Bocková J, Tian Y, Yin H, Delepine-Gilon N, Chen Y, Veis P, et al. Determination of metal elements in wine using laser-induced breakdown spectroscopy (LIBS). Appl Spectrosc. (2017) 71:1750–9. doi: 10.1177/0003702817708337
36. Tian Y, Cheung HC, Zheng R, Ma Q, Chen Y, Delepine-Gilon N, et al. Elemental analysis of powders with surface-assisted thin film laser-induced breakdown spectroscopy. Spectrochim. Acta B. (2016) 124:16–24. doi: 10.1016/j.sab.2016.08.016
37. Campanella B, Degano I, Grifoni E, Legnaioli S, Lorenzetti G, Pagnotta S, et al. Identification of inorganic dyeing mordant in textiles by surface-enhanced laser-induced breakdown spectroscopy. Microchem J. (2018) 139:230–5. doi: 10.1016/j.microc.2018.02.034
38. Aguirre M, Selva E, Hidalgo M, Canals A. Dispersive liquid–liquid microextraction for metals enrichment: a useful strategy for improving sensitivity of laser-induced breakdown spectroscopy in liquid samples analysis. Talanta. (2015) 131:348–53. doi: 10.1016/j.talanta.2014.07.090
39. Aguirre M, Nikolova H, Hidalgo M, Canals A. Hyphenation of single-drop microextraction with laser-induced breakdown spectrometry for trace analysis in liquid samples: a viability study. Anal Methods. (2015) 7:877–83. doi: 10.1039/C4AY02218A
Keywords: laser-induced breakdown spectroscopy, surface-enhanced, sensitivity, aqueous solution, sample preparation
Citation: Yang X, Li X, Cui Z, Yao G, Zhou Z and Li K (2020) Improving the Sensitivity of Surface-Enhanced Laser-Induced Breakdown Spectroscopy by Repeating Sample Preparation. Front. Phys. 8:194. doi: 10.3389/fphy.2020.00194
Received: 21 February 2020; Accepted: 30 April 2020;
Published: 17 June 2020.
Edited by:
Yufei Ma, Harbin Institute of Technology, ChinaReviewed by:
Ronger Zheng, Ocean University of China, ChinaVincenzo Palleschi, Italian National Research Council, Italy
Copyright © 2020 Yang, Li, Cui, Yao, Zhou and Li. This is an open-access article distributed under the terms of the Creative Commons Attribution License (CC BY). The use, distribution or reproduction in other forums is permitted, provided the original author(s) and the copyright owner(s) are credited and that the original publication in this journal is cited, in accordance with accepted academic practice. No use, distribution or reproduction is permitted which does not comply with these terms.
*Correspondence: Xinyan Yang, eGlueWFueWFuZ0BhaG51LmVkdS5jbg==; Zhifeng Cui, emZjdWlAYWhudS5lZHUuY24=
 Xinyan Yang
 Xiangyou Li2