 Patrick Doreian
 Andrej Mrvar
- 1Faculty of Social Sciences, University of Ljubljana, Ljubljana, Slovenia
- 2Department of Sociology, University of Pittsburgh, Pittsburgh, PA, United States
We tackle two problems. One is understanding parts of the operation of the US Supreme Court. The other is a fundamental problem for network analysis. It is delineating the fundamental structures of networks. Even more important, within this second problem, is delineating changes of this network structure over time. We present a method for doing both for signed networks. The two problems are coupled closely as the data come from the completed years of the Roberts US Supreme Court, named after its Chief Justice, for the 2005 through 2018 terms. For the issues selected by the court for consideration in each term, the justices vote on the decision that will be issued by the court. These votes are either to support a decision or to dissent from it. These votes can be recorded into a signed 2-mode network for each term. While we examine these networks, our primary focus is on the 1-mode projection from the 2-mode network having the justices as units. Using signed relaxed structural balance blockmodeling, we establish the fundamental structure of the relations between justices for each of the terms. For 13 of the 14 terms considered, the criterion function for the blockmodels is zero. This structure changes in clear ways and shows that the conventional divide between conservative and liberal justices is overly simplistic. Of greater interest is identifying the structural roles of the court's justices.
1. Introduction
We present a method for delineating change in the fundamental structure of a signed network. On the technical side, this contribution is located in the intersection of three research areas: network partitioning; signed networks; and networks distributed in time. Section 2 provides a brief description of network partitioning. Section 3 provides a more extended discussion of signed networks. Treatments of networks distributed in time are examined briefly in section 4. Details about studying the US Supreme Court are presented in section 5 given its relevance for the methods we used. Section 6 describes some studies of the Supreme Court that inform our analyses. Section 7 describes our data for the Roberts Court and the measures we use. Section 8 presents our analyses and results. A brief summary and a statement concerning further work is provided in section 9.
2. Partitioning Networks
The notion of partitioning networks based on the distribution of their ties is quite old. For our purposes, we start with Lorrain and White [1] where the foundations were laid for blockmodeling. Based on the idea of structural equivalence, programs were developed for partitioning networks (see [2, 3]). Both are indirect algorithms as noted by Doreian et al. [4] in the sense that network data were converted into matrices (with correlations or Euclidean distances) which were then clustered. These programs were used in an inductive fashion. A direct approach was developed by Doreian et al. [5] in which the network data were partitioned directly by minimizing a criterion function which measured the number of inconsistencies between an empirical partition and the partition implied by the type of equivalence used. The number of potential equivalence types is quite large [4]. Embedded within the direct approach is the opportunity to use pre-specification of blockmodels as researchers often know more about the networks they study than is implied by them adopting simply an inductive approach and interpreting the resulting output.
There are many other ways of partitioning networks including community detection [6] (see also [7]). An edited collection, Doreian et al. [8] presents a variety of such approaches including both blockmodeling and community detection. One fundamental goal of network partitioning is to identify the fundamental structure of networks as noted by de Nooy et al. [9].
Our focus here is on partitioning signed networks within the signed blockmodeling approach.
3. Signed Networks
The first systematic statement of consistency theories is credited to Heider [10] by Taylor [11]. His early statement provided the foundation for the formal results of Cartwright and Harary [12] and Davis [13]. This created the two structure theorems (see [14]). One, based on the Heider [10] foundation was created by Cartwright and Harary [12]. It states that if a signed network is structurally balanced it can be partitioned into two clusters (positions) such that all of the positive ties are within positions and all negative ties are between positions, the second, based on the work of Davis [13], extends this result to multiple positions. They, especially the work of Davis [13], became the foundation for a fruitful approach for partitioning signed networks developed by Doreian and Mrvar [14]. For signed networks, there are only two types of blocks, positive and negative. There is an implicit pre-specification that positive blocks (containing only positive or null ties) are on the main diagonal of the ideal blockmodel and negative blocks (containing only negative or null ties) are off the main diagonal.
Most empirical signed networks are not balanced despite the assumed hypothesis that signed networks tend toward balance (see e.g., [15–17]). This implies the need for a partitioning method leading to a partition with the lowest number of inconsistencies between an empirical partition and an ideal partition based on structural balance. Doreian and Mrvar [14] provided one using a criterion function: F = αN+(1−α)P where N is the number of negative ties in positive blocks and P is the number of positive ties in negative blocks. The value of α lies between 0 and 1. Using α = 0.5 weights N and P equally, the most reasonable weighting. The shape of the criterion function takes a U-form with a guaranteed minimum value ([4], Chapter 10). Nearly always, the value of this criterion function exceeds 0. Even worse as noted by Doreian [18], was a fixation for structural balance theorists that signed networks tend always toward balance. Seldom, if even, has this been the case. Far more interesting is the examination of the mechanisms leading to signed networks to move toward balance at some point in time and those leading to signed networks moving away from balance at other times.
The concept of relaxed structural balance was introduced in Doreian and Mrvar [19], based on substantive concerns, under which the positive and negative blocks could appear anywhere in a signed blockmodel while keeping the same criterion function as stated above. They proved that the criterion function declines monotonically with the number of positions. In general, the fit under relaxed structural balance is always better than for the fit under structural balance1. This is the primary algorithm used below. For studying the voting patterns of justices on the Supreme Court, this is particularly important as ordinary structural balance would have been useless as many of the detected signed blockmodels have positive blocks off the main diagonal.
4. Networks in Time
There are at least four ways of studying networks over time. One is through using simulation to generate networks with a set of generating rules. This requires the use of coherent generating rules based strictly on substance rather than algorithmic convenience. This was done in [20] for signed networks, as was the case in Hummon and Doreian [16]. Another is trying to understand the processes generating networks by studying them empirically (see the examples contained in [21, 22]) The authors of the second book articulated principled rules for the evolution of social networks. For studying empirical networks, there are two variants. One is to study networks in which the vertices are distributed in time as was done by Batagelj et al. [23]. A second approach is to study a sequence of cross sections of the same network while allowing for actors joining or leaving the network. The latter is followed here as justices leave the Supreme Court through deaths or retirements and are subsequently replaced.
5. Studies of the US Supreme Court
In general, the kinds of opinions written by justices can take multiple forms. One is a statement of the majority opinion which other justices can join without qualification. There are also concurring opinions in which the decision is supported but by using different arguments by those concurring. These opinions can also be joined by other justices. There can be partial concurrences, usually accompanied by another concurrence. There are dissenting opinions that reject the decision that was reached. These too can be joined2. Given this, the work of Walker et al. [24] is clearly relevant for what we do here. Their detailed and extensive set of analyses are compelling. Our brief statement about their results here does not do justice to the subtlety of their analyses. They show that from 1800 through the late 1930s, the number of dissenting and concurring opinions remained about the same. They argue that this indicates a high level of cohesion in the Supreme Court for a very extended period. We agree. In the early 1940s, this cohesion, and the conventions supporting it, changed dramatically. They write (1988: 363), that the “consensus norms did not gradually erode, but were abruptly shattered.” They used historical and quantitative approaches to examine five possible reasons for this sudden and dramatic change.
One possible reason for this loss of cohesion was the passage of the Judiciary Act in 1925 which allowed the justices, should they choose, to focus more on issues of major importance, both judicial and substantive. They concluded that the impact of this legislation had only a moderate impact on the sudden rise of concurring and dissenting opinions. They reached the same conclusion regarding the increased caseload of the Supreme Court—it was not responsible for the sharp increase of concurring and dissenting opinions. They examined also the argument that promoting an Associate Justice to be the Chief Justice could have led to the loss of cohesion. This was found wanting also in their analyses despite the stark behavioral difference between the courts led by Chief Justice Hughes (1930–1941) and Chief Justice Stone (1941-1946).
More consequential was the change of the court's membership. Walker et al. [24] examined the idea that the Stone Court had a large number of young and inexperienced Associate Justices. They showed that the Stone Court did, indeed, have the highest turnover rate of the five courts, named for their Chief Justices, they analyzed and it had the most inexperienced Associate Justices when they arrived on the Supreme Court. All were nominated by Franklin Roosevelt who wanted justices supporting his New Deal policies on the court. Even so, Walker et al. [24] found little evidence for the existence of deep ideological divides on this court leading to higher numbers of dissenting and concurring opinions.
Overwhelmingly, they find that the leadership—or not—provided by Chief Justices was the major determinant for the loss of cohesion erupting in the 1940s. After looking at the historical record, they are clear about Chief Justice Stone being a completely ineffective leader of this court. The documents they summarize make the absence of constructive leadership by Stone in no doubt. Clearly, the leadership provided—or not—by the Chief Justice on the Supreme Court matters. This, to limited extent, affects our analyses.
We pay close attention to the changes in the composition of the court, as suggested by the above arguments. There has been turnover during the first 14 completed terms of the Roberts Court. All courts have turnover, this is not unusual. Roberts was nominated and confirmed directly as the Chief Justice which eliminates one of variables considered by Walker et al. [24]. The other variables remain relevant. We attempt to include them all.
Information was presented by Wahlbeck et al. [25] about the dynamics of the Supreme Court in reaching the decisions they make. It includes the exchange of multiple drafts of opinions as justices attempt to reach the final decision that will be taken by this court. Their analysis is most intriguing. It is well-known that there is a clear need to form a majority which, in many cases, requires negotiation and compromise. There can be no doubt about justices on the Supreme Court wanting to establish their legacies given the books they write about their work and the opinions they author. The contents of these opinions matter regardless of whether they are written in support of decisions or are dissents from them. But in the end, justices have to vote. They cannot escape this rigid and absolutely necessary constraint. Our analyses are based solely on the voting patterns exhibited the Roberts Court when dissenting opinions were present.
In this context, a great deal of attention has been paid to the notion of “the median voter” on the Supreme Court, a concept initiated by the early important work of Black [26, 27]. Determining which justice, if any, occupies this position is a very difficult task. There have been many efforts to this, all of which have pluses and minuses. But the most compelling approach, as far we are concerned, is presented in Martin et al. [28]. We rely for some of our analyses on the measures they have established. While they are, most appropriately, very sympathetic to earlier approaches to this vexing problem, they propose a very clear solution. They have been admirably clear about their methods (https://mqscores.lsa.umich.edu/). So much so that there is little point in providing a summary of their work here. Their measures have been accepted widely. We direct readers to these sources.
There are even more ways of studying the operation of and decisions made by the US Supreme Court. One focuses on the network structure of citation ties from later decisions to early decisions within majority Supreme Court opinions (see [23, 29]) (Chapter 6). Another is to focus on the substantive issues before the court together with the relevant constitutional issues and congressional laws.
Yet another is to provide sweeping surveys of the history of the Supreme Court [30] or doing the same by selecting the major Supreme Court decisions [31]. As there has been considerable discussion of individual justices, their ideologies and preferences, this has been studied temporally. One prominent example is Epstein et al. [32]. The foundation for this line of work is found in Martin and Quinn [33] who employed Markoff Chain Monte Carlo methods within a Bayesian perspective to generate measures of policy preferences for justices on a one-dimension scale capturing measures ranging from extremely conservative to extremely liberal.
6. The Roberts Court
Another approach is to study each court named after its Chief Justice. This was done by Coyle [34] for the Roberts Court. She examined closely a small set of 5-4 decisions—the most divided the Supreme Court can be with nine justices present—to study these decisions closely, linking them to societal contexts.
In contrast, our approach is primarily relational in the network sense by treating Supreme Court signed networks and identifying one fundamental structure of the Supreme Court and how it changed over time.
7. Data
At the time this document was prepared (June 2020), there were 14 complete terms—2005 through 2018—for the Roberts Court. Each term starts in 1 year and finishes in the next year. For each decision, every justice who is present, and takes part, must “vote” either to support the court's decision or dissent from it. Given the work of Walker et al. [24], we track the number of dissenting opinions3. There are two other options for the writing of opinions. One is to concur with the decision but provide a partial or completely different rationale for the decision made. We will track the number of such opinions4. The fourth option is to a file concur/dissent decision which, depending on its details, can be treated as supporting a decision or dissenting from it. Deciding which is the case requires judgment and is doing this difficult5.
The justices who have been on this court are John G. Roberts, Clarence Thomas, Stephen G. Breyer, Ruth Bader Ginsburg (all who have served for all 14 terms and remain on the court), Antonin Scalia (11 terms), David G. Souter (four terms), John P. Stevens (five terms), Sandra Day O'Connor (who served only for a short part of the first term), Sonia Sotomayor (ten terms), Elena Kagan (nine terms), Neil Gorsuch (three terms), and Kevin Kavanaugh (one term). The last four listed justices also remain in this court. The voting patterns of the justices can be assembled into a two-mode signed array6. Examples for four selected terms are shown in Figure 1. The black squares represent supporting a decision, the red squares represent dissenting, and white squares are for when justices take no part in a decision7.
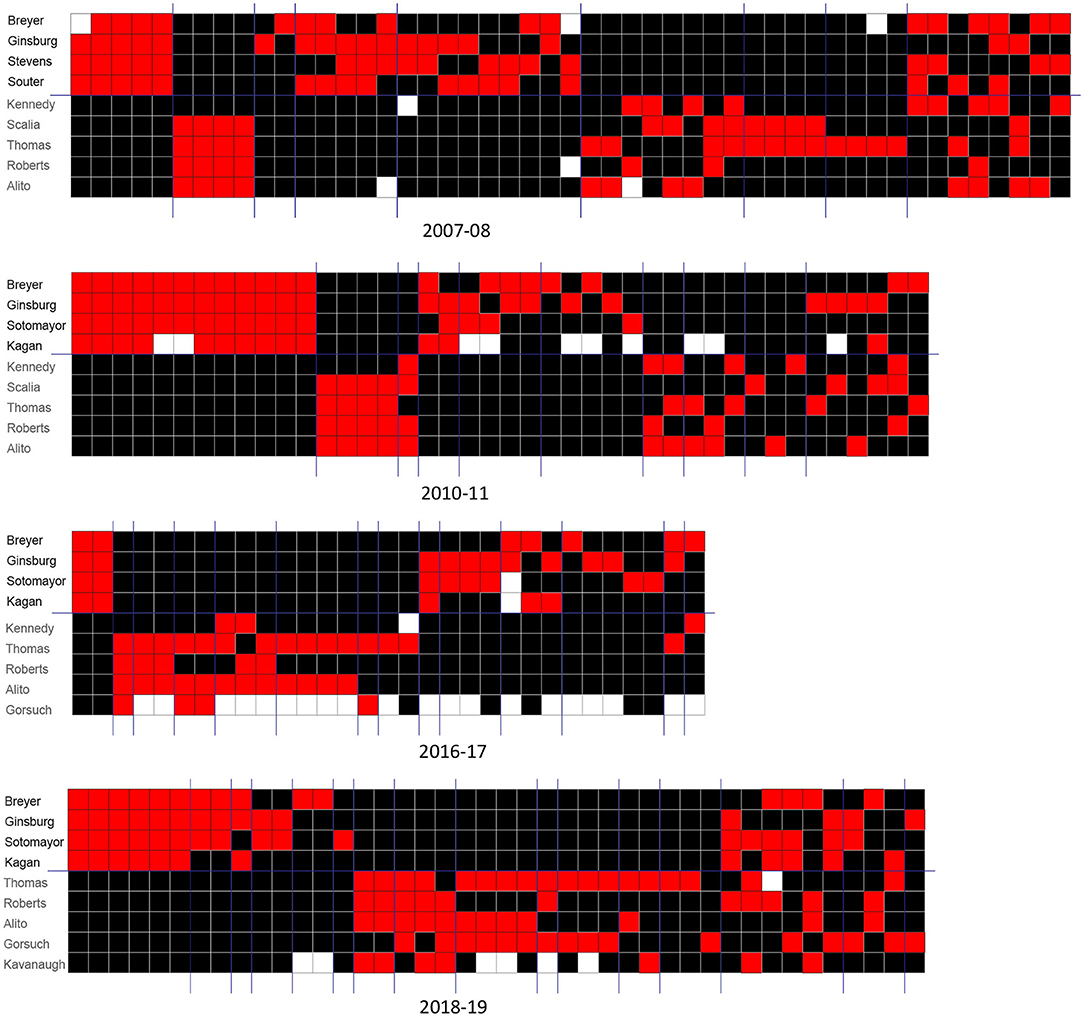
Figure 1. Ordered arrays of decisions for four selected terms of the Roberts Court. Notes: Black squares represent support for a decision, red squares represent dissents and white squares represent non-participation in a decision.
The number of decisions rendered varies from term to term. In every term, the decisions can be grouped into two categories. One consists of unanimous decisions, the number of which also varies from term to term. The other contains decisions for which there was at least one dissent. We focus solely on the latter category. The formatting for each term is designed to group the voting patterns into categories that are sufficiently similar in terms of how the justices voted. These arrays can be interpreted, especially in the light of the issues involved. While useful for understanding the Supreme Court, they reveal little regarding the fundamental structure of the court.
The conventional wisdom is that the Supreme Court has two wings. One is made up of conservatives and the other is composed of liberals8. See the ideological scores created by Martin and Quinn [35]9.
These trajectories are consistent with the conventional view of a Supreme Court with two Wings. Thomas is the most conservative justice on this court. Scalia and Alito come next. For the short time Stevens was on the court, he was the most liberal. Ginsburg and Sotomayor come next regarding being liberal. Toward the end of the series of terms, both of these justices were as liberal as Stevens had been. There is one exception in that Kennedy, a conservative, moved into the liberal range for two terms before moving back to the conservative range before retiring.
8. Analyses
The evidence in Figure 2, while informative, does not get at the fundamental structure of this court as it is more complex than a simple divide between two monolithic wings. Moreover, it changes from term to term. Figure 1 indicates that this is not a surprise because conservative justices and liberal justices can join each other in support of certain decisions. They can join also in dissenting from decisions. Most intriguing are decisions when both “wings” are split in this fashion.
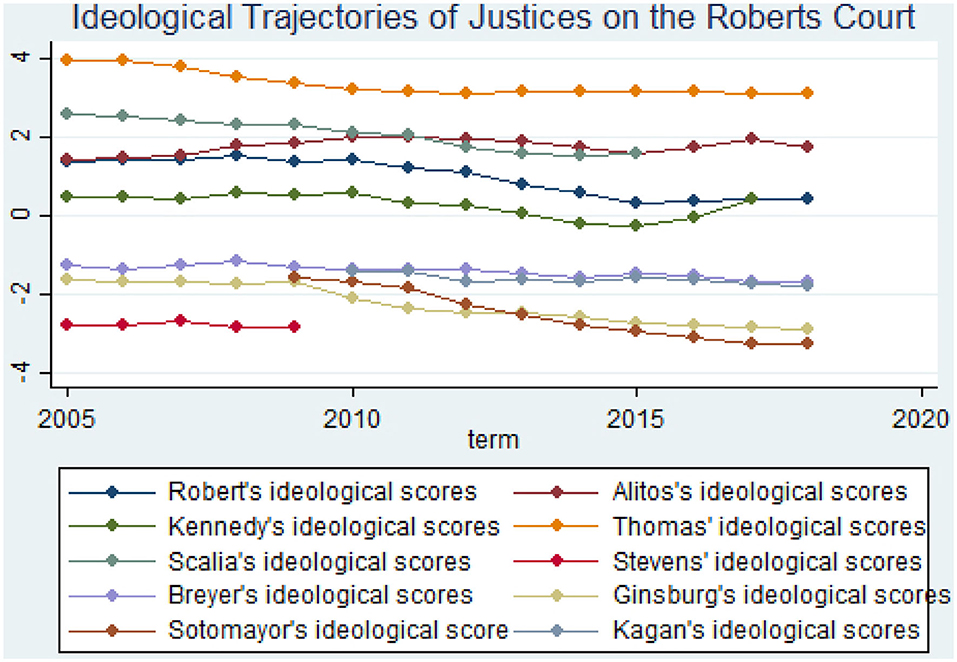
Figure 2. Selected ideological Trajectories of Justices on the Supreme Court. Only trajectories for justices who were on the court for at least five terms are included.
We define the fundamental structure of the Roberts Court as the signed blockmodel involving only the justices. The first step for delineating this structure of the court is to start with each of the 14 two-mode arrays and treat them in the following fashion. Let G denote a two-mode network with justices and decisions as the two modes. GT denotes transpose of G. The product, G GT, is a projection network with justices as the units (see [36, 37]) This is a signed valued network with the values being the overall number of agreements or disagreements between all pairs of justices.
The relaxed structural balance algorithm of Doreian and Mrvar [19] implemented in Pajek [38] was used to partition each of the projection networks. For 13 of the 14 terms, the value of the criterion function was 0, something we have not seen before10. Figure 3 shows the projections for all 14 terms of the Roberts Supreme Court. Table 1 shows the signed blockmodels.
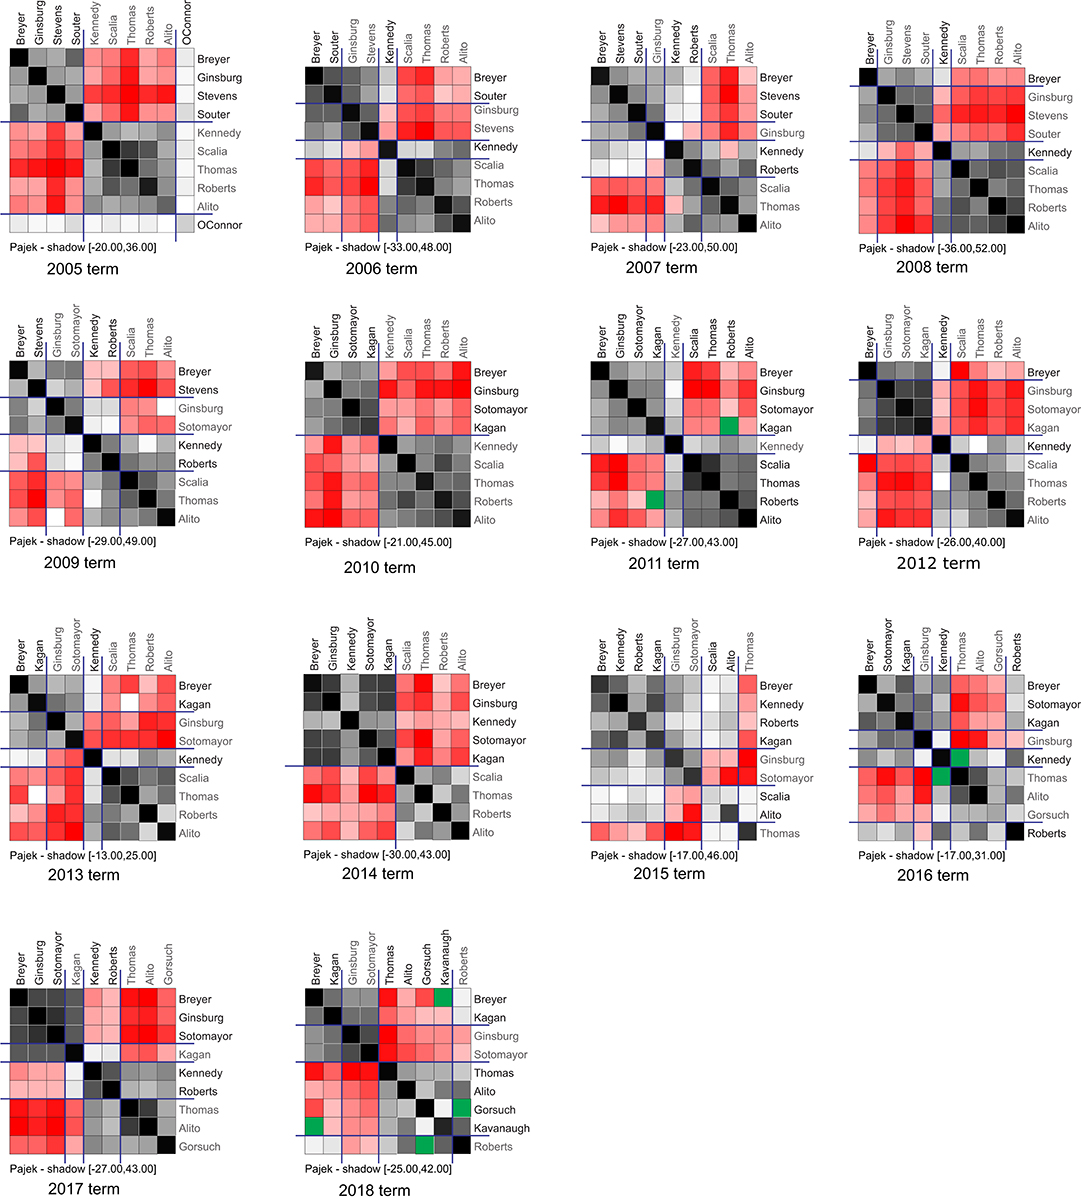
Figure 3. Relaxed structural balance partitions of the first 14 terms of the Roberts Court. Black and gray squares represent net levels of agreements between pairs of justices. Red and pink squares represent net levels of disagreements between pairs of justices. Green squares represent the value 0. Diagonal squares are necessarily black as, trivially, justices always agree with themselves. The largest positive value is represented by black cell, smaller positive values are represented by grayscale linearly descending. The same is true for negative values: the largest negative value is represented by true red, then red colors becomes less red when negative values are smaller. For the 2005 term, for example, the value 36 (the highest net number of agreements) is represented with true black and the value −20 (the highest net number of disagreements) with true red. The value of the criterion function for each of these years is 0 (except for 2007).
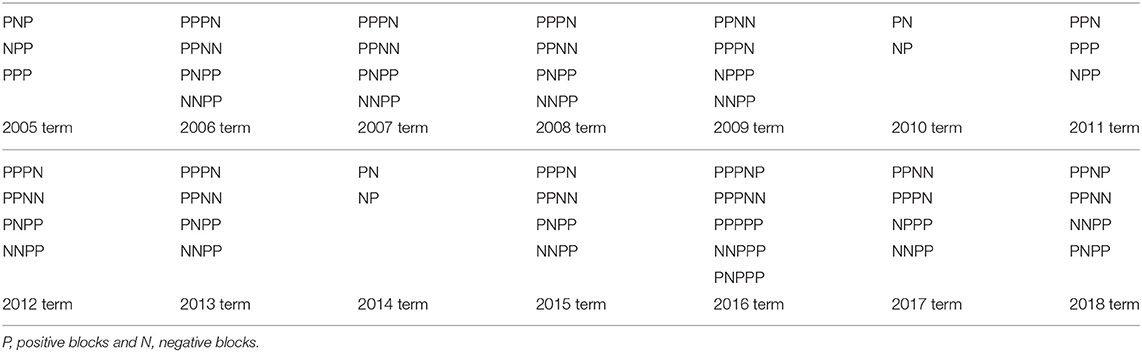
Table 1. The blockmodel structures for delineating the fundamental structure of the Roberts Court.
Table 1 contains the full set of signed blockmodels where P denotes a positive block and N a negative block. There are seven different signed blockmodel structures shown in Table 1. The structures appearing 2005, 2011, 2016, and 2018 terms each occurred only once. The most frequently occurring blockmodel structure occurred in the 2006, 2007, 2008, 2012, 2013, and 2015 terms. Another structure appears twice in the 2009 and 2017 terms.
For the 2005 term, one for which O'Connor participated in very few decisions before retiring, she is a singleton in a position. Coyle [34] notes that Alito, her replacement on the court, is far more conservative than she was. She had been the center of the court; a location Alito never would adopt. However, when the first signed blockmodel was redrawn without O'Connor, the partition is the stereotypical split with just the two wings. Coyle added that Kennedy became the center of the court. Our results below indicate this happened for some of the subsequent terms. Coyle [34] adds that this change in the composition of the court was extremely critical. Most certainly, it was. Changes in the composition of the Supreme Court will do this. But our partitioning approach still allows us to delineate the fundamental structure of the court.
For the 2006 term, there are four positions. One has Breyer and Souter from the liberal wing. The second position has Stevens and Ginsburg, the other two liberals. The two most liberal Justices are in their own position. Kennedy is in the third position, with the remaining conservatives in the fourth position. Kennedy acts as a partial bridge having net positive ties to Breyer and Souter, the milder liberals. There are again four positions for the 2007 term, but they are occupied differently. Three liberal justices—Breyer, Stevens, and Souter—occupy one position with the fourth liberal, Ginsburg, as a singleton in a position. Both Kennedy and Roberts are in the third position. They form a genuine bridge between the liberals, having positive ties with all of them, and the remaining conservatives in the fourth position. We noted (in footnote 10) that there is a net negative tie between Kennedy and Thomas, the most conservative justice.
The 2008 term has four positions also but with blockmodel structure that is a stark contrast to notion of the court having only two wings. Breyer is a singleton in a position as is Kennedy. The trio of Ginsburg, Stevens and Souter (all liberals) form another position. The final position is occupied by Scalia, Thomas, Roberts, and Alito (all conservatives).
For the 2009 term, there was a change in the composition of the court. Souter had resigned and was replaced by Sotomayor. In this term, the liberal justices were split into two positions. Breyer and Stevens occupy one. Ginsburg and Sotomayor form the second. We note that Kennedy and Roberts occupy the third position, again forming a partial bridge between Ginsburg and Sotomayor, by having small net positive ties with them, and the other three conservatives who are in the final position.
The signed blockmodel for the 2010 term is the only one consistent with the court having two wings. All of the liberals are in one position and all of the conservatives are in the second one. Of course, when O'Connor was removed for the 2005 term, it was present. As this signed blockmodel appeared only twice in the 14 terms we studied, this is compelling evidence against the universality of the “two-wings model.” Of course, it could appear again, especially with the addition of Gorsuch and Kavenaugh to the court. But it has not occurred thus far.
For the 2011 term, there are three positions. All of the liberals belong to one position. Kennedy belongs to the second position and all of the other conservatives are in the third one. Clearly he is back in his bridging role for this term. Although the signed valued network of the overall ties is different for the 2012 term, Kennedy remains the bridge between the liberals and the remaining conservatives for this term. Yet again, he is the bridge for the 2013 term. There are four positions as the liberals occupy two positions. Breyer and Kagan are in one while Ginsburg and Sotomayor are in the other.
At face value, the “two-wings model” returns in the 2014 term. The signed blockmodel has only two positions. All of the positive ties are within positions and all negative ties are between them. However, Kennedy, a conservative, in one position with all of the liberals while the other conservatives are in the second position. It would be too much of a stretch to claim that Kennedy had become a liberal justice in this term. But his voting behavior had far more in common with the liberals than with the conservatives during the 2014 term.
The blockmodel structure for the 2015 term is also far from the “two-wings model.” Breyer and Kagan (both liberals) are in the first position. As are Kennedy and Roberts, both conservatives. Ginsburg and Sotomayor are in the second position. Scalia and Alito are in the third position. Thomas is a singleton in the final position with overall negative ties to all of the other justices except Scalia and Alito. He dissents often in most terms.
Prior to the 2016 term, there was another change in the composition of the court. Scalia died and was replaced by Gorsuch. The signed blockmodel has five positions. Breyer, Sotomayor, and Kagan occupy one position. Ginsburg is a singleton in a position. Kennedy, in the third position, is back in his bridging role with positives ties with the liberals and positive ties with the remaining conservatives (except for Thomas with whom the tie is null). Thomas, Alito, and Gorsuch are in the fourth position. Roberts is also in a bridging role. However, it is different than that of Kennedy because of his overall negative tie with Ginsburg. The fact that Thomas, Alito, and Gorsuch are in a distinct position suggests that they have formed a extreme core for the conservatives.
For the 2017 term, there are again four positions. Breyer, Ginsburg, and Sotomayor occupy one with Kagan being a singleton in the second position. Kennedy and Roberts form the third position. To the extent they are in a bridging role, it is extremely weak as they have modest positive ties with only Kagan. Again, Thomas, Alito, and Gorsuch are in a distinct position. This may look very ominous for the future regarding subsequent decisions, at least from the liberal perspective.
For to the 2018 term, another change occurred in the court's personnel. Kennedy resigned from the court and was replaced by Kavanaugh, after a very contentious Senate hearing before he was confirmed. There are four positions. Breyer and Kagan occupy the first position. Ginsburg and Sotomayor occupy the second position. Kavanaugh joins Thomas, Alito, and Gorsuch in the third position. This leaves Roberts in the final position. To the extent that he has a bridging role, i.e., at best, minimal. He has an overall null tie with Gorsuch and very modest positive ties with Breyer and Kagan.
Despite the different fundamental structures of the Supreme Court across the 14 terms shown in Figure 3, one feature is common to them all (except for the 2007 term). All of the net ties among the liberal justices are positive, as is the case among the conservatives—except when the net tie between Kennedy and Thomas was −1 in 2007. While this could be viewed as consistent with the “two-wings model,” the results we have shown make it clear that is a very superficial characterization.
Table 2 presents the details of the composition of the positions identified for each of the 14 terms of the Roberts Court. Conservatives are listed in red. Liberals are listed in blue.
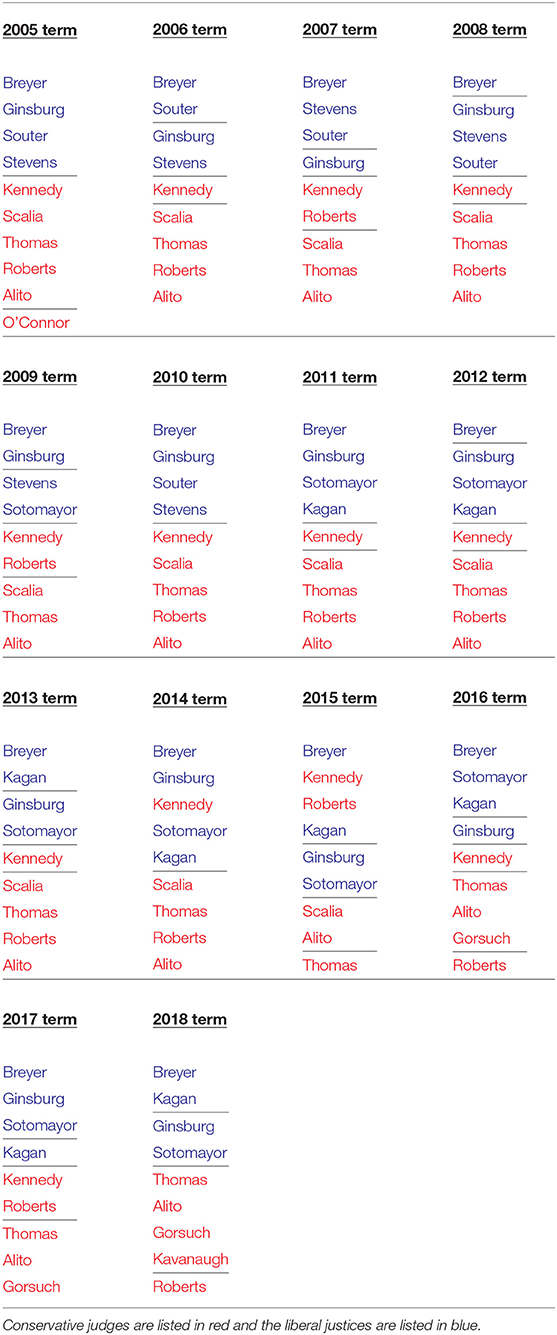
Table 2. The partitions of the justices into positions.
The use of colors is deliberate. Perhaps the most intriguing issue stemming from this table, and the fundamental structures of this court that we have identified, is trying to characterize the judicial views of the justices who have served on the Roberts Court. Also, the nature of their structural roles. To quote a line by Johnny Nash, an American singer and song writer, “There are more questions than answers.” Given the composition of the different positions we have identified, the notions of “conservative” and “liberal” are far more complex than the simple use of these labels implies. We can state that whenever Kennedy is a singleton or Roberts is a singleton in a position, they both play a bridging role in the court. Sometimes this is strong and other times it is much weaker. When they are clustered together without other justices, they play this role in conjunction. For every other justice appearing as a singleton, this was never the case. What splits both the “conservatives” and the “liberals” merits further attention. Equally important is to consider what brings them together in support of some decisions and what brings them together to oppose other decisions.
We return briefly to the work of Walker et al. [24] to examine if the Roberts Court was cohesive, in their sense, but do so in a slightly different fashion. For each term of the Roberts Court, we counted the number of majority decisions, the number of concurring decisions, the number of concur-dissent opinions and the number of dissenting opinions. We combined the numbers of non-majority opinions and compared this total with the count of majority opinions. Figure 4 presents the trajectories across the term. The startling feature is that, for every term, there were far more non-majority opinions than there were majority opinions. In the sense of Walker et al. [24], the Roberts Court was far from being cohesive. This is fully consistent with results shown above.
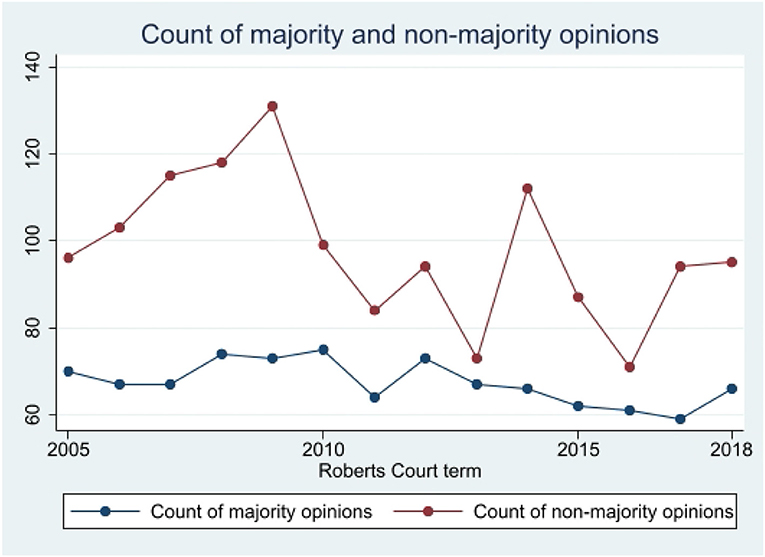
Figure 4. Count of majority and non-majority opinions.
Table 3 presents the corresponding rates for the non-majority opinions for each term.

Table 3. The non-majority opinion rates by terms for the Roberts Court.
9. Conclusions, Limitations, and Future Work
We have several clear conclusions to report. One is that we have identified the fundamental structure of the Supreme Court under Chief Justice Roberts, at least as we have defined it. We have shown how this fundamental structure has changed over 14 terms in a very coherent fashion. The transitions are complex. We started with overviews of the four areas of research in which our work is located. While they were, perhaps, too brief, we provide many references so that readers can look more closely at these areas. We set out to provide a method for delineating the structures of signed networks and showing how they change over time. In this, we were successful. For 13 of the 14 terms, the criterion function was 0. For the one exception, its value was 2, the problem we have addressed. The partitions are unique for each term, suggesting that we have, indeed, identified the fundamental structure of this court. We have provided also a variety of further questions that can be explored given what our research has revealed. We showed also that the Roberts court was not cohesive in the sense of Walker et al. [24].
As to limitation, the most obvious one is that we studied a small network. In our defense, it was exactly the network which we were interested in substantively as the US Supreme Court's decisions are most important for the organization of the social life of the US. Of course, we are aware that it will be more difficult to scale this approach upwards for larger networks. In our view, this has to be done even if implies that newer methods need to be developed.
Our hope is that this strictly structural approach will provide more traditional Supreme Court scholars with insights for extending their approaches. We have suggested this in the form of going far beyond the simple minded concepts of “conservative” and “liberal” justices. As we have shown, they play for more complicated roles on this court.
But this Supreme Court is only one example of signed networks. So, we hope that readers of this contribution will see value in it for their own work and, perhaps, apply our methods to other signed networks that they study.
For our future efforts, we will consider the decision projection of the two-mode network with decisions as the units. The nature of this network merits further exploration. In addition, we plan to partition the 2-mode networks for each term to couple the simultaneous partitions of justices and decisions described in term of both substance and constitutional issues. We will examine further the lack of cohesiveness in this court. We did collect also networks of justices signing the decisions written by other justices both for supporting decisions and dissenting from them. We plan on analyzing these networks for all 14 terms.
Data Availability Statement
The raw data supporting the conclusions of this article will be made available by the authors, without undue reservation.
Author Contributions
All authors listed have made a substantial, direct and intellectual contribution to the work, and approved it for publication.
Conflict of Interest
The authors declare that the research was conducted in the absence of any commercial or financial relationships that could be construed as a potential conflict of interest.
Footnotes
1. ^There are instances when the two have the same criterion function which occurs only when the structural balance pre-specified signed blockmodel is appropriate.
2. ^There are more complex opinions taking the form of consenting and dissenting. These are considered in more detail below.
3. ^We note that even for per curium (unsigned) decisions, there can be dissents.
4. ^Even unanimous decisions can have one of more concurrences.
5. ^To guide us with this decision, we used the Oyez website https://www.oyez.org/cases/ which provides concise summaries of the issues and the opinions written. For each concur/dissent opinion, this source assessed whether the opinion was an agreement or a dissent. We followed their coding for these decisions. The Oyez project is the product of a collaboration between The University of Cornell's Legal Institute (https://www.law.cornell.edu/), Justia (https://www.justia.com/) and the Chicago-Kent College of Law (https://www.kentlaw.iit.edu/) maintained at the Illinois Institute of Technology. This source was assessed between January 2020 and April 2020.
6. ^These data were assembled by the first author and cleaned three times to remove errors. We view cleaning data to be of critical importance and must be done for all network data sets. Of course, it is far easier to do this for smaller networks.
7. ^The reasons include justices recusing themselves if they have a conflict of interest, not being on the court when the arguments were heard and illness.
8. ^The latter group, in various documents, has been called liberals, moderates and on the left. We use liberals as the label for them.
9. ^https://mqscores.lsa.umich.edu/measures.php
10. ^The one exception was for the 2007 term. When the number of positions was four, the value of the criterion function was 2. For all larger number of positions there were partitions for which the criterion function was 0. However, for all of these numbers of positions, there were multiple equally well-fitting partitions. Comparing them using the Adjusted Rank Index revealed these partitions differed. As there is no principled way of choosing between such partitions, we used the unique partition for four positions. We think the reason for this was the overall number for Kennedy and Thomas, two conservatives, was negative.
References
1. Lorrain F, White HC. Structural equivalence of individuals in social networks. J Math Sociol. (1971) 1:49–80. doi: 10.1080/0022250X.1971.9989788
2. Breiger RL, Boorman SA, Arabie P. An algorithm for blocking relational data, with applications to social network analysis and comparison with multidimensional scaling. J Math Psychol. (1975) 12:328–83. doi: 10.1016/0022-2496(75)90028-0
4. Doreian P, Batagelj V, Ferligoj A. Generalized Blockmodeling. Vol. 25. Cambridge: Cambridge University Press (2005).
5. Doreian P, Batagelj V, Ferligoj A. Partitioning networks based on generalized concepts of equivalence. J Math Sociol. (1994) 19:1–27. doi: 10.1080/0022250X.1994.9990133
6. Newman ME. Modularity and community structure in networks. Proc Natl Acad Sci USA. (2006) 103:8577–82. doi: 10.1073/pnas.0601602103
7. Traag VA, Bruggeman J. Community detection in networks with positive and negative links. Phys Rev E. (2009) 80:036115. doi: 10.1103/PhysRevE.80.036115
8. Doreian P, Batagelj V, Ferligoj A. Advances in Network Clustering and Blockmodeling. Hoboken, NJ; Chichester: John Wiley & Sons (2020).
9. de Nooy W, Mrvar A, Batagelj V. Exploratory Social Network Analysis With Pajek: Revised and Expanded Edition for Updated Software. Vol. 46. Cambridge: Cambridge University Press (2018).
10. Heider F. Attitudes and cognitive organization. J Psychol. (1946) 21:107–12. doi: 10.1080/00223980.1946.9917275
12. Cartwright D, Harary F. Structural balance: a generalization of Heider's theory. Psychol Rev. (1956) 63:277. doi: 10.1037/h0046049
13. Davis JA. Clustering and structural balance in graphs. Hum Relat. (1967) 20:181–7. doi: 10.1177/001872676702000206
14. Doreian P, Mrvar A. A partitioning approach to structural balance. Soc Netw. (1996) 18:149–68. doi: 10.1016/0378-8733(95)00259-6
15. Doreian P, Krackhardt D. Pre-transitive balance mechanisms for signed networks. J Math Sociol. (2001) 25:43–67. doi: 10.1080/0022250X.2001.9990244
16. Hummon NP, Doreian P. Some dynamics of social balance processes: bringing Heider back into balance theory. Soc Netw. (2003) 25:17–49. doi: 10.1016/S0378-8733(02)00019-9
17. Doreian P, Mrvar A. Structural balance and signed international relations. J Soc Struct. (2015) 16:1. doi: 10.21307/joss-2019-012
18. Doreian P. Reflections on studying signed networks. J Interdiscipl Methodol Issues Sci Graphs Soc Syst. (2017) 2:hal-01367832v3. doi: 10.18713/JIMIS-170117-2-1
19. Doreian P, Mrvar A. Partitioning signed social networks. Soc Netw. (2009) 31:1–11. doi: 10.1016/j.socnet.2008.08.001
20. Abell P, Ludwig M. Structural balance: a dynamic perspective. J Math Sociol. (2009) 33:129–55. doi: 10.1080/00222500902718239
23. Batagelj V, Doreian P, Ferligoj A, Kejžar N. Understanding Large Temporal Networks and Spatial Networks: Exploration, Pattern Searching, Visualization and Network Evolution. Vol. 2. Hoboken, NJ; Chichester: John Wiley & Sons (2014).
24. Walker TG, Epstein L, Dixon WJ. On the mysterious demise of consensual norms in the United States Supreme Court. Am J Polit Sci. (1988) 50:361–89. doi: 10.2307/2131799
25. Wahlbeck PJ, Spriggs JF, Maltzman F. Marshalling the court: bargaining and accommodation on the United States Supreme Court. Am J Polit Sci. (1998) 42:294–315. doi: 10.2307/2991757
26. Black D. On the rationale of group decision-making. J Polit Econ. (1948) 56:23–34. doi: 10.1086/256633
28. Martin AD, Quinn KM, Epstein L. The median justice on the united states supreme court. N C Law Rev. (2004) 83:1275–321.
29. Fowler JH, Jeon S. The authority of Supreme Court precedent. Soc Netw. (2008) 30:16–30. doi: 10.1016/j.socnet.2007.05.001
30. Irons P. A People's History of the Supreme Court: The Men and Women Whose Cases and Decisions Have Shaped OurConstitution: Revised Edition. New York, NY: Penguin (2006).
31. Vile JR. Essential Supreme Court Decisions: Summaries of Leading Cases in US Constitutional Law. Rowman & Littlefield Publishers (2010). Lanham, MD.
32. Epstein L, Martin AD, Quinn KM, Segal JA. Ideological drift among Supreme Court justices: who, when, and how important. Nw Univ Law Rev. (2007) 101:1483.
33. Martin AD, Quinn KM. Dynamic ideal point estimation via Markov chain Monte Carlo for the US Supreme Court, 1953–1999. Polit Anal. (2002) 10:134–53. doi: 10.1093/pan/10.2.134
34. Coyle M. The Roberts Court: The Struggle for the Constitution. New York, NY: Simon and Schuster (2013).
35. Martin AD, Quinn KM. Dataset With Ideological Scores for Justices on the Supreme Court From October 1937 Through October 2019. (2020). Ann Arbor, MI: University of Michigan College of Literature, Science and the Arts (2020). Available online at: https://mqscores.lsa.umich.edu/measures.php.
36. Borgatti S, Everett M. Network analysis of 2-mode data. Soc Netw. (1997) 19:243–69. doi: 10.1016/S0378-8733(96)00301-2
37. Mrvar A, Doreian P. Partitioning signed two-mode networks. J Math Sociol. (2009) 33:196–221. doi: 10.1080/00222500902946210
Keywords: signed networks, network structure, partitioning networks, network in time, Supreme Court, Roberts Court
Citation: Doreian P and Mrvar A (2020) Delineating Changes in the Fundamental Structure of Signed Networks. Front. Phys. 8:294. doi: 10.3389/fphy.2020.00294
Received: 28 April 2020; Accepted: 29 June 2020;
Published: 14 August 2020.
Edited by:
Andrea Pizzoferrato, Queen Mary University of London, United KingdomReviewed by:
Michele Bellingeri, University of Parma, ItalyVincent Labatut, Laboratoire Informatique d'Avignon, France
Ion Georgiou, Escola de Administração da Fundação Getulio Vargas (FGV-EAESP), Brazil
Copyright © 2020 Doreian and Mrvar. This is an open-access article distributed under the terms of the Creative Commons Attribution License (CC BY). The use, distribution or reproduction in other forums is permitted, provided the original author(s) and the copyright owner(s) are credited and that the original publication in this journal is cited, in accordance with accepted academic practice. No use, distribution or reproduction is permitted which does not comply with these terms.
*Correspondence: Patrick Doreian, cGl0cGF0QHBpdHQuZWR1