- 1State Key Laboratory of Space Weather, National Space Science Center, Chinese Academy of Sciences, Beijing, China
- 2University of Chinese Academy of Sciences, Beijing, China
- 3School of Astronomy and Space Science, University of Chinese Academy of Sciences, Beijing, China
- 4College of Earth and Planetary Sciences, University of Chinese Academy of Sciences, Beijing, China
Cosmic rays (CRs) are considered the primary energetic particle source of atmospheric ionization on Earth. Under the modulation of severe solar eruption events, CR variations are further speculated to impact the Earth's lightning activities. Previous researches show that CR intensity and lightning incidence are positively correlated on the time scale of several days to decades. However, to our knowledge, the global lightning response to short-term CR variation has not been studied in the literature. Ground level enhancements (GLEs) provide the opportunity to study such a possible link. As a small fraction of solar energetic particle events that could reach the energy level of several GeVs, GLEs can thus generate atmospheric cascades that could be recorded by ground-based neutron monitors. Furthermore, as GLEs generally take place within several 10 min to an hour, the lightning variations caused by potential meteorological factors could be maximally diminished in such a short time. During the operational period of the World Wide Lightning Location Network (Aug 2004 to now), three typical GLEs with the intensity >15% are analyzed from the International GLE Database, namely #69 (Jan 20, 2005), #70 (Dec 13, 2006), and #71 (May 17, 2012). For each GLE event, the global lightning incidence presents a positive response to GLE (i.e., a significant enhancement within 20 min right after the GLE onset). Meanwhile, the relative amplitude of lightning response seems to be in direct proportion to GLE intensity (i.e., the more intensive the GLE is, the more obvious the increase in the lightning incidence is), which is further verified to be statistically significant by Monte Carlo test. By comparing lightning responses in different latitudinal zones, we find that more intensive lightning responses to GLEs seem to be at higher latitudes.
Introduction
The influence of space weather variation on the Earth's atmospheric electrical environment has consistently captured attention in recent years. Cosmic rays (CRs), including Galactic Cosmic Rays (GCRs) and Solar Energetic Particles (SEPs), are considered the primary source of energetic particle originating from the extraterrestrial space and impinging upon the Earth's atmosphere [1]. GCRs, modulated by solar activities, are found to be the main source of atmospheric ionization, which continually interact with atomic nuclei in the air and generate secondary particles [2]. A small fraction of SEP events, which are identified as Ground Level Enhancements (GLEs), tend to affect atmospheric ionization by sporadic penetrations into the atmosphere during explosive energy releases of severe solar activities.
A GLE event generally possesses the energy of several GeV and generates atmospheric cascades which could be recorded by ground-based neutron monitor (NM) stations [3]. A series of studies by Mishev et al. [4–7] demonstrate that GLEs, especially the most extreme ones, have a significantly positive effect on the short-time variation of the atmospheric ionization at high-altitudes of around 12–18 km in polar and sub-polar regions. Moderate or even negative responses are found at middle- and low-latitudes due to the accompanying Forbush Decreases (FDs). Similar results are found by Usoskin et al. [8] and Velinov et al. [9]. In addition to atmospheric ionization, the major GLEs are also claimed to result in a larger air conductivity and further create significant variations in the strength of the electric field, especially in its vertical component [10–14]. Recently, Golubenko et al. [15] find that an extreme SEP event could lead to a large increase in fair-weather downward current density on a global scale. Such variations do not only exist in the upper atmosphere above thunderstorms, but also extend down to the ground level. Changes in atmospheric ionization and electric field resulting from GLEs may eventually apply to the global electric circuit by inferred effects on cloud microphysics, thunderstorms, and other climate parameters, etc. [16–20].
Lightning is a proxy for the variation in the Earth's atmospheric electrical environment. Although primarily maintained by meteorological factors, lightning is also speculated to be positively modulated by GCRs [21–24]. Most studies mainly focused on the timescale of several days to several decades, especially on FDs [25, 26]. However, to our knowledge, lightning response to short-term CR variation has not been studied in the literature. GLEs provide a good opportunity to focus on such a possible link between CRs and atmospheric processes. On one hand, GLEs present the increasing phases of CR variation, which could be in contrast with the decreasing phases presented by FDs. On the other hand, as GLEs generally occur within several 10 min to an hour, the potential effects of meteorological factors on lightning could be maximally diminished within such a short time.
In this study, we focus on the responses of lightning incidence to SEP intensity during GLE events. The GLE events are selected from the International GLE database and the lightning data are obtained from the World Wide Lightning Location Network (WWLLN). Section 2 introduces the data sets and methodology. Section 3 gives the results of the lightning responses to GLEs and Monte Carlo tests, including some brief discussions. Section conclusion summarizes our work.
Data Sets and Methodology
The WWLLN1 has been continuously providing global lightning detection at ground level since August 2004. Being operated by the University of Washington (USA) and the University of Otago (New Zealand), it currently has over 70 sensors which are generally uniformly distributed at distances over thousands of kilometers around the globe. These sensors identify lightning transients and process sferic wave packets in the very-low-frequency band (100 Hz−24 kHz) [27]. Using Time of Group Arrival (TOGA) analysis, each lightning stroke location requires the TOGA from at least five sensors [28]. Typically, only about 15–30% of lightning strokes detected by one sensor are detected by five or more [29]. In addition, the detection efficiency of the WWLLN is in direct proportion to the peak current intensity of lighting return strokes [30], which is now up to 80% of the strokes above 50 kA peak current. Thus, the following results are mainly valid for the lightning strokes with the peak current above 50 kA.
The International GLE database2 collects and archives neutron counting rates concerning GLEs from the worldwide NM network [31]. The NM network has been successively monitoring GLEs since the 1950's. The first and strongest event detected on Feb 23, 1956 was recorded as GLE number 5 (#5). The following events are numbered consecutively. There are five identified GLEs during the operational period of the WWLLN, namely #68 (Jan 17, 2005), #69 (Jan 20, 2005), #70 (Dec 13, 2006), #71 (May 17, 2012), and #72 (Sep 10, 2017). In this study, only the GLEs satisfying the following criteria are analyzed:
1. The largest enhancement in neutron counting rate observed by some NM station during the GLE event is required to be >15%.
2. The increasing phase of the GLE event is evident, and its rising time is required to be <30 min.
Thus, three GLEs, #69 (Jan 20, 2005), #70 (Dec 13, 2006), and #71 (May 17, 2012), are selected and analyzed in this study. The largest enhancement in neutron counting rate is 4808.95% (#69, observed by SOPB), 92.1% (#70, observed by OULU), and 17.3% (#71, observed by SOPO), respectively. The corresponding rising time is 10, 20, and 20 min, respectively.
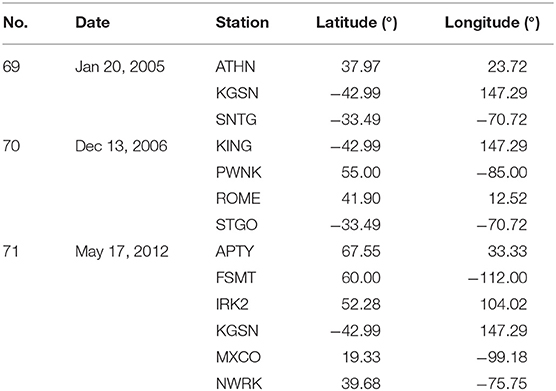
To present the general variation characteristics of a GLE event, we further use the average neutron counting rate of several NM stations which are close to the areas with a high incidence of lightning during each GLE. The GLE intensity, defined as the average enhancement in neutron counting rate observed by these selected NM stations, is 40.0% (#69), 9.5% (#70), and 3.9% (#71), respectively. Since both the lightning distribution and NM stations in operation change over time, the stations used for each GLE event are different, as listed in Table 1.
Relative variations of lightning incidence in 1.5 h for these three GLEs are investigated, from 20 min before the GLE onset to 70 min later than that. During this period, relative variations of lightning incidence are obtained by dividing the number of lightning strokes in every 10 min by the value in the first 10-min after the GLE onset. Similarly, relative variations of the neutron counting rate are obtained with a temporal resolution of 5 min. To maximally reduce the potential effects of meteorological factors, we focus on the lightning response within 20 min after the GLE onset and define the value in the second 10-min after the GLE onset as the lightning response intensity.
Results
Case Analysis
Figure 1A shows the results during GLE #69. The relative variation in SEP, represented by the red line, rapidly increases to its peak value within 15 min after the GLE onset at 06:55, giving the GLE intensity of 40.0%. After the GLE onset, the lightning incidence histogram also presents a significant enhancement within 20 min, giving the lightning response intensity of 1.37. During the SEP recovery, the lightning incidence presents some relatively minor fluctuations. This indicates that short-term SEP intensity enhancement during a GLE event may lead to a sharp and timely increase in global lightning incidence.
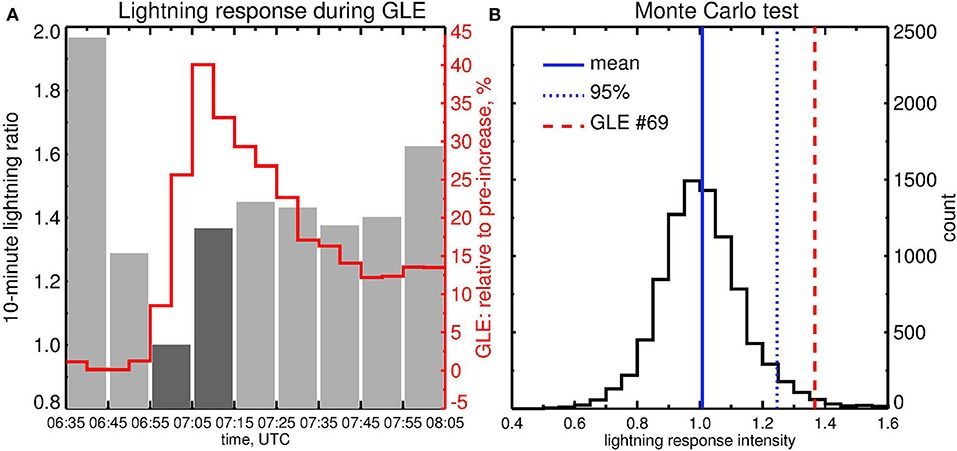
Figure 1. (A) Lightning response during GLE #69 (Jan 20, 2005). The red line represents the relative change of 5-min neutron counting rates, the gray bars represent the relative variation of 10-min lightning incidence. (B) Results of the Monte Carlo test in 2005. The total number of tests is 9,000. The blue solid line represents the mean value, the blue dotted line represents the value at 95% confidence level, and the red dashed line represents the observed lightning response intensity.
To further verify the reliability of the above lightning response to GLE #69, a Monte Carlo test is conducted as follows. Firstly, we randomly select a 20-min interval in 2005. Secondly, we determine the relative change of global lightning in this interval. Thirdly, we repeat such processes by 9,000 times, getting the histogram distribution of relative change of lightning incidence in 2005, as shown in Figure 1B. The relative change in lightning incidence is generally between 0.6 and 1.4, with both the peak and mean value close to unity, presenting a normal distribution. The lightning response intensity during GLE #69 is 1.37, satisfying the requirement of the 95% confidence level (1.25) to a fairly large extent. Thus, such a positive response of lightning incidence to GLE #69 is statistically significant.
Lightning variations during GLE #70 and #71 are analyzed in the same way. As shown in Figure 2A, the corresponding intensity of GLE #70 is about 9.5%. The onset time is 03:05, with an increasing phase of about 25 min. During this period, the lightning incidence also increases simultaneously until 03:35, with a more rapid growth within the first 20 min, giving the lightning response intensity of 1.11. After that, the lightning incidence generally presents a similar decreasing trend following the recovery of SEP despite some fluctuations. Overall, there is a relatively evident positive response of lightning during GLE #70. Similarly, a Monte Carlo test is performed for this event and further demonstrates the statistical significance of this relation. As shown in Figure 2B, the lightning response intensity of GLE #70 satisfies the requirement of the 85% confidence level.
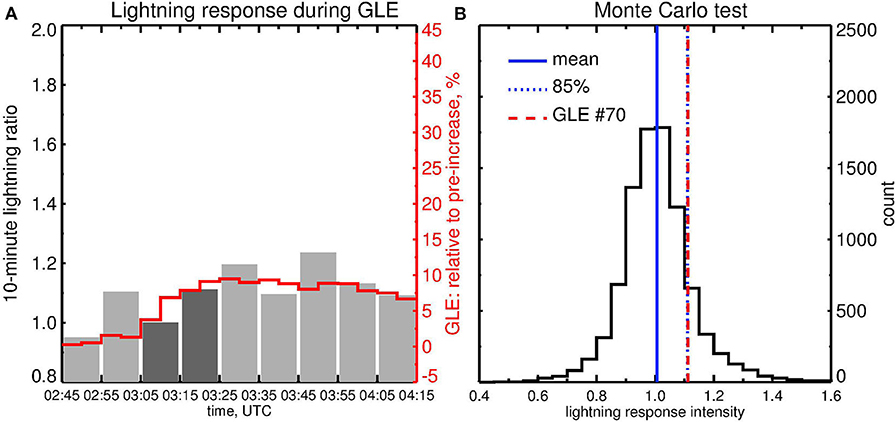
Figure 2. (A) Lightning response during GLE #70 (Dec 13, 2006). (B) Results of the Monte Carlo test in 2006. The blue dotted line represents the value at 85% confidence level.
As shown in Figure 3A, the onset time of GLE #71 is 01:55. During this event, the relative change in SEP reaches its maximum of 3.9% within 25 min after the GLE onset. Global lightning incidence keeps increasing until 02:35, giving the response intensity of 1.03. It then presents minor fluctuations during GLE recovery. Similarly, the positive response of lightning is further verified by the Monte Carlo test. As shown in Figure 3B, the lightning response intensity of GLE #71 also satisfies the requirement of the 80% confidence level.
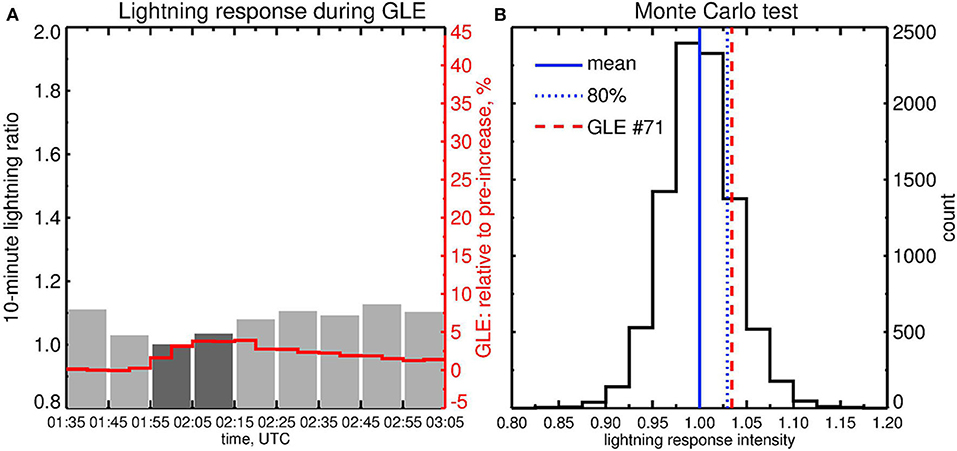
Figure 3. (A) Lightning response during GLE #71 (May 17, 2012). (B) Results of the Monte Carlo test in 2012. The blue dotted line represents the value at 80% confidence level.
According to the case analysis for the three GLEs, global lightning incidence presents a positive response to SEP rapid enhancement during a GLE event. Meanwhile, as the GLE intensity varies from 40.0% (#69) to 9.5% (#70), and then to 3.9% (#71), the corresponding lightning response intensity decreases from 1.37 to 1.11, and then to 1.03, so does the satisfied confidence level of each Monte Carlo test (95, 85, and 80%). This indicates that the lightning response intensity seems to be in direct proportion to the GLE intensity. A plausible physical mechanism is speculated as follows. The atmospheric ionization rate during GLEs increases through the avalanche of particles with high energies [e.g., [4, 5]], which further intensifies the air conductivity and the atmospheric electric field [e.g., [10, 12, 14, 15]]. Such variations in the atmosphere might eventually apply to the global electric circuit [e.g., [18–20]]. As an essential part of the electric circuit, lightning strokes are thus more likely to be triggered during GLEs.
Latitudinal Effect
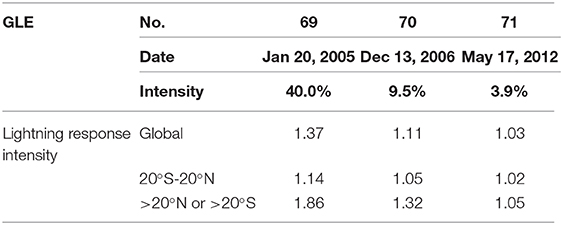
To investigate the latitudinal effect, we study the lightning response intensities in different latitudinal zones. For the three GLE events, most of the lightning strokes (94.0–99.5%) locate between 40°S and 40°N. To make the comparison of sufficient statistical significance, we roughly divide the global lightning activity into two latitudinal zones. One is at low latitudes (20°S-20°N), the other is at the middle to high latitudes (>20°S or >20°N).
Table 2 gives the results of lightning response intensity in different latitudinal zones. For GLE #69, the lightning response intensity is 1.14 at low latitudes and increases to 1.86 at higher latitudes. For GLE #70 and GLE #71, the values are 1.05 vs. 1.32 and 1.02 vs. 1.05, respectively. The lightning response intensity is greater at higher latitudes.
SEP flux during GLEs is subject to the cutoff rigidity varying in phase with the Earth's geomagnetic latitude. The larger SEP flux at higher latitudes is more likely to affect the lightning activity accordingly. As shown in Figure 4, the GLE intensity for the three GLEs indeed generally increases with the geomagnetic latitude of NM stations. Thus, it is reasonable to find lightning responses more intensively at higher latitudes during GLEs. As for the low latitudes, we speculate that GLEs might indirectly affect the lightning activity through the global electric circuit, which still needs to be verified in the future.

Figure 4. Relation between geomagnetic latitude and GLE intensity for (A) GLE #69, (B) GLE #70 and (C) GLE #71. The black points represent all the NM stations which observed the corresponding GLE event. The black dashed line represents the linear fitting relation between geomagnetic latitude and GLE intensity for each event.
Conclusion
GLEs generally take place within several 10 min to an hour. During such a short time, the interferences of potential meteorological factors could be maximally diminished when studying the effect of CRs on global lightning activities. To our knowledge, no previous works have been done in the literature focusing on the short-term lightning response to GLEs. In this study, we investigate the lightning responses to three typical GLEs (#69, #70, and #71), aiming to provide some new observational evidence for the possible link between CRs and atmospheric processes. The major results are summarized as follows:
(1) Global lightning incidence presents a significant enhancement within 20 min right after the GLE onset.
(2) The relative amplitude of lightning response seems to be in direct proportion to GLE intensity, which is further verified to be statistically significant by the Monte Carlo test.
(3) Lightning response to GLE seems to be more intensive at higher latitudes.
As the detection efficiency of the WWLLN is up to 80% of the lightning strokes above 50 kA peak current [30], our results are mainly valid for the lightning strokes with a peak current above 50 kA. Meanwhile, only three GLE events with the relative intensity >15% and the rising time <30 min are studied during the operational period of the WWLLN. To further verify the effect of GLEs on the global lightning activities in the timescale of several 10 min, a comprehensive statistical survey is needed in the future. Besides, regional lightning responses during GLEs are worthy of specialized investigations as well.
Data Availability Statement
Publicly available datasets were analyzed in this study. This data can be found here: 1. World Wide Lightning Location Network (WWLLN): http://wwlln.net/ 2. The International GLE Database: https://gle.oulu.fi/#/.
Author Contributions
QW contributed to the data processing, data analysis, data interpreting, and manuscript writing. HL contributed to the study designing, data analysis, data interpreting, and manuscript revising. CW contributed to the data interpreting and manuscript revising. All authors contributed to the article and approved the submitted version.
Funding
This work was supported by the Strategic Priority Research Program of the Chinese Academy of Sciences (CAS, China), grant no. XDA17010301; the National Natural Science Foundation of China, grant nos. 41874203, 41574169, 41574159, and 41731070; the Young Elite Scientists Sponsorship Program of the China Association for Science and Technology, grant no. 2016QNRC001; the Strategic Pioneer Program on Space Science of CAS, China, grant no. XDA15052500; and in part by the Specialized Research Fund for State Key Laboratories of China. HL is also supported by the Youth Innovation Promotion Association of CAS, China and the research fund for key development directions of the National Space Science Center of CAS, China. CW is also supported by the Key Research Program of Frontier Sciences of CAS, China, grant no. QYZDJ-SSW-JSC028.
Conflict of Interest
The authors declare that the research was conducted in the absence of any commercial or financial relationships that could be construed as a potential conflict of interest.
Acknowledgments
We thank the University of Oulu/Sodankyla Geophysical Observatory for providing the International GLE Database. We thank the World Wide Lightning Location Network for providing the lightning location data.
Footnotes
1. ^WWLLN: http://wwlln.net/
2. ^International GLE database: https://gle.oulu.fi/#/
References
1. Bazilevskaya GA, Usoskin IG, Flückiger EO, Harrison RG, Desorgher L, Bütikofer R, et al. Cosmic ray induced ion production in the atmosphere. Space Sci Rev. (2008) 137:149–73. doi: 10.1007/s11214-008-9339-y
2. Usoskin IG, Desorgher L, Velinov P, Storini M, Flückiger EO, Bütikofer R, et al. Ionization of the earth's atmosphere by solar and galactic cosmic rays. Acta Geophys. (2009) 57:88–101. doi: 10.2478/s11600-008-0019-9
3. Gopalswamy N, Xie H, Yashiro S, Akiyama S, Makela P, Usoskin IG. Properties of ground level enhancement events and the associated solar eruptions during solar cycle 23. Space Sci Rev. (2012) 171:23–60. doi: 10.1007/s11214-012-9890-4
4. Mishev AL, Velinov PIY, Mateev L, Tassev Y. Ionization effect of solar protons in the Earth atmosphere—Case study of the 20 January 2005 SEP event. Adv Space Res. (2011) 48:1232–7. doi: 10.1016/j.asr.2011.06.004
5. Mishev AL, Velinov PIY, Mateev L, Tassev Y. Ionization effect of nuclei with solar and galactic origin in the Earth atmosphere during GLE 69 on 20 January 2005. J Atmos Solar Terrestrial Phys. (2012) 89:1–7. doi: 10.1016/j.jastp.2012.06.012
6. Mishev AL, Velinov PIY. Time evolution of ionization effect due to cosmic rays in terrestrial atmosphere during GLE 70. J Atmos Solar Terrestrial Phys. (2015) 129:78–86. doi: 10.1016/j.jastp.2015.04.016
7. Mishev AL, Velinov PIY. Ion production and ionization effect in the atmosphere during the Bastille day GLE 59 due to high energy SEPs. Adv Space Res. (2018) 61:316–25. doi: 10.1016/j.asr.2017.10.023
8. Usoskin IG, Kovaltsov GA, Mironova IA, Tylka AJ, Dietrich WF. Ionization effect of solar particle GLE events in low and middle atmosphere. Atmos Chem Phys. (2011) 11:1979–88. doi: 10.5194/acp-11-1979-2011
9. Velinov PIY, Mishev A, Iop Comparison of ionization effect in the atmosphere of the Earth due to GLE 65 and GLE 69. In: 23rd European Cosmic Ray Symposium (and 32nd Russian Cosmic Ray Conference). Moscow. (2013). p. 409. doi: 10.1088/1742-6596/409/1/012211
10. Farrell WM, Desch MD. Solar proton events and the fair weather electric field at ground. Geophys Res Lett. (2002) 29:37–34. doi: 10.1029/2001GL013908
11. Kokorowski M, Sample J, Holzworth R, Bering E, Bale S, Blake J, et al. Rapid fluctuations of stratospheric electric field following a solar energetic particle event. Geophys Res Lett. (2006) 33:L20105. doi: 10.1029/2006GL027718
12. Smirnov SE, Mikhailova GA, Kapustina OV. Variations in electric and meteorological parameters in the near-Earth's atmosphere at Kamchatka during the solar events in October 2003. Geomagnetism Aeronomy. (2014) 54:240–7. doi: 10.1134/S0016793214020182
13. Shumilov OI, Kasatkina EA, Frank-Kamenetsky AV. Effects of extraordinary solar cosmic ray events on variations in the atmospheric electric field at high latitudes. Geomagnetism Aeronomy. (2015) 55:650–7. doi: 10.1134/S0016793215050151
14. Tacza J, Raulin JP, Mendonca RRS, Makhmutov VS, Marun A, Fernandez G. Solar effects on the atmospheric electric field during 2010–2015 at low latitudes. J Geophys Res Atmos. (2018) 123:11970–9. doi: 10.1029/2018JD029121
15. Golubenko K, Rozanov E, Mironova I, Karagodin A, Usoskin I. Natural sources of ionization and their impact on atmospheric electricity. Geophys Res Lett. (2020) 47:e2020GL088619. doi: 10.1029/2020GL088619
16. Rycroft MJ, Israelsson S, Price C. The global atmospheric electric circuit, solar activity and climate change. J Atmos Solar Terrestrial Phys. (2000) 62:1563–76. doi: 10.1016/S1364-6826(00)00112-7
17. Tinsley BA, Burns GB, Zhou L. The role of the global electric circuit in solar and internal forcing of clouds and climate. Adv Space Res. (2007) 40:1126–39. doi: 10.1016/j.asr.2007.01.071
18. Rycroft MJ, Harrison RG, Nicoll KA, Mareev EA. An overview of earth's global electric circuit and atmospheric conductivity. Space Sci Rev. (2008) 137:83–105. doi: 10.1007/s11214-008-9368-6
19. Rycroft MJ, Nicoll KA, Aplin KL, Giles Harrison R. Recent advances in global electric circuit coupling between the space environment and the troposphere. J Atmos Solar Terrestrial Phys. (2012) 90–1:198–211. doi: 10.1016/j.jastp.2012.03.015
20. Nicoll KA. Space weather influences on atmospheric electricity. Weather. (2014) 69:238–41. doi: 10.1002/wea.2323
21. Lethbridge MD. Cosmic rays and thunderstorm frequency. Geophys Res Lett. (1981) 8:521–2. doi: 10.1029/GL008i005p00521
22. Gurevich AV, Milikh GM, Roussel-Dupre R. Runaway electron mechanism of air breakdown and preconditioning during a thunderstorm. Phys Lett A. (1992) 165:463–8. doi: 10.1016/0375-9601(92)90348-P
23. Gurevich AV, Zybin KP, Roussel-Dupre RA. Lightning initiation by simultaneous effect of runaway breakdown and cosmic ray showers. Phys Lett A. (1999) 254:79–87. doi: 10.1016/S0375-9601(99)00091-2
24. Chronis T. Investigating possible links between incoming cosmic ray fluxes and lightning activity over the United States. J Climate. (2009) 22:1. doi: 10.1175/2009JCLI2912.1
25. Kristjánsson J, Stjern C, Stordal F, Fjaeraa A, Myhre G, Jónasson K, et al. Cosmic rays, cloud condensation nuclei and clouds—A reassessment using MODIS data. Atmos Chem Phys. (2008) 8:7373–87. doi: 10.5194/acp-8-7373-2008
26. Okike O, Umahi AE. Cosmic ray—global lightning causality. J Atmos Solar Terrestrial Phys. (2019) 189:35–43. doi: 10.1016/j.jastp.2019.04.002
27. Holzworth RH, McCarthy MP, Brundell JB, Jacobson AR, Rodger CJ. Global distribution of superbolts. J Geophys Res Atmos. (2019) 124:9996–10005. doi: 10.1029/2019JD030975
28. Dowden RL, Brundell JB, Rodger CJ. VLF lightning location by time of group arrival (TOGA) at multiple sites. J Atmos Solar Terrestrial Phys. (2002) 64:817–30. doi: 10.1016/S1364-6826(02)00085-8
29. Mialdea-Flor I, Segura-Garcia J, Felici-Castell S, Garcia-Pineda M, Alcaraz-Calero MJ, Navarro-Camba E. Development of a low-cost iot system for lightning strike detection and location. Electronics. (2019) 8:1512. doi: 10.3390/electronics8121512
30. Rodger C, Werner S, Brundell J, Lay E, Thomson N, Holzworth R, et al. Detection efficiency of the VLF World-Wide Lightning Location Network (WWLLN): initial case study. Annal Geophys. (2006) 24:3197–214. doi: 10.5194/angeo-24-3197-2006
Keywords: lightning incidence, ground level enhancement (GLE), solar energetic particle (SEP), cosmic ray, short-term, latitude effects
Citation: Wu Q, Li H and Wang C (2020) Short-Term Lightning Response to Ground Level Enhancements. Front. Phys. 8:348. doi: 10.3389/fphy.2020.00348
Received: 10 May 2020; Accepted: 23 July 2020;
Published: 04 September 2020.
Edited by:
Ioannis A. Daglis, National and Kapodistrian University of Athens, GreeceReviewed by:
Athanasios Papaioannou, National Observatory of Athens, GreeceIlya Usoskin, University of Oulu, Finland
Konstantinos Kourtidis, Democritus University of Thrace, Greece
Copyright © 2020 Wu, Li and Wang. This is an open-access article distributed under the terms of the Creative Commons Attribution License (CC BY). The use, distribution or reproduction in other forums is permitted, provided the original author(s) and the copyright owner(s) are credited and that the original publication in this journal is cited, in accordance with accepted academic practice. No use, distribution or reproduction is permitted which does not comply with these terms.
*Correspondence: Hui Li, aGxpQHNwYWNld2VhdGhlci5hYy5jbg==
 Qiong Wu1,2