- 1Guangdong Provincial Key Laboratory of Optical Information Materials and Technology & Institute of Electronic Paper Displays, South China Academy of Advanced Optoelectronics, South China Normal University, Guangzhou, China
- 2National Center for International Research on Green Optoelectronics, South China Normal University, Guangzhou, China
In recent years, more and more traffic accidents have been caused by the illegal use of high beams. Therefore, the distinguishing of the vehicle headlight is vital for night driving and traffic supervision. Then, a method for distinguishing vehicle headlight based on data access of a thermal camera was proposed in this paper. There are two steps in this method. The first step is thermal image dynamic adjustment. In thermal image dynamic adjustment, the details of thermal images were enhanced by adjusting the temperature display dynamically and fusing features of multi-sequence images. The second step is vehicle headlight dynamic distinguishing, and features of vehicle headlight were extracted by YOLOv3. Then, the high beam and low beam were further distinguished by the filter based on the position and proportion relationship between the halo and the beam size of vehicle headlights. In addition, the accessed thermal image dataset during the night was used for training purposes. The results showed that the precision of this method was 94.2%, and the recall was 78.7% at a real-time speed of 9 frames per second (FPS). Compared with YOLOv3 on the Red Green Blue (RGB) image, the precision was further improved by 11.1%, and the recall was further improved by 5.1%. Dynamic adjustment and distinguishing method were also applied in single-shot multibox detector (SSD) network which has good performance in small-object detection. Compared with the SSD network on the RGB image, the precision was improved by 8.2% and the recall was improved by 4.6% when SSD network was improved by this method.
Introduction
In recent years, traffic accidents have become a common problem for vehicle drivers. The risk of traffic accidents on an unlit road is about 1.5–2 times higher than that during the day [1]. Due to the complexity of the road and the negligence of drivers, the high and low beam of the vehicle cannot be switched correctly in time, which can lead to a series of traffic accidents. In addition, oncoming headlight glare can reduce the visibility of objects on the road, which may have a bad effect on safety at night. For cataracts, the impact of oncoming headlight glare is more severe [2]. So, it is necessary to realize the vehicle headlights distinguishing.
Currently, vehicle detection is mostly based on visual images [3–10]. The visual image is not clear at night, and the detail of the vehicle is also unclear. In order to overcome the problem, a number of papers have been published to detect vehicles at night by identifying the shape and track of the headlights [3–10]. Many studies were both detecting vehicles via headlights pairing and trajectories matching [3, 4]. For extracting the nighttime image details, image enhancement was used for preprocessing before vehicle detection [5, 6]. Given that the headlights were usually white in color, the inputted images were usually transformed into different color spaces. The dominant color components in Red Green Blue (RGB) images were then processed by the threshold to extract blobs for the headlight [7]. However, this nighttime vehicle detection method depended on clear headlights or taillights shape [5, 8–10], and the existence of high beams glares was ignored. When the vehicle headlight was captured by a camera, it could produce a halo, which would affect the judgment and measurement of the vehicle headlight. The minuscule vehicle details can be retained in a dim environment by the thermal image. Simultaneously, the temperature of vehicles can be collected by thermal cameras. So, it could not be interference by the halo. Thermal imaging technology has been used for vehicle detection at night [11]. The temperature difference between the object and the ambient is insignificant, and it is impossible to separate the object from the environment. Moreover, the value of the temperature was conversed to a pseudo-color image, it can increase the difficulty for object detection. The adaptive histogram equalization method was used to enhance the counters of images [11]. However, when the image content was enhanced, the background information was also continuously enhanced, which can increase the difficulty of recognition. In addition, the thermal image was affected by the resolution, so that the details of distant objects cannot be captured. In object detection, machine learning and deep learning have been applied to various research fields. The unsupervised learning was applied for the classification of vehicles successfully [12, 13]. Furthermore, Convolutional Neural Networks (CNNs), YOLO [14], and other neural networks have made outstanding contributions to vehicle detection in both RGB images and thermal images [11, 15, 16]. However, more relevant optimization and adjustment are needed to obtain a more suitable training model. Recent work showed that multi-sequence images and deep neural networks can match the vehicle types [17]. The deep neural network YOLOv3 has a good detection effect on the COCO data set [18, 19]. But the detection model needs to be further improved to achieve distinguishing similar objects.
In this paper, a vehicle headlight distinguishing method based on the thermal image dynamic adjustment and dynamic distinguishing was proposed. The thermal image enhancement and multi-sequence image feature fusion were contained by the thermal image dynamic adjustment. The YOLOv3-Filter operation was applied as the thermal image dynamic distinguishing. The target can be separated effectively by the thermal image enhancement from the environment. Simultaneously, the details of the thermal image were supplemented by multi-sequence image feature fusion. Lastly, the vehicle headlight distinction model was realized by the YOLOv3-Filter operation.
Principle
Thermal Image Dynamic Adjustment
Thermal Image Enhancement
In the case of low illumination at night, the vehicle characteristics can be disturbed by the halo of the headlights, so that the camera cannot capture the contour of a vehicle. The thermal camera cannot be disturbed by such a high light source because the thermal imaging map generates a visual image by acquiring the temperature of the object. In addition, thermal imaging technology has many disadvantages. The color difference between the color of the object and the environment is not obvious. The thermal camera can also be affected by the external environment [20], such as sky radiation, ground background radiation, radiation reflections, temperature changes, wind speed, and geographic latitude. In order to reduce these interferences of headlight distinguishing, the thermal image enhancement was used in this paper.
As shown in Figure 1B, the thermal histogram shows that the temperature of the vehicle and the ambient temperature can be changed within a certain interval. The data set used in this paper was captured by us at 25°C, and the relative humidity was 55%. The maximum vehicle temperature in the data set was 125°C. The object at −20 to 25°C and 125–400°C does not need to be displayed in thermal images. As shown in Figure 2, the color scale range is 0–255; it allows as many objects as possible to be displayed in this interval.
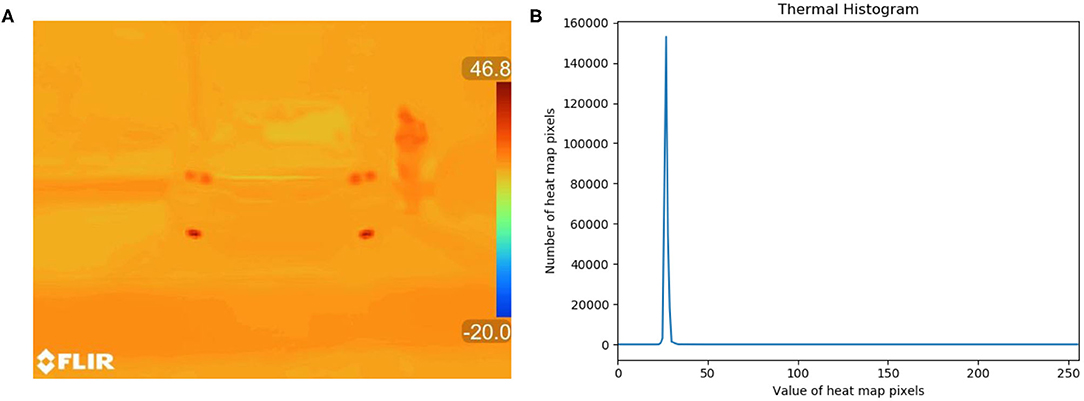
Figure 1. Thermal image and thermal histogram. (A) An original thermal image captured by a thermal camera. (B) Thermal histogram of the original thermal image. The thermal histogram represents the distribution of the pixel values in the thermal diagram.

Figure 2. Color scale of the thermal image. The temperature of an object was displayed with the corresponding color in the thermal image.
To extract the object information, the thermal image dynamic adjustment method has been adopted. Firstly, the ambient temperature information is obtained from the thermal camera. Secondly, the ambient temperature is subtracted from each temperature pixel value in a thermal image to obtain an object which is different from the ambient temperature. Finally, the image is multiplied with the device parameters. The pixel value of the thermal image is defined as Equation (1).
In Equation (1), λ is the device parameters, and it can be calculated through Equation (2).
where T(x0, y0)max is the maximum temperature value on a thermal map. TMAX is the maximum acceptable temperature value of the thermal image sensor. The object temperature is first subtracted from the ambient temperature value to obtain an object, which is different from the ambient temperature. T(x0, y0) is a temperature pixel value, and Tenvironment is an ambient temperature in Equation (2). Then, the temperature difference can be multiplied by an appropriate ratio λ, and the characteristics of the object can be obtained obviously.
Multi-Sequence Image Feature Fusion
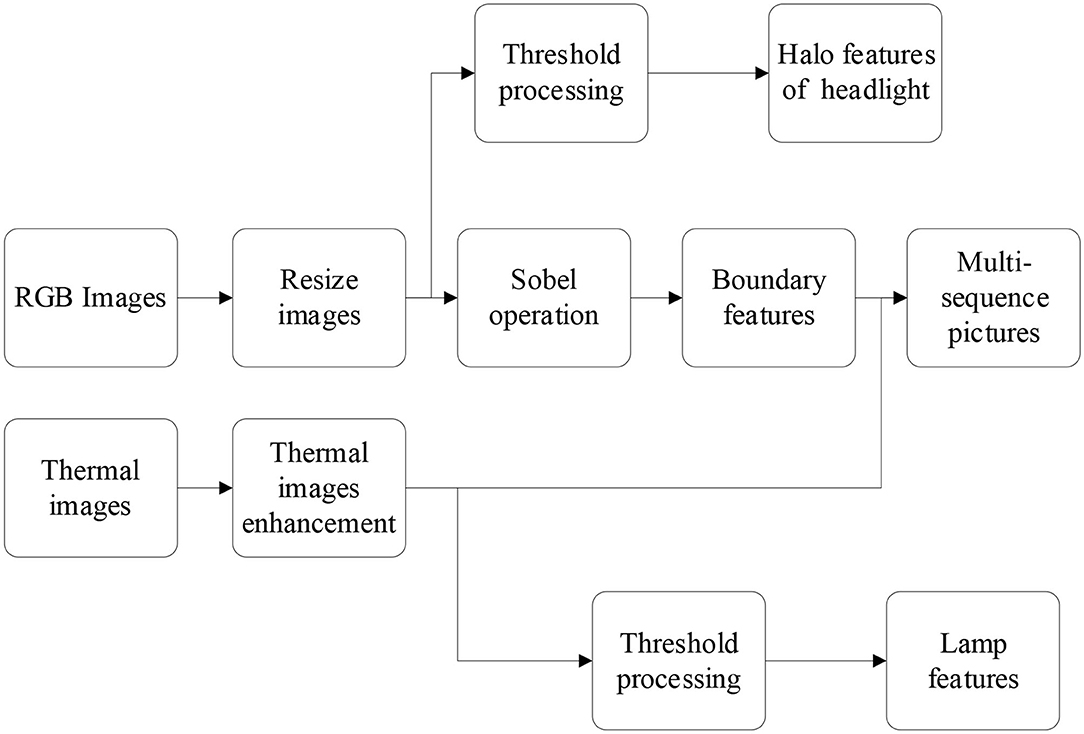
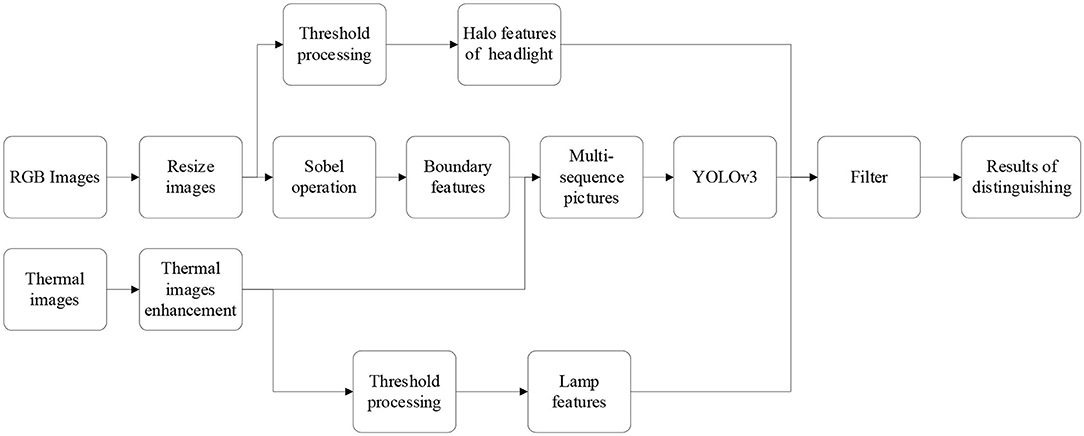
After thermal image enhancement, the next step is to fuse the thermal image with the RGB image. As shown in Figure 3, the RGB image extracted from the original image data is reduced to the same size as the thermal image with a resolution of 640 × 480. In this paper, the contour features of vehicle headlight can be extracted by the Sobel operator, as shown in Equation (3). Because it can obtain the edge of target which has a great gradient with background, the Sobel operator on a preprocessed image in order to retrieve an edge image is used to find and extract a rectangular area in the original image which represents the license plate [21, 22].
In a horizontal variation, the image value I is convolved with an odd-sized kernel Gx. In the vertical variation, the image value I is convolved with an odd-sized kernel Gy.
Finally, the contour features of a vehicle and vehicle headlight, which are extracted from the RGB image, are fused with the thermal image. Then, a multi-sequence image can be obtained. The multi-sequence image not only has the information about the thermal image but also the contour information of the RGB image.
In addition, the halo areas of vehicle headlight SLight in the RGB image can be obtained after threshold processing [22]. In the same way, the areas of the lamp in the image SLamp can be obtained. These parameters are used in Equation (9).
Vehicle Headlight Dynamic Distinguishing
In order to realize the distinguishing between high and low beam lights, the following steps must be done. Firstly, the YOLOv3 is used to initially identify the candidate areas of a vehicle and its headlights. Secondly, the distance between the vehicle and the camera can be determined by the size of the bounding box. Then, the halo and the contour of the headlight are extracted from the RGB image and the thermal image, respectively. Finally, the distance between the high and low headlights can be determined by calculating the relationship between the halo and the headlight profile.
Deep Network Model for Beam Detection
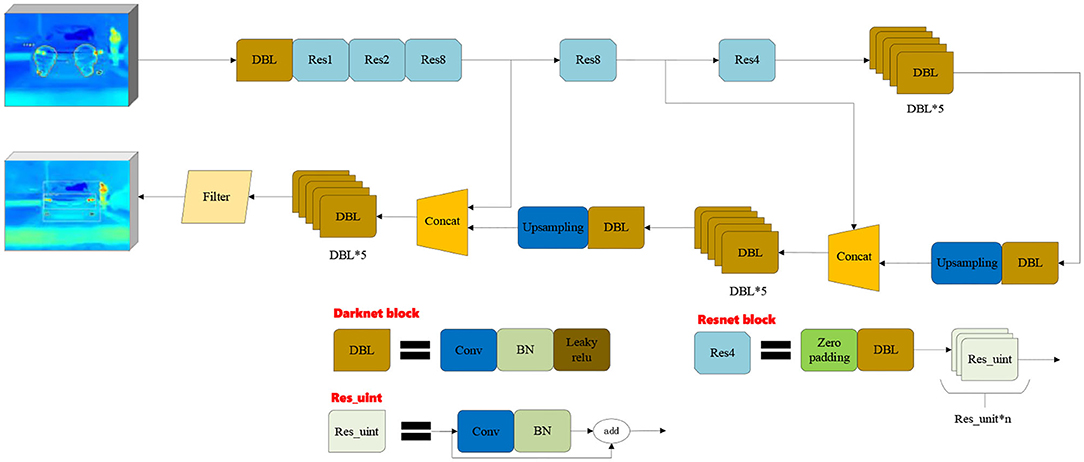
The deep neural network YOLOv3 is used as a preliminary screening model, as shown in Figure 4. The coordinate of the vehicle in the image is chosen as input data. Then, a likelihood score of the candidate about the high beam and low beam is outputted by the model. The network contains 23 residual blocks and three times up-sampling. The model is detected at 32x, 16x, and 8x subsampled which can be used to make multi-scale measurements. Leaky Relu, which gives all negative values, can be used as an activation function for all residual blocks. The total number of parameters of the network is about 110,536.
Low Probability Candidate Filter
The accuracy of vehicle light distinguishing can be obtained by adding discriminant conditions to the YOLOv3. The low probability candidate filter is used as a discriminant condition filter in this paper.
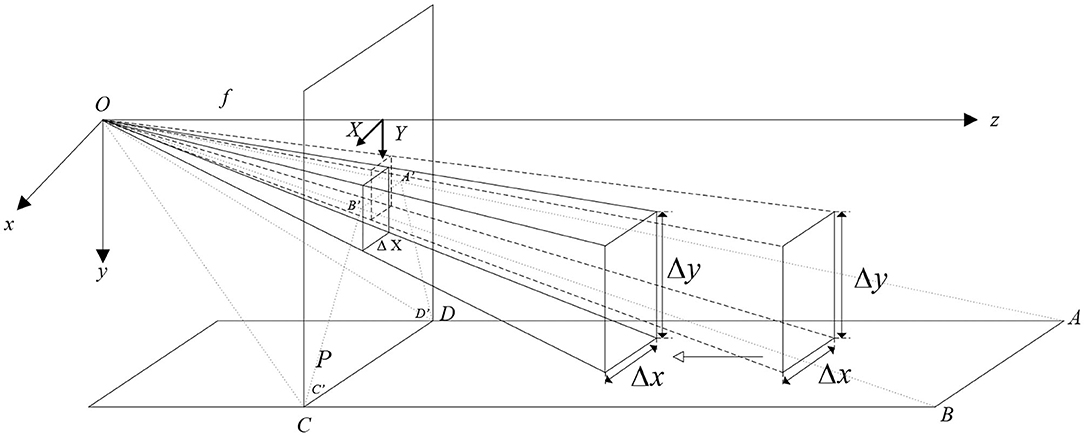
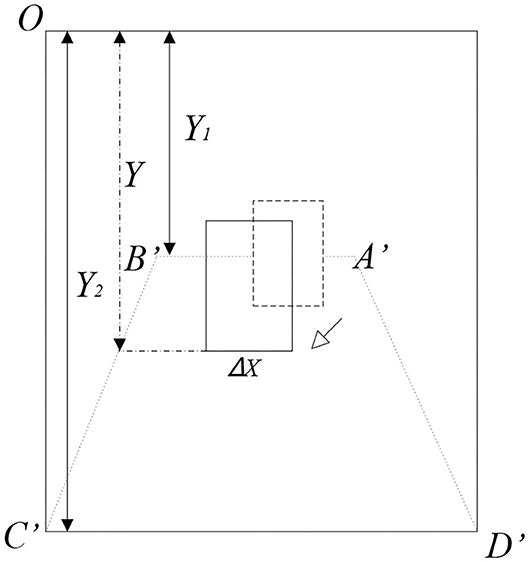
In order to design the low probability candidate filter, the conversion relationship between the image and the three-dimensional (3D) space is required to be found. The pinhole imaging model can be used to obtain the actual location of the object in the image. As shown in Figure 5, the target size is converted to the actual target size in the image. A'B' is the straight line of road AB mapped to the image at Y. In the same way, C'D' is the straight line of road CD mapped to the image at Y. The relationship between the actual distance of the road and the pixel width of the road in the image can be written as Equation (6).
where DAB and DCD are the actual distances of the road. and are the pixel widths of the road in the image. Therefore, we can obtain Equation (8).
As shown in Figure 6, Y1 and Y2 are the vertical distances of the road mapped on the image. In Equation (6), DPicRoad(Y) is the length of the road displayed on the image from the origin O to the height Y. In Equation (7), ΔX is the width of the target object on the image. Δx is the width of the actual target. The actual halo size of vehicle headlights and vehicle beams can be gotten by this method.
The Zhang's calibration method was used to calibrate the camera for rebuilding a 3D space, as shown in Equation (8) [23].
where u, v are the horizontal and vertical coordinate values in the image coordinate system; Zc is the distance from the camera surface to the object along the optical axis. dx, dy are the horizontal and vertical dimensions of the pixel. u0 and v0 are the center positions of the image plane. f is the camera focal length. R is the rotation matrix of the calibration object. t is the translation matrix. Xw, Yw, and Zw are the positions of the feature points in the world coordinate system. According to Equation (6), the distance D can be obtained between the vehicle and the camera. ΔX is the width of the target object in the image. Δx is the width of the actual target. ΔY is the height of the target object in the image. Δy is the height of the actual target.
According to Equation (8), the distance D can be obtained between the vehicle and the camera. The high beam of the vehicle can be defined by looking for the relationship among SLight, SLamp, and D. The halo area of vehicle headlight SLight and the area of the lamp SLamp can be obtained by threshold processing.
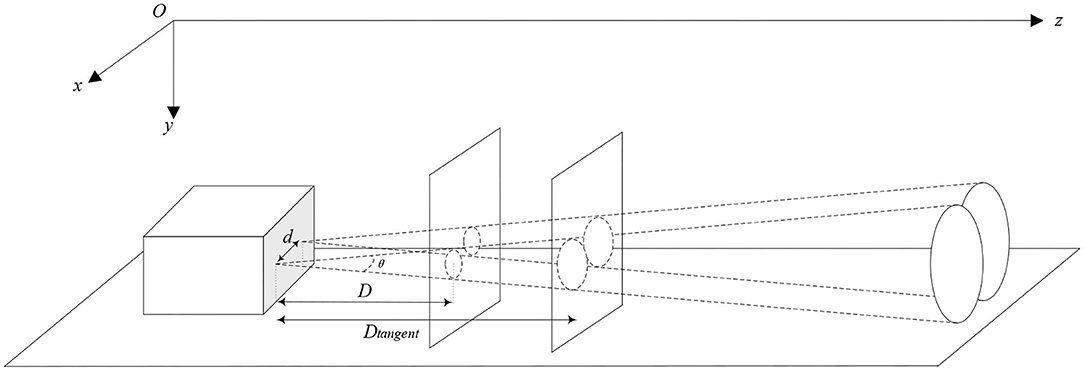
As shown in Figures 7, 8, two halos of the headlights are just distinguished when the vehicle is in Dtangent position. If the distance between the vehicle and the camera is less than Dtangent, the halo of the headlights is separated. If the distance between the vehicle and camera is greater than Dtangent, the halo of the vehicle headlights is in a coincident state. Therefore, two situations can be classified and then discussed. The discrimination conditions of the low and high beams satisfy the following relationship in Equation (9).
where D is the real distance between the camera and the vehicle. δ is the ratio between SLight and SLamp when D is in [0, Dtangent]. δ' is the ratio between SLight and SLamp when D is over Dtangent. ΔEc is a calculation error. ΔEm is a measurement error. LowBeam and HighBeam can be output as the Result. Dtangent is the distance between the camera and the vehicle when two halos of headlights are just distinguished. According to the pinhole imaging and theorem about similar triangle, it can be calculated by Equation (10).
where θ is the headlight angle, and d is the actual distance of the headlight.
According to the theorem about similar triangle, Equation (11) can be obtained.
where LDE and RRealLamp are the actual radius width lamp in Figure 7A. LGH and RRealLight are the actual radius width halo. LAE and DRealLamp are the distance between headlight focus and lamp. LAH and DRealLight are the distance between headlight focus and halo.

Figure 7. Schematic diagram of the high beam. (A) A schematic diagram of cross section about the high beam. (B) A schematic diagram of the vertical section about the high beam when the two halos are intersected.
Combining Equations (11)–(13), then δ can be obtained as Equation (14).
Two halos of the headlights are intersected when the distance between the vehicle and the camera is greater than Dtangent. The vehicle headlight halo area SRealLight is expressed by Equation (15).
where α is ∠JI′Kin Figure 7B. SIntersect is the intersect area of two halos.
Combining Equations (15) and (16), the vehicle headlight halo area SRealLight can be obtained as Equation (17).
where δ' is the ratio between SLight and SLamp, it can be gotten when the distance between the vehicle and camera is greater than Dtangent.
Testing Method
For the vehicle headlight distinguishing, an Intersection Over Union (IOU) score of more than 50% is considered a correct detection. Our evaluation method is F-Score (β = 1) which is defined as Equations (16)–(18) [24]:
where TP is the true-positive. FP is the false-positive. FN is the false-negative.
Results and Discussion
Dataset and Experimental Platform
For training and testing purposes, the data were accessed from thermal cameras in the urban nighttime road. It is meaningful for supervise whether headlight is used legally by drivers. The thermal stream and RGB stream were both obtained from FLIR ONE PRO camera with 160 × 120 thermal resolution and 1,440 × 1,080 RGB resolution in an 8.7-Hz frame rate. The scene dynamic range is −20 to 400°C. The spectral range of the thermal sensor is about 8–14 μm, and thermal sensitivity (NETD) is 70 mK. The visual resolution, which is 640 × 480 with an iron color scale, was obtained.
In this paper, a computer platform was used for training the deep neural network model and testing. The deep neural network model training was performed by using Slim with TensorFlow v1.13 as the backend on a desktop equipped with 16 GB RAM. The computation was accelerated by using an NVIDIA RTX2080Ti GPU with 12 GB memory. The network was trained for 150,000 iterations with a batch size of 8. The optimizer algorithm was “Adam” with a learning rate of 0.001 and a learning rate decay factor of 0.94. In order to avoid over-fitting, local data augmentation was performed through a 2D rotation, translation, and random left-to-right or up-to-down flipping. The ranges of the rotation were [−45°, 45°] and [−180°, 180°]. After transforming and resizing, the training samples were cropped to 640 × 480 × 3 and were inputted in the deep neural network model.
Performance Testing
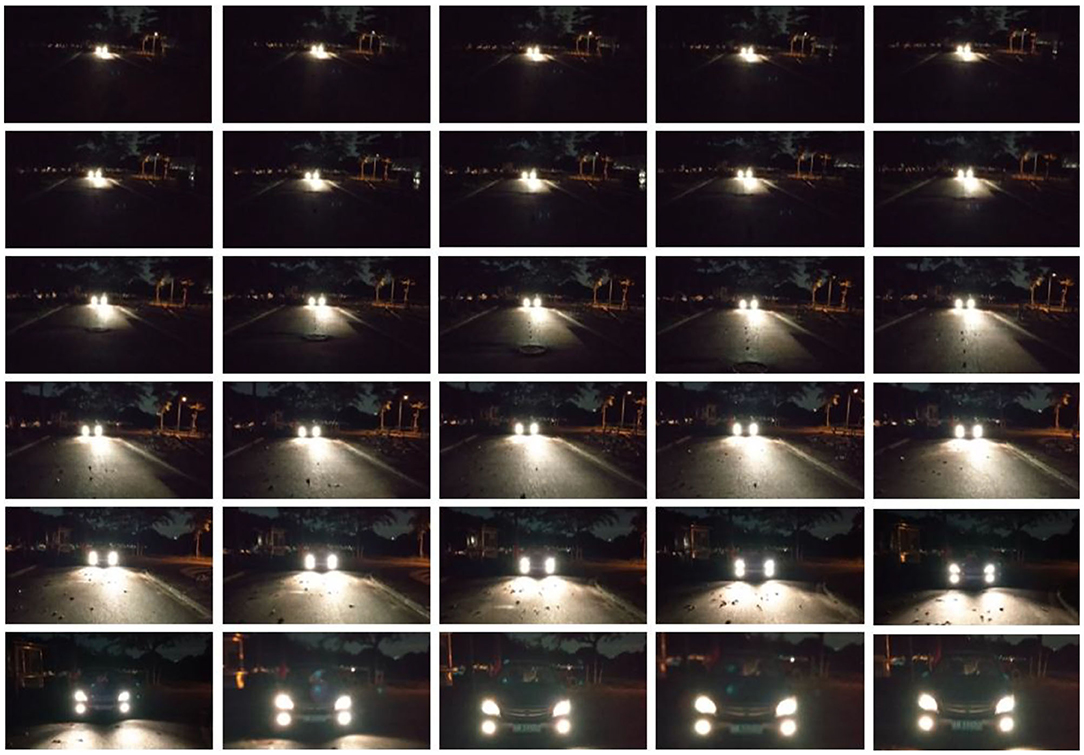
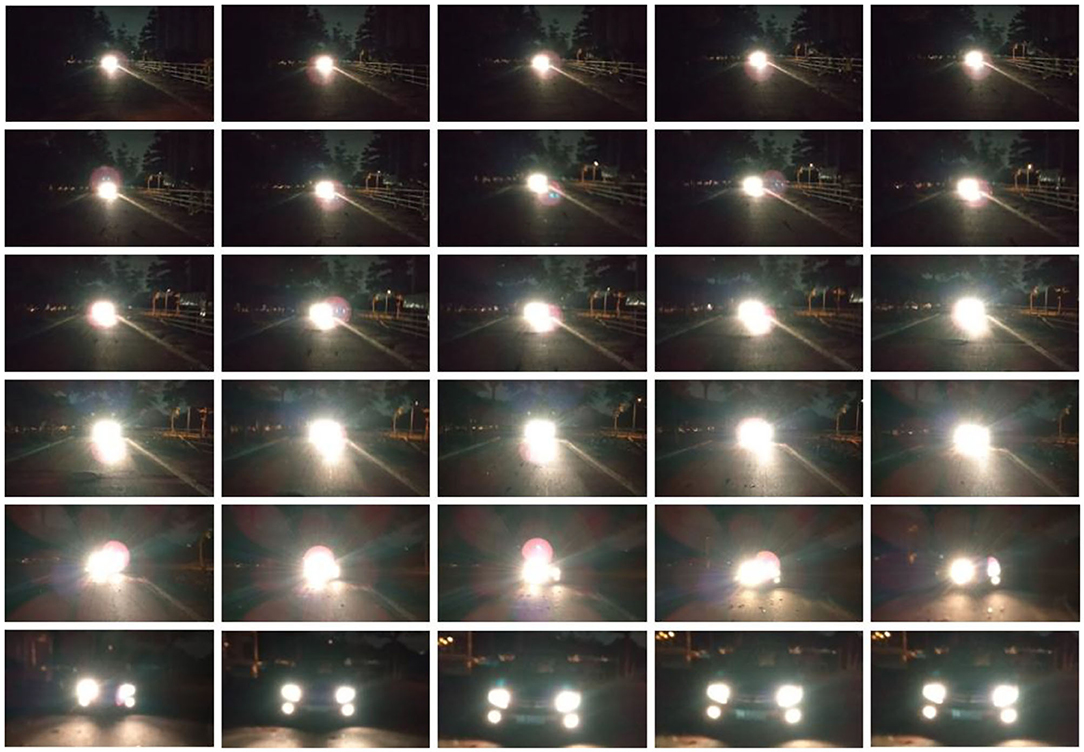
For designing the low probability candidate filter, the relationship between the halo of vehicle headlight and vehicle lamp was analyzed. In Figures 9, 10, images were intercepted from the 30-frame live shooting video and intercepted every five frames. As shown in Figure 9, when the vehicle headlight dynamically changes from far to near on the RGB image, the halo of the low beam remains clear. As a result, the area of the lamps can be obtained easily. Compared with low beam light, it was more difficult to distinguish the vehicle and its headlight in Figure 10 than in Figure 9, because the halo of the high beam was always in a fusion state in the RGB image. Because the halo of the high beam was always in a fusion state in the RGB image. When the distance between the vehicle and the camera is close enough, the shape of the vehicle headlight can be distinguished easily. Therefore, the low probability candidate filter was designed based on the distance among the vehicle, camera, area of lamp, and headlight.
In order to realize vehicle headlight distinguishing, the dynamic adjustment and distinguishing method for vehicle headlight were designed as shown in Figure 11. This method had two parts: thermal image dynamic adjustment and vehicle headlight dynamic distinguishing.
The thermal image enhancement plays an important part in dynamic adjusting. The object detection can be interfered by the ambient temperature and the target object temperature which were displayed in thermal images. After thermal image enhancement, the value of the thermal image was adjusted to a suitable range on the thermal histogram, as shown in Figure 12B. Compared with Figure 1A, the lights in the thermal image after dynamic adjustment are more prominent, as shown in Figure 12A. By using the method of thermal image enhancement, not only the interference features on the image were eliminated but also the target features were enhanced.
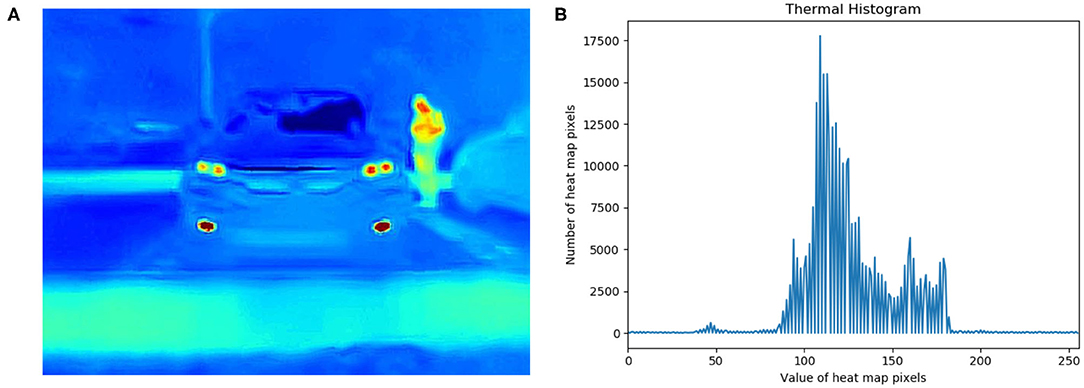
Figure 12. Thermal histogram and thermal image after dynamic adjustment. (A) Thermal image after dynamic adjustment. (B) Thermal histogram after dynamic transformation.
After thermal image enhancement, the next step was the thermal image feature fusion. The halo contour features of vehicle headlight were extracted by the Sobel operation, as shown in Figure 13B. The contour features of the vehicle headlight extracted from the RGB image (Figure 13A) were fused with the thermal image (Figure 13C). As shown in Figure 13D, this figure not only has the information about the thermal image but also the contour information of the RGB image. Furthermore, contour information of the object was strengthened in the thermal image.
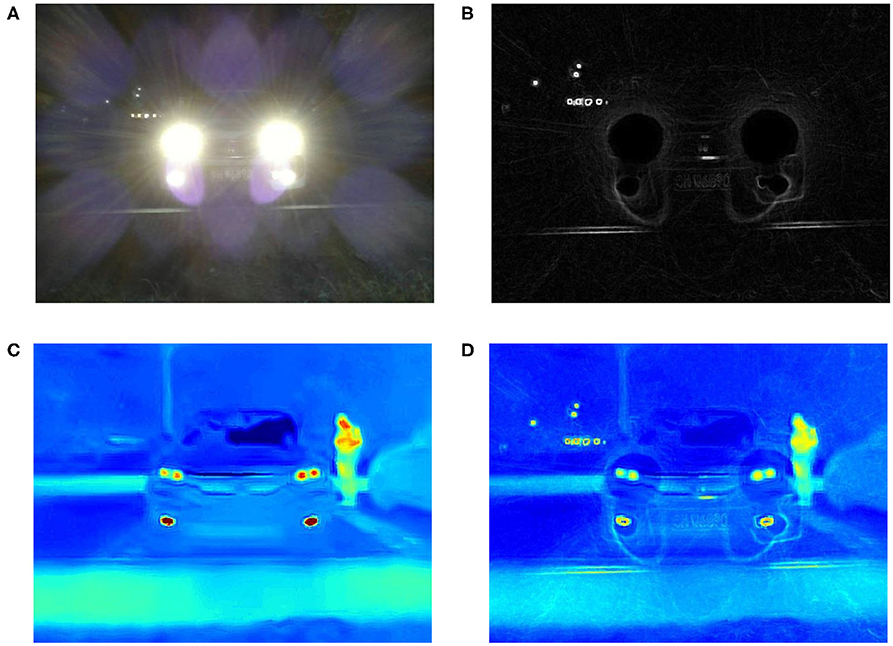
Figure 13. Vehicle headlight feature extraction and fusion. (A) The Red Green Blue (RGB) image extracted from the original thermal image. (B) The RGB image after Sobel operation. (C) The thermal image extracted from the original thermal image. (D) A feature map synthesized by a thermal image and an RGB map.
Then, the areas of headlight halo and lamp were extracted by the threshold processing for designing the low probability candidate filter. As shown in Figure 14A, the people next to the vehicle and other interference were filtered, and only the halo of the vehicle headlight and pixels similar to the vehicle beam can be obtained. As shown in Figure 14B, the position information of the vehicle and the headlight on the image is obtained by the preliminary distinguishing of the deep neural network model, and then the contour of the lamp in the thermal image was extracted by the fixed threshold processing, and the contour of the headlight halo was extracted from the RGB image. The extracted contour was retained when it was within the vehicle candidate box; otherwise, it was discarded. Therefore, we can get the headlight features in Figure 14B.
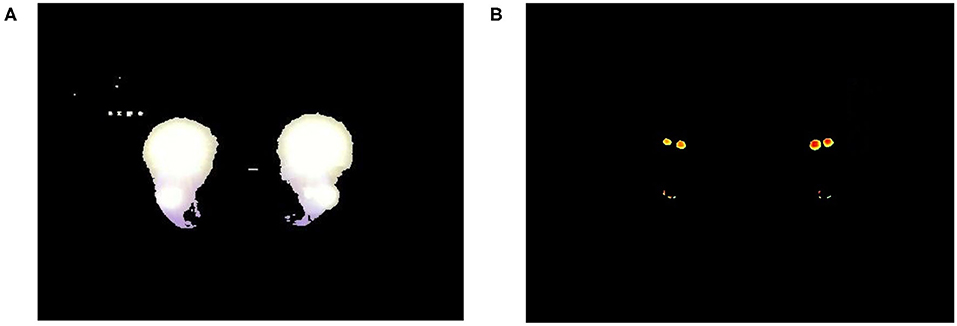
Figure 14. Results of threshold processing. (A) A Red Green Blue (RGB) image after threshold processing. (B) A thermal image after threshold processing.
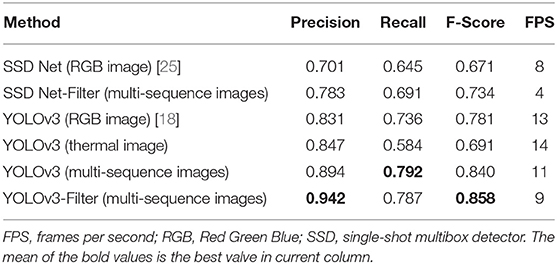
After testing, not only had this method made an achievement of distinguishing between high beam and low beam, but it also overcame the interference caused by halo efficaciously in Figure 15. The precision, recall, and F-Score have been improved effectively by our methods. As shown in Table 1, we found that the recall rate on the RGB image was 15.2% which was higher than that on the thermal image. The reason is that the resolution of the thermal image was low, and it was impossible to separate the high beam headlight from the low beam headlight.

Figure 15. Results of distinguishing. (A) A Red Green Blue (RGB) original image. (B) A result image with distinguishing.
For the training image data, the recall and the precision of the YOLOv3 on multi-sequence images obtained by dynamic adjustment were 5.6 and 6.3% higher than the RGB image, respectively. The precision and the recall were both increased effectively by using the dynamic adjustment on the thermal image. The halo of headlight information was retained by the multi-sequence images. Moreover, the contour information of distant vehicles and the contour of the vehicle beam can be obtained from the thermal image. For the performance of training models, the precision of the model with adding the filter (YOLOv3-Filter) was improved by 4.8% effectively, and F-Score of YOLOv3-Filter was increased by 1.8%, compared with YOLOv3 on multi-sequence images. In this situation, the filter played a decisive role in the model.
Finally, the dynamic adjustment and distinguishing method have been tested. For the method performance, YOLOv3-Filter (Multi-sequence images) is the best among these three methods. The precision and the recall were increased by 11.1 and 5.1% compared with YOLOv3 on the RGB image, respectively. Our method has been tested based on single-shot multibox detector (SSD) network which has good performance in small-object detection [25]. After improved, the precision and the recall were increased by 8.2 and 4.6% compared with SSD network on the RGB image, respectively. The data show that the method of this paper has greatly improved the ability of vehicle headlight distinguishing.
In order to confirm the feasibility of using the YOLOv3-Filter method in real-time applications, we carried out comparative experiments on different networks. The single forward inference time for the YOLOv3-Filter (Multi-sequence images) method is 111 ms, which is 34 ms longer than that of the YOLOv3 (RGB image). The main reason for the slightly decreased speed is a complex filter structure and thermal image dynamic adjustment used in the YOLOv3-Filter. Our method shows a big advantage over the SSD network in the performance of detection with a similar term of the operation speed. Overall, YOLOv3-Filter (Multi-sequence images) method does not compromise on the operation time while considerably improving the detection accuracy.
However, there were many factors that lead to low recall in a series of testing methods. Firstly, due to the low resolution of the thermal imager, the thermal image was distorted after being amplified to a certain extent, and the entire contour cannot be effectively restored. Therefore, the information obtained by the thermal imager was inaccurate. Secondly, there were various types of vehicles, and the size of the vehicle is determined by the type of vehicle. As a result, this method has certain errors because of the uncertain size of vehicles. It was necessary to establish a complete database of vehicle types and sizes to solve this problem. Finally, the calculation error ΔEc was only effective when the camera and the vehicle were in the same straight line. When the deviation angle of the vehicle and the camera can be changed, ΔEc would also be changed. Digital cameras are projected on a complex system of lens and sensor array susceptible to a variety of undesirable effects. The main effects can be described considering the exposure triangle: aperture, shutter speed, and sensitivity (ISO) [26]. The size of the halo can also be affected by exposure settings of the RGB camera. As the exposure time, aperture, and ISO decreases, the area of the headlight halo captured by the camera decreases. The measurement error ΔEm can correct for this effect. In this paper, these parameters of the camera have been set before leaving the factory.
Conclusion
A vehicle headlight dynamic adjustment and distinguishing method based on data access of a thermal camera was proposed in this paper. Thermal image enhancement and multi-sequence image feature fusion were used as the dynamic adjusting for extracting object features clearly, and the YOLOv3 with adding a filter (YOLOv3-Filter) was used for the dynamic distinguishing. The features between high beam and low beam can be distinguished easily by the filter. So, the proposed dynamic adjustment and distinguishing method not only can enhance the thermal image but also can realize an accurate distinguishing of the high beam and low beam, which provides an effective method for distinguishing the vehicle headlight in night driving and traffic supervision.
Data Availability Statement
The data analyzed in this study was subject to the following licenses/restrictions: the thermal stream and RGB stream were both obtained from FLIR ONE PRO. The data set used in this paper was captured by us at 25°C and the relative humidity was 55%. Requests to access these datasets should be directed to bGlzaGl4aWFvMDcyN0BvdXRsb29rLmNvbQ==.
Author Contributions
SL: work concept and design and draft paper. YQ: data collection. PB: make important modifications to the paper and approve the final paper to be published. All authors contributed to the article and approved the submitted version.
Funding
This study was funded by the Project of Zhongshan Innovative Research Team Program (No. 180809162197886), Special Fund for Guangdong University of Science and Technology Innovation Cultivation (No. pdjh2019b0135), Science and Technology Program of Guangzhou (No. 2019050001), Program for Guangdong Innovative and Enterpreneurial Teams (No. 2019BT02C241), Program for Chang Jiang Scholars and Innovative Research Teams in Universities (No. IRT17R40), Guangdong Provincial Key Laboratory of Optical Information Materials and Technology (No. 2017B030301007), and MOE International Laboratory for Optical Information Technologies and the 111 Project.
Conflict of Interest
The authors declare that the research was conducted in the absence of any commercial or financial relationships that could be construed as a potential conflict of interest.
References
1. Zahran ESMM, Tan SJ, Yap YH, Tan EH, Pena CMF, Yee HF, et al. An investigation into the impact of alternate road lighting on road traffic accident hotspots using spatial analysis. In: 2019 4th International Conference on Intelligent Transportation Engineering (ICITE). Singapore: IEEE (2019). doi: 10.1109/ICITE.2019.8880263
2. Hwang AD, Tuccar-Burak M, Goldstein R, Peli E. Impact of oncoming headlight glare with cataracts: a pilot study. Front Psychol. (2018) 9:164. doi: 10.3389/fpsyg.2018.00164
3. Zou Q, Ling H, Pang Y, Huang Y, Tian M. Joint headlight pairing and vehicle tracking by weighted set packing in nighttime traffic videos. IEEE Trans Intell Transport Syst. (2018) 19:1950–61. doi: 10.1109/TITS.2017.2745683
4. Dai X, Liu D, Yang L, Liu Y. Research on headlight technology of night vehicle intelligent detection based on hough transform. In: 2019 International Conference on Intelligent Transportation, Big Data and Smart City (ICITBS). Changsha: IEEE (2019). p. 49–52. doi: 10.1109/ICITBS.2019.00021
5. Kuang H, Yang KF, Chen L, Li YJ, Chan LLH, Yan H. Bayes saliency-based object proposal generator for nighttime traffic images. IEEE Trans Intell Transport Syst. (2018) 19:814–25. doi: 10.1109/TITS.2017.2702665
6. Lin CT, Huang SW, Wu YY, Lai SH. GAN-based day-to-night image style transfer for nighttime vehicle detection. IEEE Trans Intell Transport Syst. (2020) 99: 1–13. doi: 10.1109/tits.2019.2961679
7. Yi ZC, Chen ZB, Peng B, Li SX, Bai PF, Shui LL, et al. Vehicle lighting recognition system based on erosion algorithm and effective area separation in 5g vehicular communication networks. IEEE Access. (2019) 7:111074–83. doi: 10.1109/access.2019.2927731
8. Wu JT, Lee JD, Chien JC, Hsieh CH. Nighttime vehicle detection at close range using vehicle lamps information. In: 2014 International Symposium on Computer, Consumer and Control (IS3C). Vol. 2. Taichung: IEEE (2014). p. 1237–40. doi: 10.1109/IS3C.2014.320
9. Pradeep CS, Ramanathan R. An improved technique for night-time vehicle detection. In: 2018 International Conference on Advances in Computing, Communications and Informatics (ICACCI). Bangalore: IEEE (2018). p. 508–13. doi: 10.1109/ICACCI.2018.8554712
10. Chen XZ, Liao KK, Chen YL, Yu CW, Wang C. A vision-based nighttime surrounding vehicle detection system. In: 2018 7th International Symposium on Next-Generation Electronics (ISNE). Taipei: IEEE (2018). p. 1–3. doi: 10.1109/ISNE.2018.8394717
11. Chang CW, Srinivasan K, Chen YY, Cheng WH, Hua KL. Vehicle detection in thermal images using deep neural network. In: 2018 IEEE International Conference on Visual Communications and Image Processing (VCIP). IEEE (2018). p. 7–10. doi: 10.1109/VCIP.2018.8698741
12. Satzoda RK, Trivedi MM. Looking at vehicles in the night: detection and dynamics of rear lights. IEEE Trans Intell Transport Syst. (2019) 20:4297–307. doi: 10.1109/TITS.2016.2614545
13. Shan Y, Sawhney HS, Kumar R. Unsupervised learning of discriminative edge measures for vehicle matching between nonoverlapping cameras. IEEE Trans Pattern Anal Mach Intell. (2008) 30:700–11. doi: 10.1109/TPAMI.2007.70728
14. Birogul S, Temur G, Kose U. YOLO object recognition algorithm and “buy-sell decision” model over 2D candlestick charts. IEEE Access. (2020) 8:91894–915. doi: 10.1109/ACCESS.2020.2994282
15. Chien SC, Chang FC, Tsai CC, Chen YY. Intelligent all-day vehicle detection based on decision-level fusion using color and thermal sensors. In: 2018 International Conference on Advanced Robotics and Intelligent Systems (ARIS). Taipei: IEEE (2018). doi: 10.1109/ARIS.2017.8297189
16. Cygert S, Czyzewski A. Style transfer for detecting vehicles with thermal camera. In: 2019 Signal Processing - Algorithms, Architectures, Arrangements, and Applications Conference Proceedings (SPA). Vol. 9. IEEE (2019). p. 218–22. doi: 10.23919/SPA.2019.8936707
17. Zheng Y, Blasch E, Cygert S, Czyzewski A, Sangnoree A, Chamnongthai K, et al. Robust method for analyzing the various speeds of multitudinous vehicles in nighttime traffic based on thermal images. IEEE Trans Intell Transport Syst. (2018) 9871:7–10.
18. Wei X, Wei D, Suo D, Jia L, Li Y. Multi-target defect identification for railway track line based on image processing and improved YOLOv3 model. IEEE Access. (2020) 8:61973–88. doi: 10.1109/ACCESS.2020.2984264
19. Vinyals O, Toshev A, Bengio S, Erhan D. Show and tell: lessons learned from the 2015 MSCOCO image captioning challenge. IEEE Trans Pattern Anal Mach Intell. (2017) 39:652–63. doi: 10.1109/TPAMI.2016.2587640
20. Kargel C. Thermal imaging to measure local temperature rises caused by hand-held mobile phones. In: IEEE Instrumentation and Measurement Technology Conference. Vol. 2. Como: IEEE (2004). p. 1557–62. doi: 10.1109/imtc.2004.1351363
21. Israni S, Jain S. Edge detection of license plate using Sobel operator. In: 2016 International Conference on Electrical, Electronics, and Optimization Techniques (ICEEOT). Chennai: IEEE (2016). p. 3561–3. doi: 10.1109/ICEEOT.2016.7755367
22. Todd J. Digital image processing (second edition). Opt Lasers Eng. (1988) 8:1–71. doi: 10.1016/0143-8166(88)90012-7
23. Zhang Z. A flexible new technique for camera calibration. IEEE Trans Pattern Analy Mach Intell. (2000) 22:1330–4. doi: 10.1109/34.888718
24. Heaton J. Deep learning. In: Goodfellow I, Bengio Y, Courville A, editors. Genetic Programming and Evolvable Machines. Massachusetts: MIT press (2018). p. 424–5. doi: 10.1007/s10710-017-9314-z
25. Qu J, Su C, Zhang Z, Razi A. Dilated convolution and feature fusion SSD network for small object detection in remote sensing images. IEEE Access. (2020) 8:82832–43. doi: 10.1109/ACCESS.2020.2991439
26. Steffens CR, Drews-jr PLJ, Botelho SS, Grande R. Deep learning based exposure correction for image exposure correction with application in computer vision for robotics. In: 2018 Latin American Robotic Symposium, 2018 Brazilian Symposium on Robotics (SBR) and 2018 Workshop on Robotics in Education (WRE). Joao Pessoa: IEEE (2018). doi: 10.1109/LARS/SBR/WRE.2018.00043
Keywords: dynamic distinguishing, dynamic adjustment, vehicle headlight, thermal images, multi-sequence images
Citation: Li S, Bai P and Qin Y (2020) Dynamic Adjustment and Distinguishing Method for Vehicle Headlight Based on Data Access of a Thermal Camera. Front. Phys. 8:354. doi: 10.3389/fphy.2020.00354
Received: 23 June 2020; Accepted: 27 July 2020;
Published: 10 September 2020.
Edited by:
Chongfu Zhang, University of Electronic Science and Technology of China, ChinaCopyright © 2020 Li, Bai and Qin. This is an open-access article distributed under the terms of the Creative Commons Attribution License (CC BY). The use, distribution or reproduction in other forums is permitted, provided the original author(s) and the copyright owner(s) are credited and that the original publication in this journal is cited, in accordance with accepted academic practice. No use, distribution or reproduction is permitted which does not comply with these terms.
*Correspondence: Pengfei Bai, YmFpcGZAbS5zY251LmVkdS5jbg==
 Shixiao Li
 Pengfei Bai1,2*