Abstract
Fractures play an important role as flow paths in porous media. When an undersaturated reactive fluid is flowing in a fracture, the dissolution process will alter the flow paths locally. Dissolution patterns grow slowly, but they may lead to a dramatic reorganization of the flow. Here, we study dissolution in a radial geometry, which is relevant for a number of practical applications, e.g., the acidization of oil reservoirs. Different dissolution patterns are presented in a phase diagram with the Péclet and Damköhler numbers as parameters. We also analyze quantitatively the density of wormholes and the relation between the aperture roughness and the ramified patterns.
Introduction
When a fluid flows in a fractured rock, the permeability of the fractures is usually much larger than the permeability of the porous matrix. If the fluid is reactive, the dissolution process will lead to structural alteration of the fracture surfaces. A variety of dissolution patterns have been observed to form on the fracture surfaces ranging from compact to ramified and fractal [1–3]. The detailed geometry of these patterns is of central importance for the flow and dispersion properties of the fractures [4]. Some of the structures resemble the forms seen in other phenomena in non-linear science such as dielectric breakdown [5], diffusion limited aggregation DLA [6], and structures observed in two phase flow in porous media [7, 8]. Examples of geological processes where reactive dissolution of fracture surfaces are important is weathering and diagenesis of rocks [9, 10], and melt extraction from the mantle [11, 12]. Reactive dissolution of fractures has also many engineering applications e.g., stability of dams [13] and CO2 storage [14]. An important application for the oil industry is acidization: the injection of a reactive liquid to increase the permeability of the oil reservoir near a production well [15, 16]. Another example is found in the geothermal industry where fluid dissolution is used to increase the surface available for the fluid flow in order to improve heat exchange in the fractures [17–19].
In the presence of flow, the dissolution front may become unstable, due to the so called reactive-infiltration instability [10, 20–22]. Studies of the reactive-infiltration instability have been performed both theoretically and numerically [3, 15, 23–28]. At the onset of instability, a linear stability theory can be applied [20–22, 29]. The theoretical and numerical predictions of the initial instability and the dissolution phase diagram have been compared to experimental results [3, 30, 31]. However, there are relatively few experimental studies on the onset of the instability [32], especially on the dissolution in the quasi-2D radial geometry.
In the lab experiments, two different setups are usually used: rock core acidization in Hassler cell [33–35] and quasi-2D systems in Hele-Shaw cell which are aimed to study the dissolution in quasi-2D porous media and fractures [1, 3, 32, 36]. In the 3D systems, by using the confining pressure at the perimeter of the sample, the core-flow is forced through the bulk of the rock matrix. However, in the quasi-2d systems it is much harder to avoid the focusing of the flow at the boundary. The injected fluid has a tendency to flow along the difficult-to-detect aperture between the medium and the confining cell plate. This problem can be turned into advantage, if we promote it in a controlled manner instead of avoiding the wall flow. Such a controlled-aperture system can then be considered as an analog of a fracture, and the study is then directed at the investigation of how the fracture aperture evolves in time as a result of dissolution. Another experimental advantage of the quasi-2D systems is that it makes visualization easy [4, 32, 36, 37]. Further, a large number of numerical studies have been performed on these systems [28, 38–41], which provide the insights into the pattern-formation mechanisms. We have chosen a radial Hele-Shaw cell as our experimental system due to the relevance of this geometry to the practical applications such as reservoir stimulation. Flow patterns and dissolution finger growth in quasi-2d radial geometry have been studied in [1, 4, 25, 37]. In 3D, the dissolution patterns in radial geometry have been analyzed e.g., in [34, 42, 43].
In the present study we have experimentally analyzed a phase diagram for reactive dissolution inside a single fracture in a radial geometry at different flow rates and aperture widths. We have considered two cases: dissolution by central fluid injection and dissolution at the external rim by withdrawal. In section 3, two dimensionless numbers are introduced for the governing equations of the systems. In section 4, we present our experimental results with discussions of the dissolution phase diagram and the statistical properties of dissolution wormholes. The conclusions are presented in section 5.
Description of Experiments
As an experimental setup we use a Hele Shaw cell which consists of two circular glass plates separated by aluminum spacers (spacing thickness b = 1mm). The bottom glass plate (diameter d1 = 36.0 cm) is larger than the top plate (diameter d2 = 25.0 cm) and has an external rim to keep the water inside. An outlet hole at the center of the lower glass plate is connected with a tubing to a syringe pump. With this setup we have the possibility either to inject fresh water from the center or withdraw saturated water with fresh water invading from the external boundary. The experimental setup is illustrated in Figure 1.
Figure 1
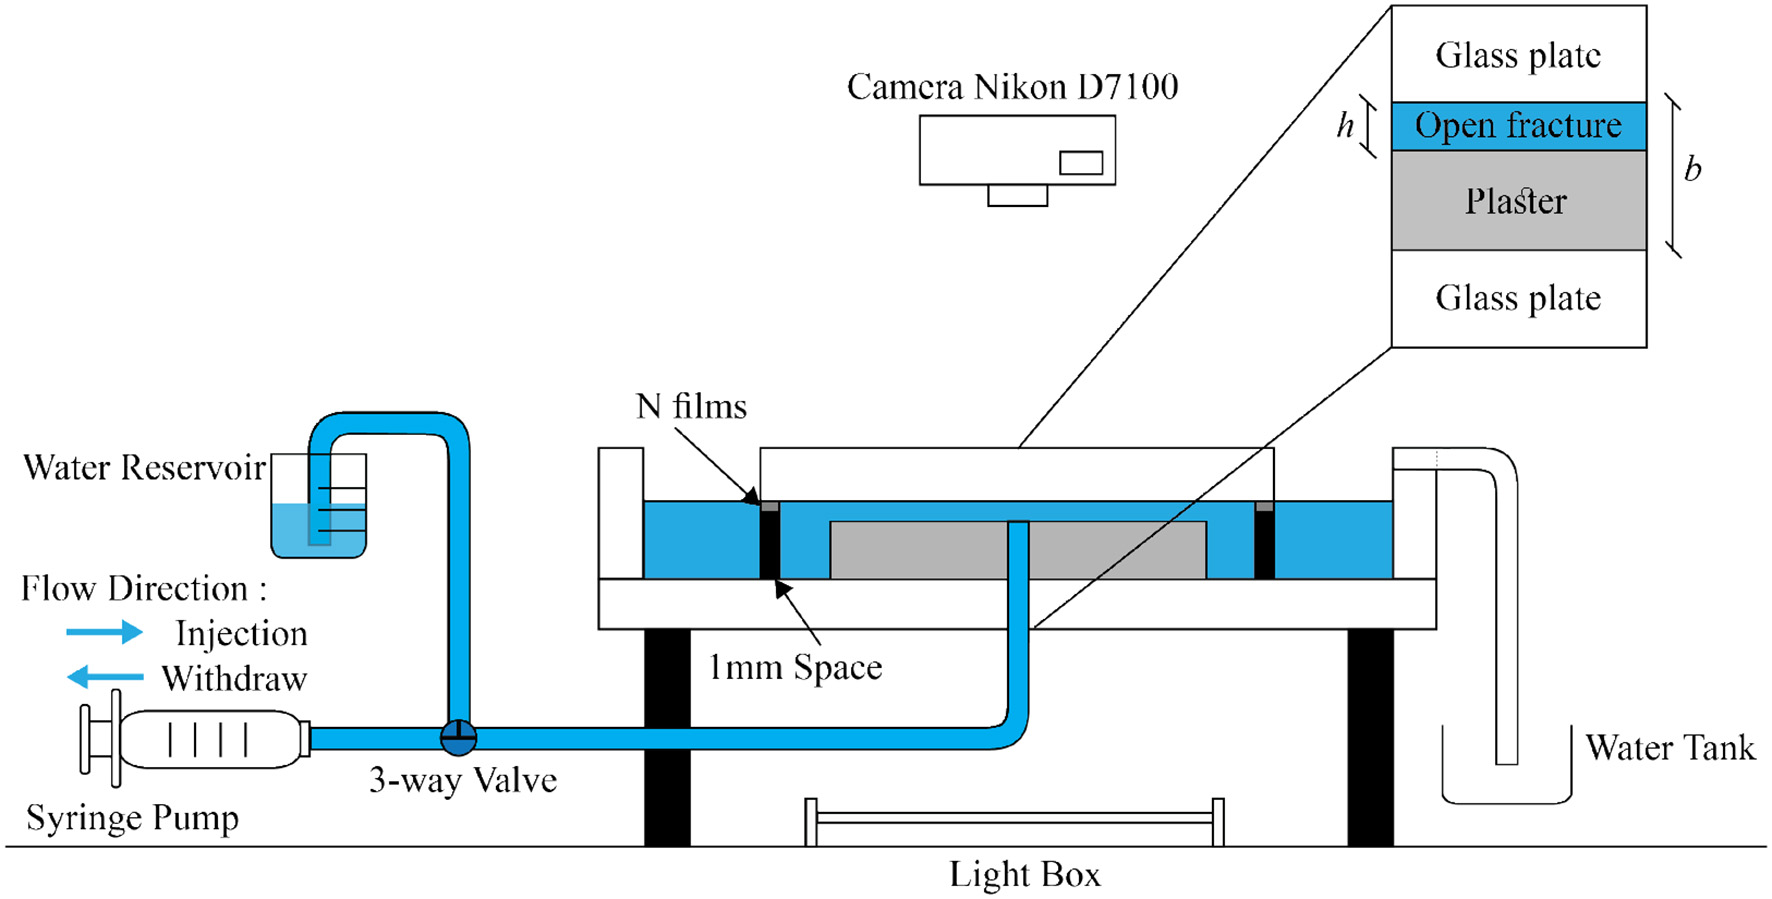
Schematic diagram of experimental setup, see description in the text. A plaster plate with a small gap h above the plaster upper surface is placed in a circular Hele Shaw cell (spacing b = 1mm). The aperture h is created artificially by inserting thin plastic films between the plaster and the top plate. A syringe pump injects or withdraws fresh water with flow rate Q from the center of the bottom glass plate (the inlet/outlet), where it flows radially inwards or outwards. The syringe can be connected to a water reservoir by a 3-way valve to recharge the syringe and ensure continuity of the flow. A light box illuminates the model from below.
Before the experiment, the system was first filled with a gypsum saturated water solution and then we injected a plaster paste from the central hole. The plaster paste was prepared by mixing two parts by weight of water and three parts of plaster powder. After injection, the solidifying paste formed a circular plate of radius R0 = 8.0cm and was left to rest for about 1 h. During this hydration process the plaster shrinked in a process called bleeding (a segregation process) [44] and saturated water is expelled to form a layer between the upper gypsum surface and the upper glass plate. The distance between the plaster and glass plate was measured to be hs = 50μm. To increase the spacing h between the gypsum sample and the upper glass plate further, a number of plastic film spacers (each of thickness h1 = 100μm) have been inserted between the upper glass plate and the aluminum spacers. In that way we can create an initial aperture of h0 = 50, 150 and 250μm.
The permeability of the aperture () is at least 4 orders of magnitude larger than the permeability of the porous matrix of the plaster () and therefore almost all the water flows through the aperture. During the experiments the temperature was kept at T = 22°C and we used distilled water with a pH = 7.17 and a viscosity of μ = 1.0·10−3Pa·s. The molecular diffusion coefficient of plaster (gypsum) in water is D = 1.0·10−9m2/s [45]. The chemical reaction kinetic constant of gypsum in water is k = 4.6·10−6m/s [46]. We changed the flow rate within the range Q = 0.6ml/h to Q = 60ml/h.The flow rate is controlled by the syringe pump. In the case of injection experiments, the fresh water is injected by the syringe pump from the center of the bottom glass plate. The water saturated with calcium ions is then collected by a water tank connected to the edge of the Hele-Shaw cell. In the withdrawing experiments, the saturated water is withdrawn by a syringe pump from the center of the system while fresh water is supplied at the outer perimeter. When the syringe is completely emptied in the injection experiment or filled for the withdrawing case, we use the 3-way valve connected to a water reservoir to recharge the syringe and ensure continuity of the flow. The water level at outer boundary of the cell is kept fixed by a spill out system above an open rim for the central injection case, or by manual supply of distilled water at the edge of system for the central extraction case, see Figure 1. In total we performed 7 experiments with injection of water and 6 experiments with withdrawing of water, as detailed in Table 1 (7 injection experiments marked with I and 6 withdrawing experiments marked with W). Each experiment was repeated at least twice. Two dimensionless numbers and a penetration length quoted in the table will be introduced in the next section.
Table 1
| Experiment | Flow Rate Q(ml/h) | Aperture h0(μm) | Péclet Number Pe | Effective Damköhler Daeff | Penetration Length lp(mm) |
|---|---|---|---|---|---|
| I1 | 0.6 | 50 | 1·10−3 | 160 | 3.5 |
| I2 | 3 | 50 | 7·10−3 | 32 | 7.9 |
| I3 | 6 | 50 | 0.01 | 16 | 11 |
| I4 | 60 | 50 | 0.1 | 1.6 | 36 |
| I5 | 0.6 | 150 | 4·10−3 | 140 | 5.4 |
| I6 | 3 | 150 | 0.02 | 28 | 8.6 |
| I7 | 6 | 150 | 0.04 | 14 | 12 |
| W1 | 7.2 | 50 | 0.02 | 14 | 12 |
| W2 | 1.2 | 150 | 8·10−3 | 69 | 5.4 |
| W3 | 7.2 | 150 | 0.05 | 12 | 13 |
| W4 | 10.8 | 150 | 0.07 | 7.7 | 16 |
| W5 | 60 | 150 | 0.4 | 1.4 | 38 |
| W6 | 10.8 | 250 | 0.1 | 6.7 | 17 |
Experimental parameters.
The experiment was illuminated from below by a light box with a homogeneous illumination. Pictures were taken from above with a Nikon D7100 camera every 5 min. The whole process was monitored from the beginning of the water injection to the breakthrough of the dissolution structures toward the opposite end of the system.
Dimensionless Numbers for Dissolution in Fractures
The aperture of the fracture is several orders of magnitude smaller than its lateral dimensions, thus the mathematical description of the flow and transport in the fracture can be obtained by depth-averaged equations [22, 32, 38]. Fluid flow is then described by the Reynolds equation for the local volume flux (per unit length across the fracture),
where h is the aperture of the fracture, p is the pressure and μ is the fluid viscosity. Next, the transport of calcium ions in the aqueous phase is described in terms of flow-averaged concentration field, , with the 2d transport equation of the form,
where ∇ is a two-dimensional (x, y) gradient operator, D is the diffusion coefficient and R is the sink term related to the dissolution of the gypsum layer. The kinetics of gypsum dissolution expressed by R is, to a good approximation, linearly related to the difference between the saturated concentration csat and the concentration of the calcium ions at the mineral surface (interface of solid/fluid), cw [45]:
with the intrinsic kinetic constant k. To express the reactive current, R, in terms of average concentration, let us note that R needs to be balanced by the diffusive flux at the surface,
where n is the vector normal to the surface. The diffusive current can be expressed in terms of the geometry-dependent Sherwood number, Sh [47].
Sherwood number itself depends on kh/D, but the variation is relatively small [48], bounded by two asymptotic limits: high reaction rates (transport limit) and low reaction rates (reaction limit). For our geometry (slot space with one dissolving wall) these limits correspond to Sh = 4.861 and Sh = 5.385 respectively [49]. We approximate the value of Sh as Sh = 5 in the theoretical calculations.
Expressing cw is terms of using Equation (6) and Equation (10) leads finally to
with the effective reactive constant:
which accounts for the diffusive slowdown of reaction as the aperture increases.
Two different parameters control the behavior of the system. The Péclet number characterizes the relative rate between convective and diffusive transport calculated from characteristic timescales [37]. Next, the effective Damköhler number relates the reaction rate to the rate of convective transport [28]. Importantly, in the experiment we can control both the total flow rate Q and the initial aperture h0 and thus vary Pe and Da values independently [32]. Note that we have chosen the system size R0, as the length scale in the definition of the Damköhler number, since what we will use is mainly for the assessment whether the reactant penetration length is comparable with the system size.
At the initial moment, where the flow is isotropic and the aperture field - homogeneous h(r, ϕ) = h0, the transport equation (3) can be solved analytically. For large Péclet numbers the undersaturation is of a Gaussian form [50]:
where rf is the position of the reaction front, defining the reactant penetration length to be
The penetration lengths corresponding to the experiments are quoted in Table 1.
Experimental Results and Discussions
Experimental Dissolution Patterns
With freshwater injected into the Hele-Shaw cell, the flow dissolves the plaster sample up to the equilibrium state where the gypsum saturates the water. The dissolution patterns evolution with time are obtained by a sequence of images, see Figures 2, 3. In Figure 2 the aperture is fixed to h0 = 50μm and the injection rate increases from 0.6 to 60ml/h corresponding to the experiments I1, I2, I3, and I4 in Table 1. In Figure 3, the aperture thickness is fixed with h0 = 150μm and the injection rate increases from 1.2 to 60ml/h corresponding to the experiments W2, W3, W4, and W5 in Table 1. In the analogy to the previous studies [3, 15] we can classify the pattern in Figure 2A as compact, the pattern in Figure 2B as a dominant wormhole, the pattern in Figure 2C as ramified wormholes and the pattern in Figure 2D as uniform.
Figure 2
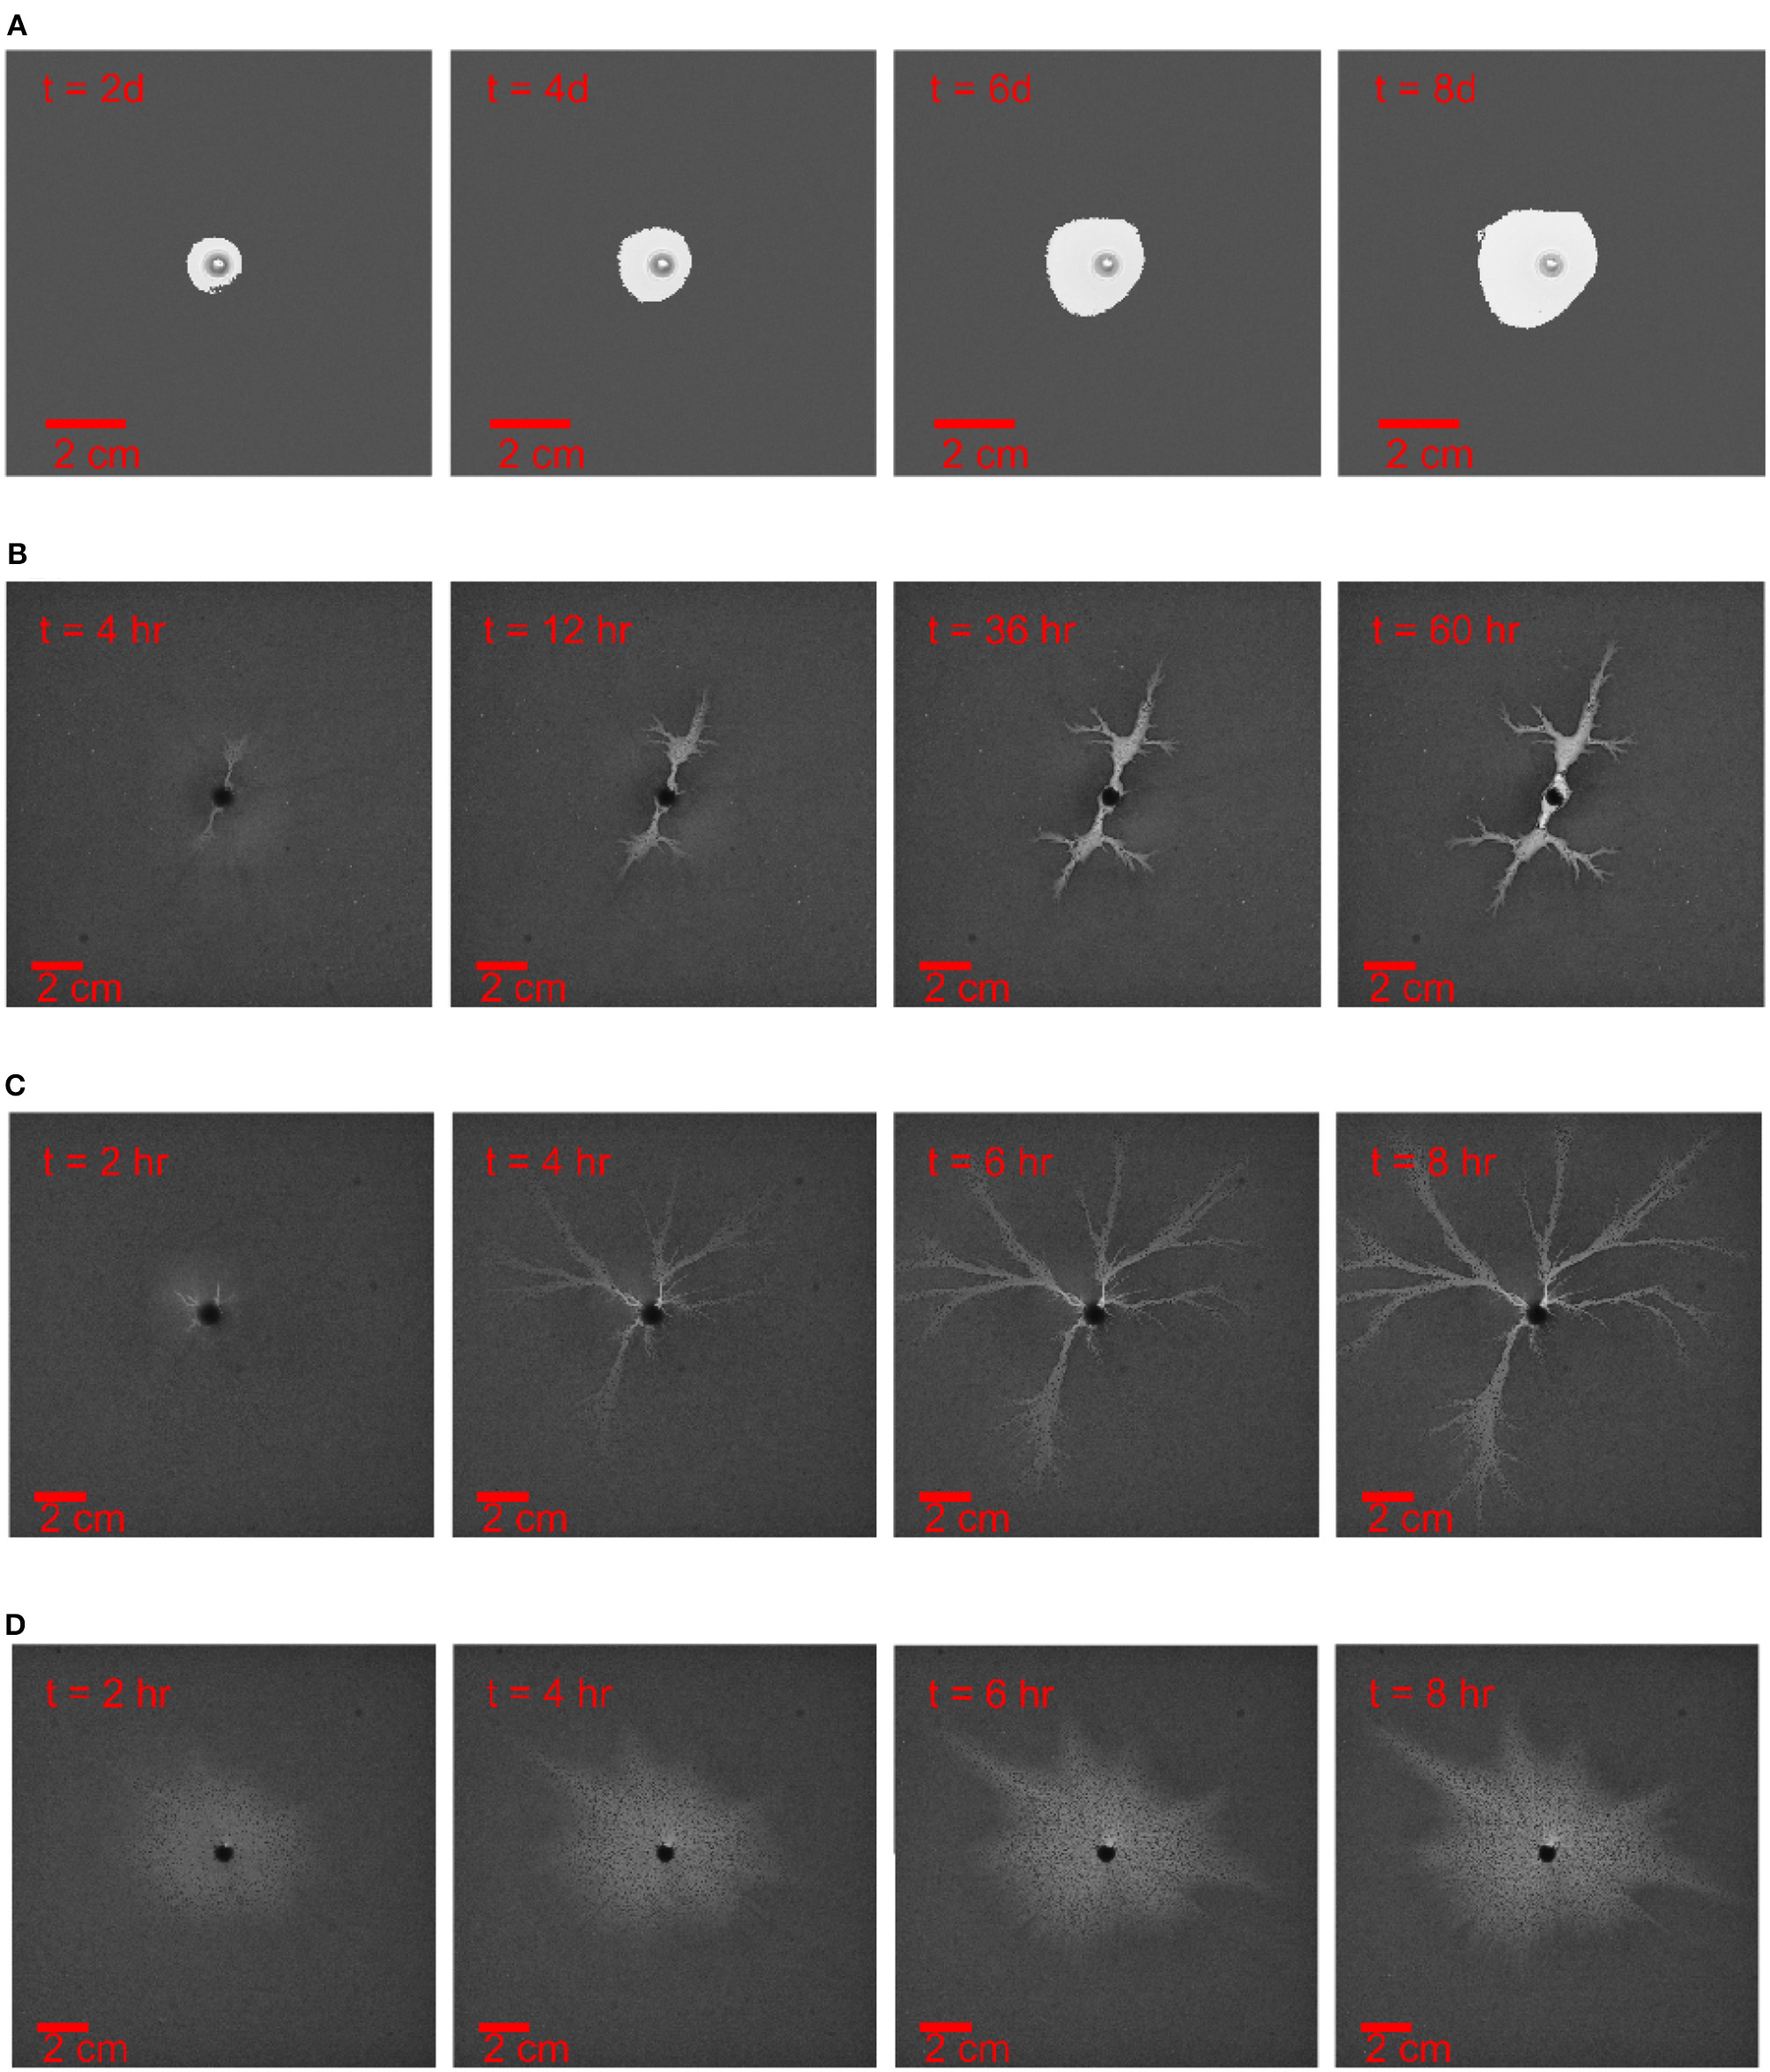
Dissolution pattern evolution with time t, the aperture thickness is 50 μm and the injection rate increases from top to bottom. The time and length scale are indicated in the images. (A) The injection rate is 0.6ml/h, experiment I1 in Table 1(B) The injection rate is 3ml/h, experiment I2 in Table 1. (C) The injection rate is 6ml/h, experiment I3 in Table 1. (D) The injection rate is 60ml/h, experiment I4 in Table 1 Except for the case of the compact dissolution pattern (A), the experiments are ended once there is breakthrough or the dominant channel is formed. The images are adjusted by contrast enhancement, otherwise the dissolution patterns are difficult to observe from the printed images.
Figure 3
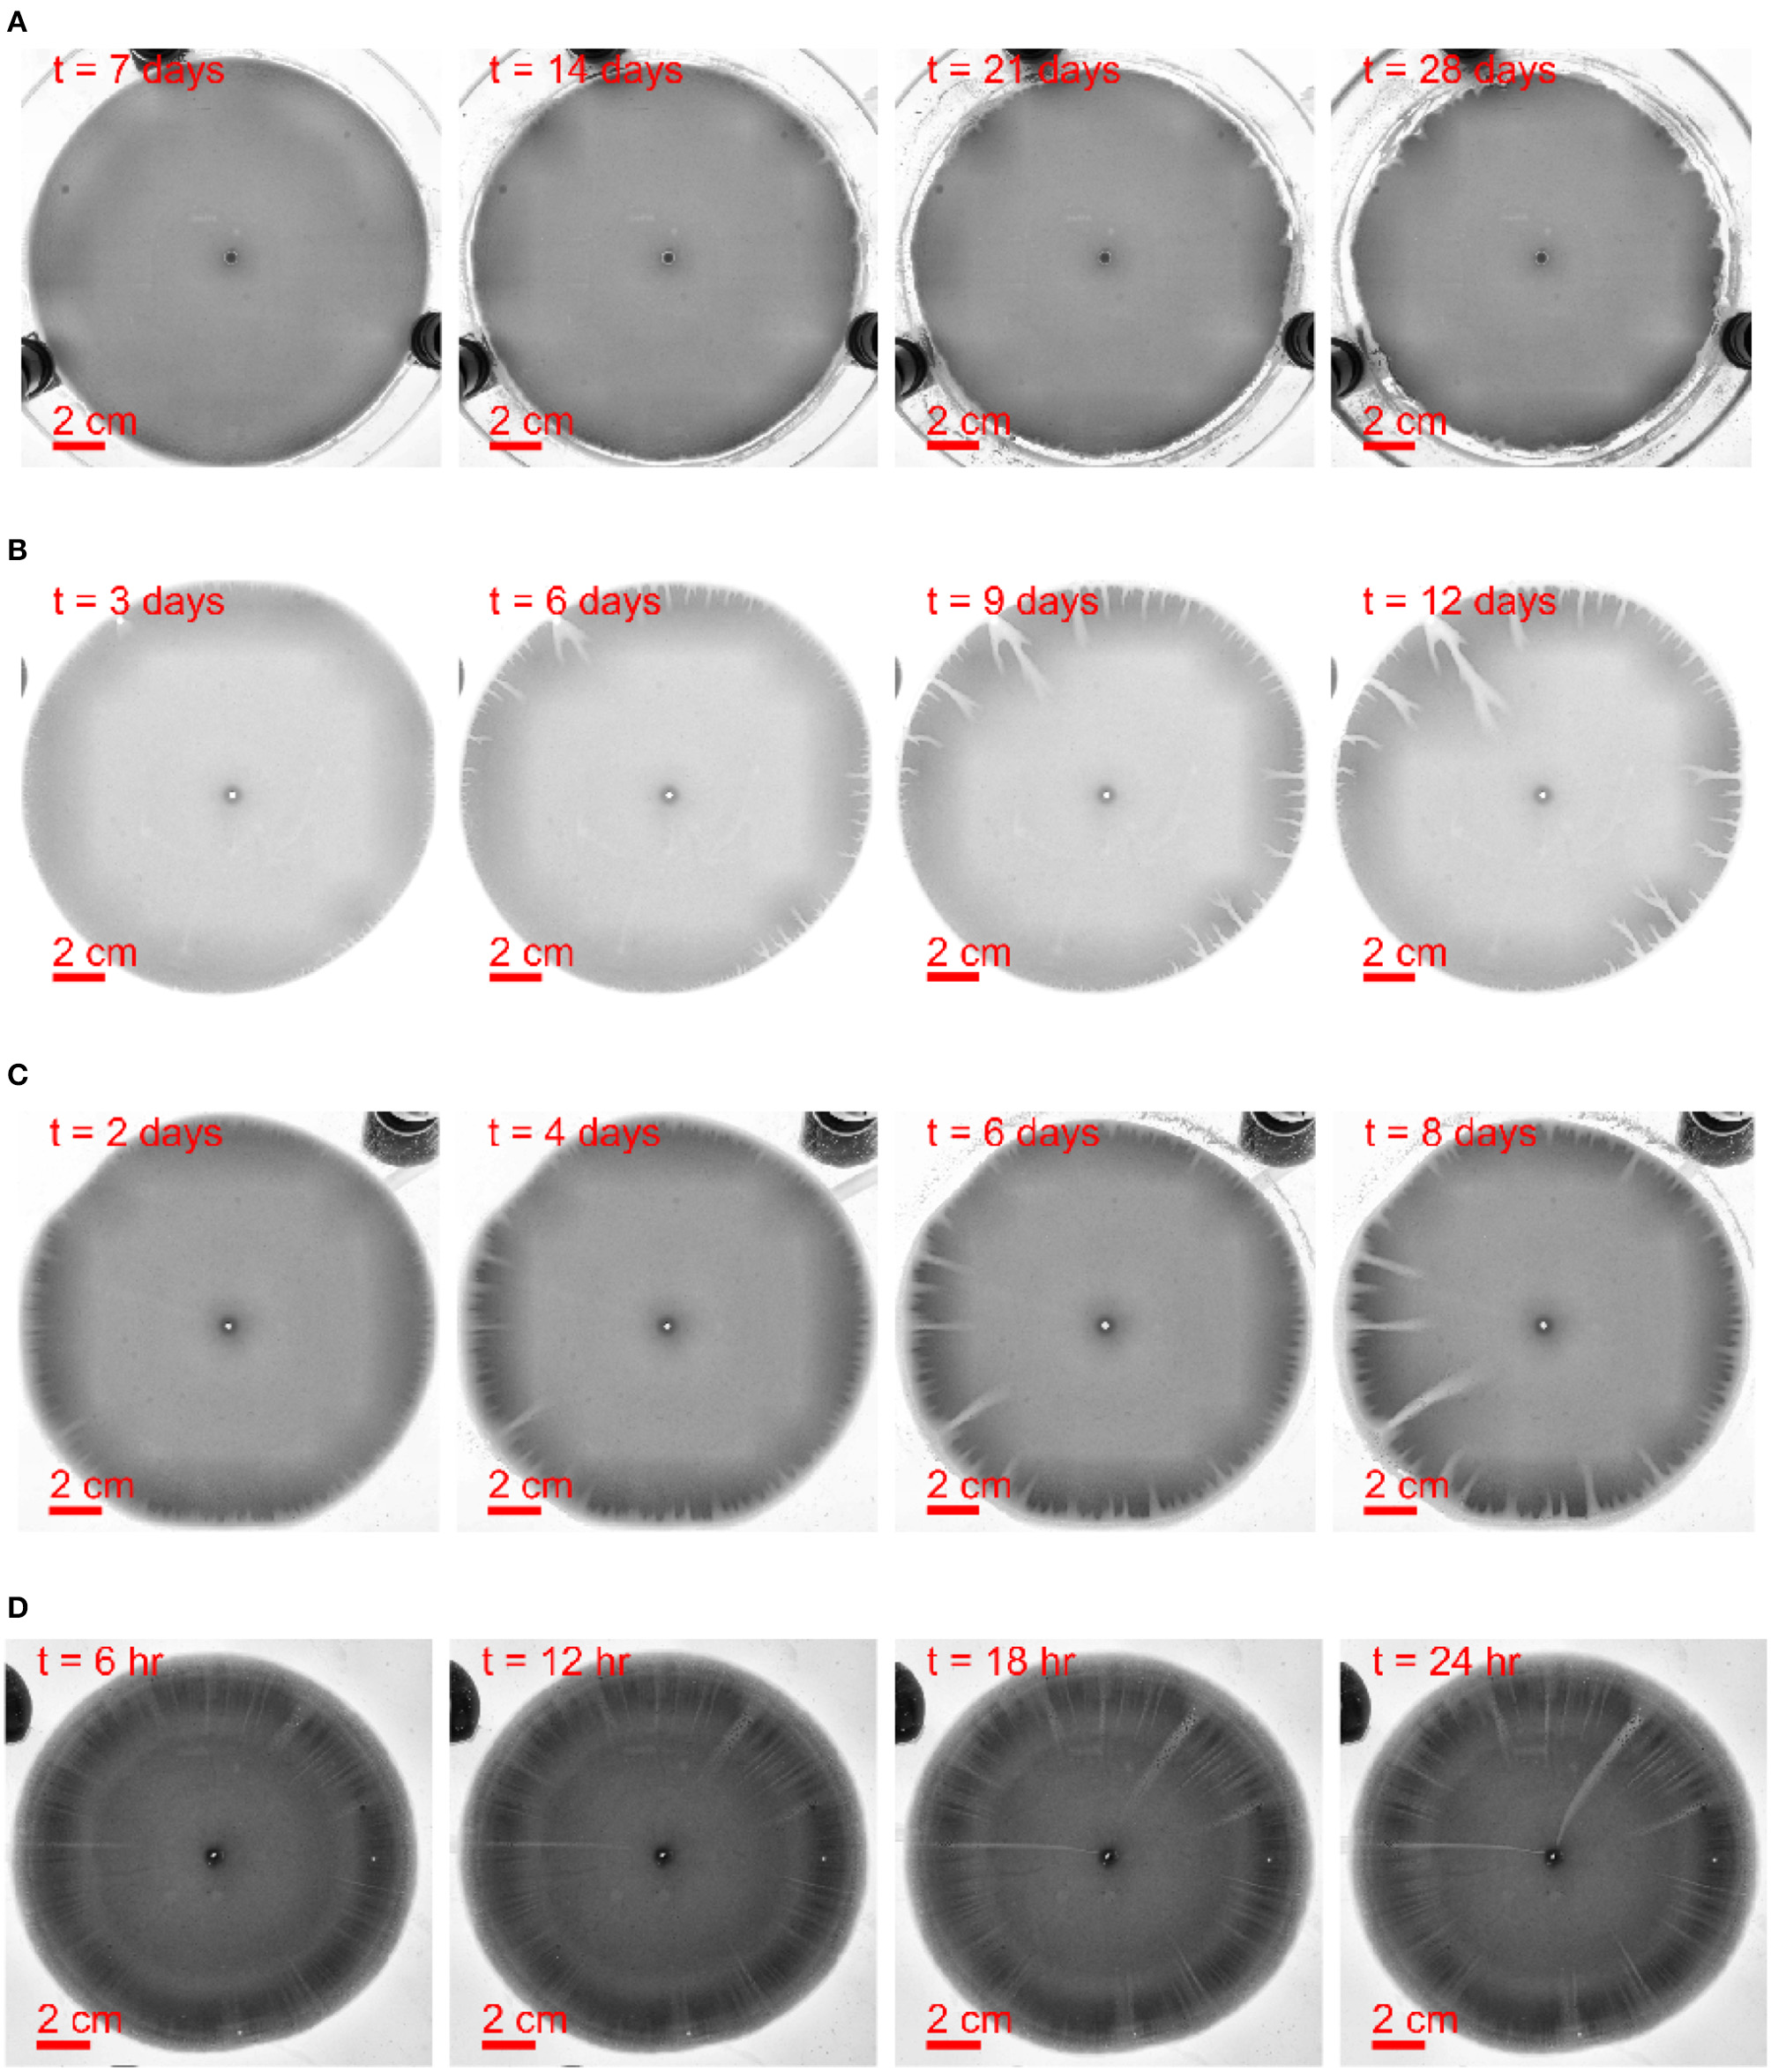
Dissolution pattern evolution with time t, the aperture thickness is 150 μm and the flow rate increases from top to bottom. The time and length scale are indicated in the images. (A) The withdrawing rate is 1.2ml/h, the experiment W2 in Table 1. (B) The withdrawing rate is 7.2ml/h, the experiment W3 in Table 1. (C) The withdrawing rate is 10.8ml/h, the experiment W4 in Table 1. (D) The withdrawing rate is 60ml/h, the experiment W5 in Table 1. The images are adjusted by contrast enhancement.
For very low injection rates (Q < 2ml/h), the chemical reaction reaches the equilibrium right at the interface. In such case, the front between the undissolved and dissolved phase is very sharp. In the low-velocity regime, the dissolution front is stable to perturbations [50]. As a result, the emerging dissolution pattern is compact, see Figure 2A. The breakthrough time (corresponding to the dissolution front reaching the end of the system) is very long in such case, so it is not an efficient way of augmenting the permeability of the rock.
For medium injection rates (2ml/h < Q < 30ml/h), the fresh water can flow further before it becomes saturated. The dissolution front is then more diffuse with the partially dissolved regions observed at the boundary between undissolved and dissolved regions. The dissolution front is now unstable and soon the first perturbations appear, which break the initial homogeneity. These channels are initially very short, but the longer channels with higher pressure gradient will concentrate more fresh flow which in turn enhances the dissolution. With this positive feedback loop, the longest channels soon transform into pronounced fingers. These dissolution fingers (sometimes called wormholes) compete with each other, surviving ones screening off the shorter ones until the longest one finally breaks through [1–3, 15, 33]. At higher injection rates, the wormhole pattern becomes increasingly ramified. There is now more flow to divide between alternate pathways and the competition between them weakens, allowing many branches to co-exist.
For high injection rates (Q > 30ml/h), the fresh water flows very fast in the fracture, the reactant penetration length lp becomes comparable to the system size and the concentration becomes almost uniform along the flow direction. Based on Equation (18), this takes place when , which (for R0 = 8cm) corresponds to Q ≈ 30ml/h. The fresh water can dissolve the entire domain of the plaster sample with almost the same reaction rate which leads to a uniform dissolution pattern. In this case the increase of permeability comes at a price of a large amount of injected water, thus it is not an optimal injection rate to increase the permeability of fracture. Interestingly, we observe that the initially uniform dissolution patterns eventually become unstable and develop fingers, see Figure 2D. This is a manifestation of the inhomogeneous nature of the flow field in a radial system. The magnitude of the flow decreases with the radius as 1/r and thus with time—as the dissolution front moves away from the center—the patterns transition toward those observed at lower flow rates.
For the withdrawing experiments shown in Figure 3, it is hard to obtain a sharp and stable dissolution front. This is because of much lower flow velocities at the outer rim than at the inner rim at the same volumetric flow rate Q. However, the general features of the flow dependence of the wormhole shapes are similar to those observed in injection experiments: at lower flow rates the wormholes are thicker and less dense, whereas at the higher flow rates their density is higher, with many independent flow channels sharing the flow. The flow rate affects also the instability development time - the growth rate of instabilities is the slowest at low flow rates (Figure 3A) with first perturbations appearing only after about 10 days. As the flow rate increases, the instability development time is reduced to a few hours (for Q = 7.2 ml/h) or tens of minutes (for Q = 10.8 ml/h).
Experimental Phase Diagram
The experimental results are summarized in a phase diagram, Figure 4, where the dissolution patterns are presented as function of the Péclet and the effective Damköhler number defined in section 3. In these experiments, the points corresponding to the patterns shown in Figure 4 are marked by the star dots with the experiment number in Table 1. The dissolution patterns are displayed as binarized images with a threshold applied on the gray-scaled pictures analogously to Figures 2, 3.
Figure 4
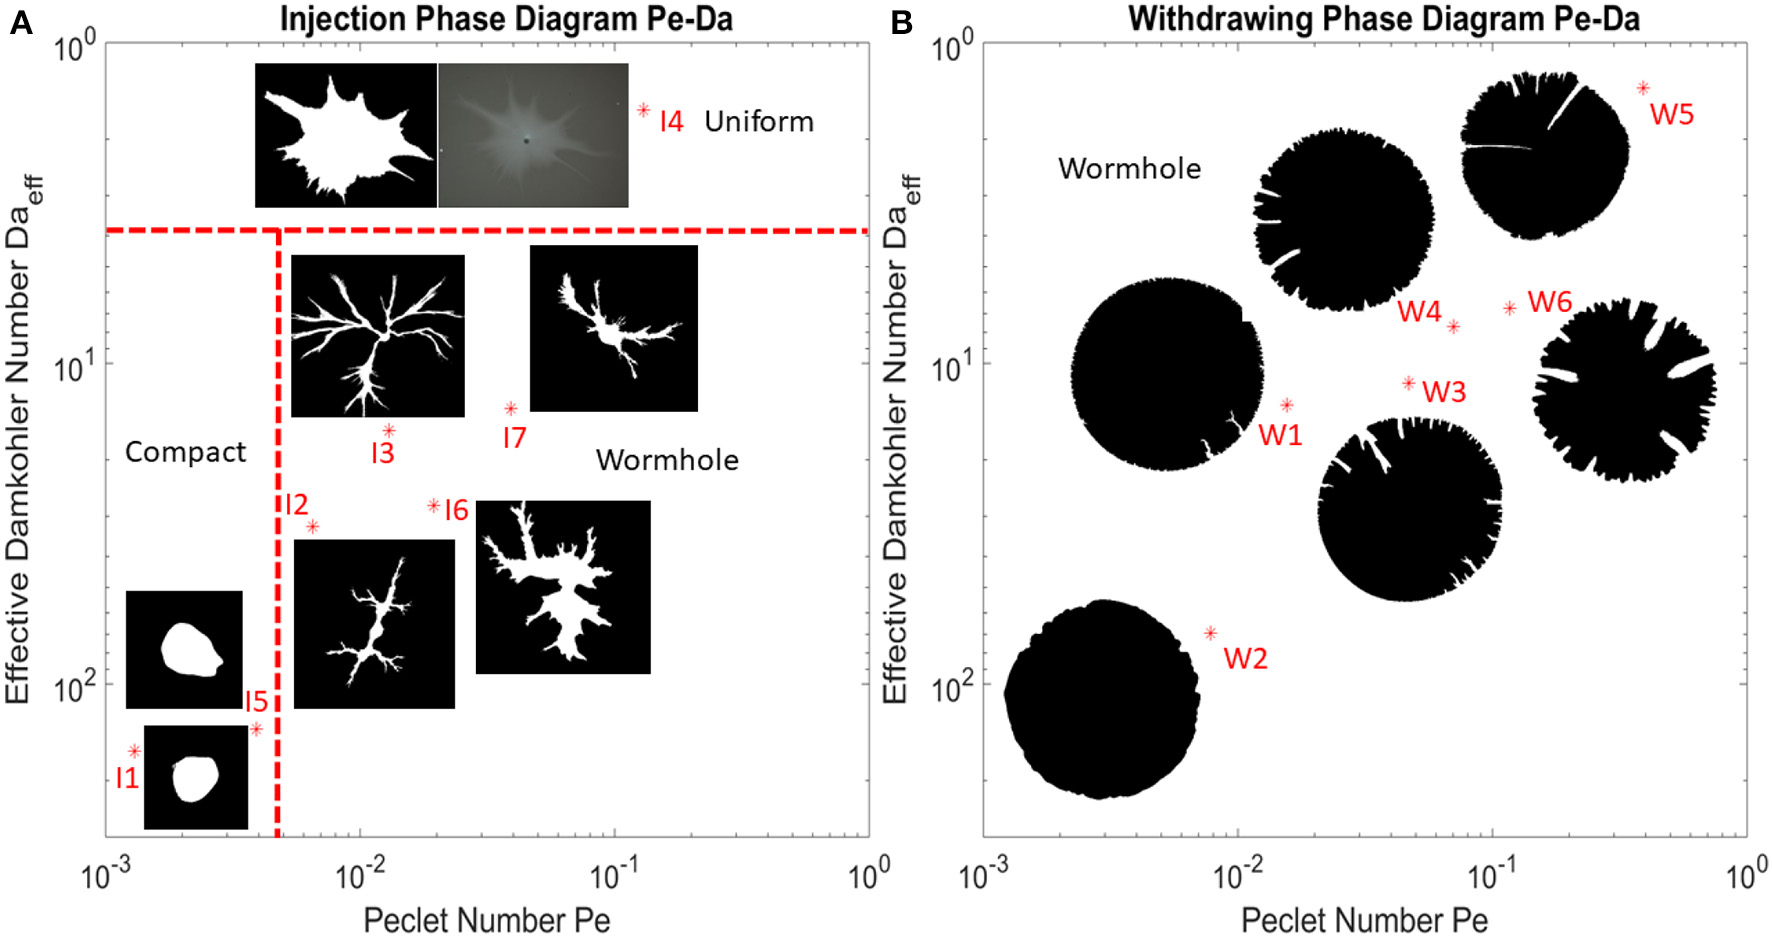
Phase diagram describing characteristic dissolution patterns as a function of Péclet and effective Damköhler number. (A) Phase diagram with flow injected from the center. All the experiments with different Pe and Daeff are marked with red star dots in the diagram, together with the binary image of the final dissolution pattern where the white part indicates dissolved part and the black part indicates undissolved part. The uniform pattern is displayed by both gray-scaled and binarized images in order to demonstrate that the white part at the center is not completely dissolved. The red dashed line represent boundaries between different dissolution pattern regimes. The boundaries between different regimes are drawn based on a qualitative observation of dissolution patterns. (B) Phase diagram with flow withdrawn from the rim of the disk inwards to the central outlet. The compact and uniform dissolution patterns are not clearly experimentally observed in the withdrawing case.
From Figure 4, the phase transition boundaries among compact, wormhole and uniform dissolution pattern are drawn based on a qualitative observation of dissolution patterns. For the outward flow, we have observed that the boundary between compact and wormhole phases locates around Pe = 5·10−3 and the boundary between wormhole and uniform phases locates around Da = 4. For the inward flow, we have not observed the boundary between compact and wormhole phases and the boundary between wormhole and uniform phases very clearly. Thus, we classify all these dissolution patterns of the withdrawing experiments as wormhole patterns. The fact that the boundaries between the compact (stable) dissolution and wormholing is different for injection and withdrawal reflects the fact that the local flow rates (q in Equation 2) are much lower at the outer rim of the system than at its inner rim (for the same total volumetric flux). Larger flow velocities more easily trigger the front instability [22]. The screening effect between fingers is another important difference between the injection and withdrawing experiments. For the withdrawing case, the fingers grow as the flow converges to the central outlet and the fingers get closer to each other. This increases the competition between the fingers and the pattern becomes strongly hierarchical, with relatively large number of shorter fingers and a few longer ones, focusing most of the flow. Conversely, the competition is much weaker for the outward flow case with injection at the center. There, the spacing between the fingers increases which makes the screening less intense and promotes splitting of the fingers, with new branches appearing in between the old ones, as clearly visible in Figure 4. Similar phenomena were reported for viscous fingering, where also the radial outward flow is associated with splitting [51]. For the inward flow, the splitting is less intense and associated just with the longest fingers where the flow is the highest [52].
The theoretical determination of the position of this boundary line will require a linear stability analysis of the dissolution problem in radial geometry. So far, such an analysis was only carried out in the limit of infinitely thin reaction front [50], which corresponds to significantly lower velocities than the ones used in the present study. We hope that present results will inspire further theoretical work in this direction.
Density of Wormholes
Dissolution patterns have been quantitatively described by fractal dimension in different works [2, 53]. However, particularly in the wormhole regime, our dissolution fingers have cone-like shapes tapering toward the tips and the dissolution pattern is not self-similar [4]. Here we will use the concept of wormhole density [54, 55] to describe our dissolution patterns. The wormhole density ρN is defined as the number of wormholes per centimeter along a perimeter of circle with a radius r. A wormhole in our counting procedure is defined as a continuous dissolved part with a minimum width 2 mm. A minimum width is set to avoid miscounting pixel noise as wormholes at the dissolution front. The density analyses are performed on the final states of each dissolution process. In Figure 5, a schematic diagram displays an example of how we calculate the number of wormholes intersecting a circle Nwh at a specific radius r.
Figure 5
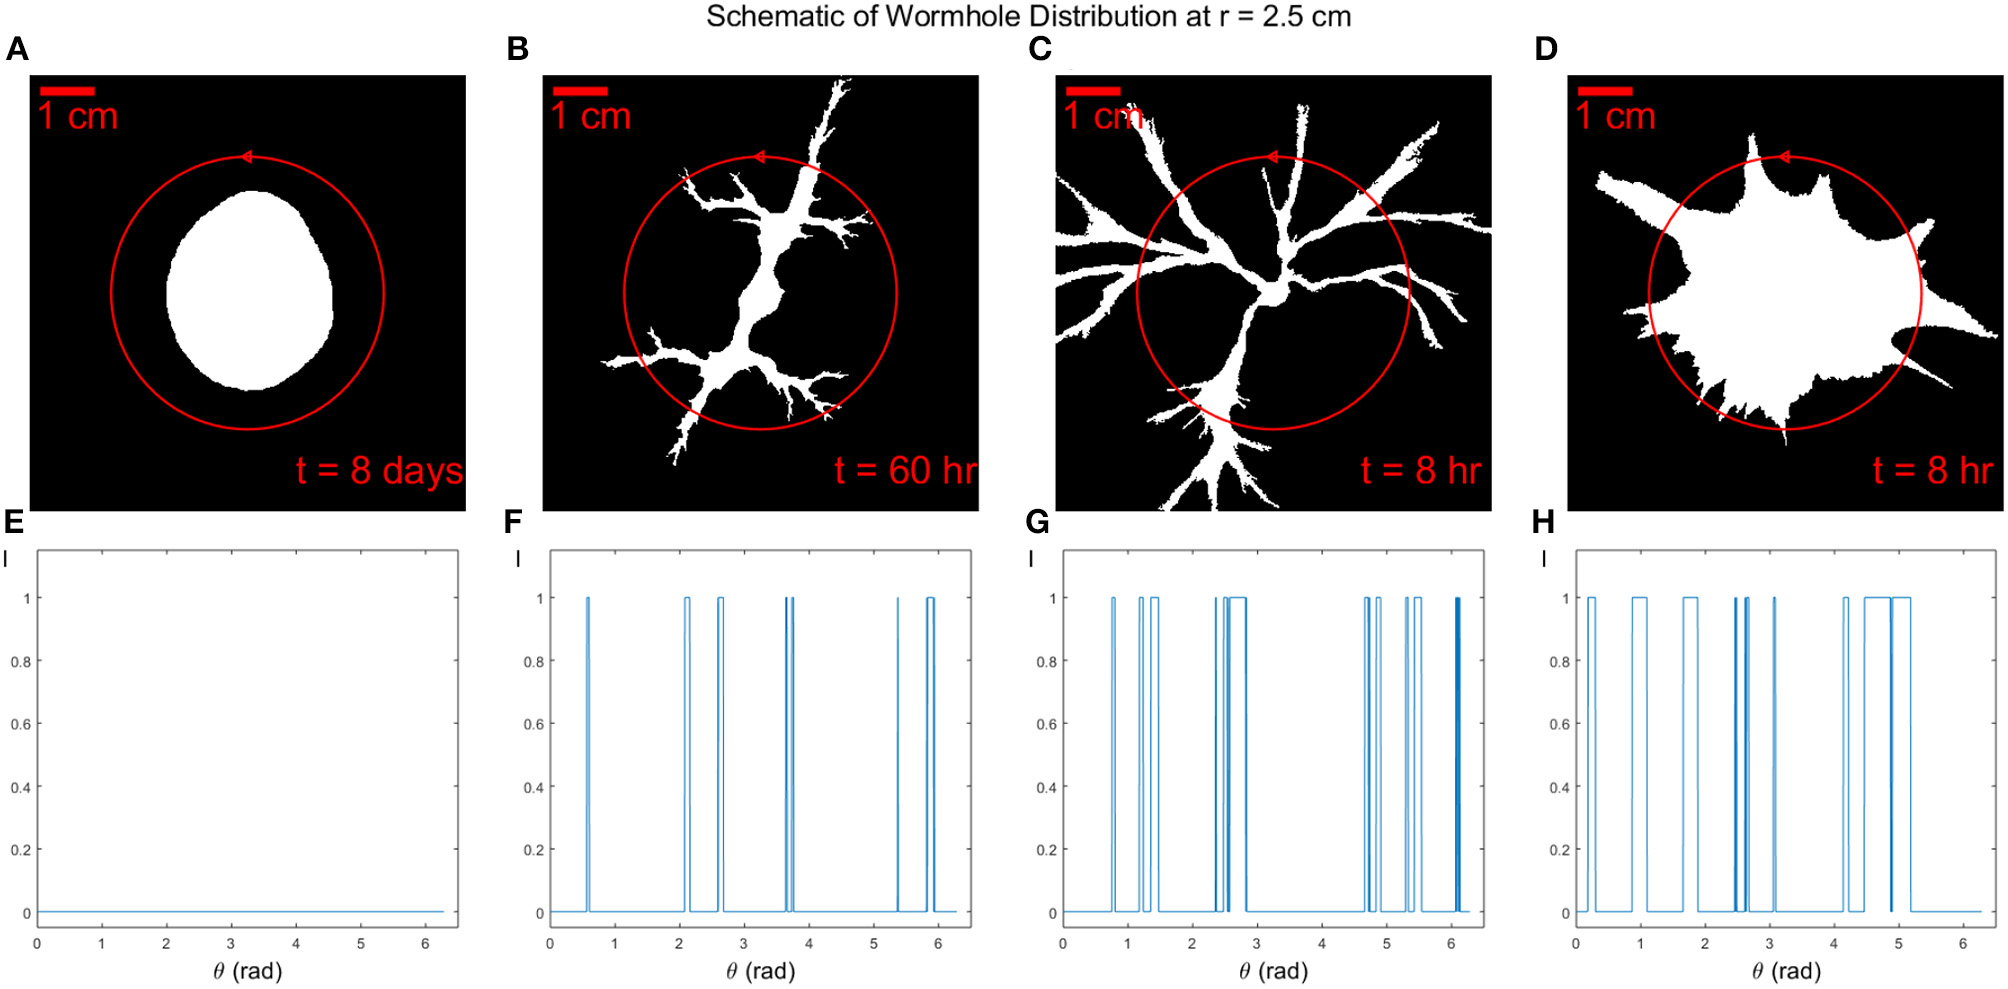
Four binarized images (A–D) on the top show the dissolution patterns of experiments I1 to I4 with same aperture but different injection rate Q. The total dissolution time is t = 8 days, t = 60 h, t = 8 h, and t = 8 h, respectively. The red circle has a radius of r = 2.5cm passing through wormholes in dissolution patterns. The circle is traversed in the counterclockwise direction, as marked by the arrow. Wormhole distributions are shown at the bottom (E–H). Note that because the images are binarized, the intensity value I can be either 1 or 0. The number of wormholes can be counted as the number of peaks of the distribution with a minimum peak width 2 mm.
From Figure 5, we can count the number of peaks of the distribution with a minimum peak width 2 mm as the number of wormholes. We plot the number of wormholes Nwh as a function of radius r for the different Péclet numbers Pe, see Figure 6. For the compact dissolution pattern at low Péclet numbers (Pe = 1·10−3), as expected, the number of wormholes remains zero except for some variations at the front since the compact pattern is not a perfect circle. For the other 3 experiments carried out at different Pe, the number of wormholes first increases to a maximum, then gradually decreases. The wormhole density shows a similar tendency: as the radius r increases, wormholes grow and split, side fingers start to grow from the roots, which results in an increased number of branches. For the case of dominant wormholes (Pe = 7·10−3), some of the branches eventually screen the other, which leads to the appearance of the maximum in the Nwh(r) dependence. On the other hand, for the ramified pattern (Pe = 0.01) the side branches continue to grow until nearly the end of the system. Finally, for the uniform dissolution pattern (Pe = 0.1), the situation is somewhat similar to the compact case, except at the front, where a number of relatively wide fingers appear as described in section 4.1.
Figure 6
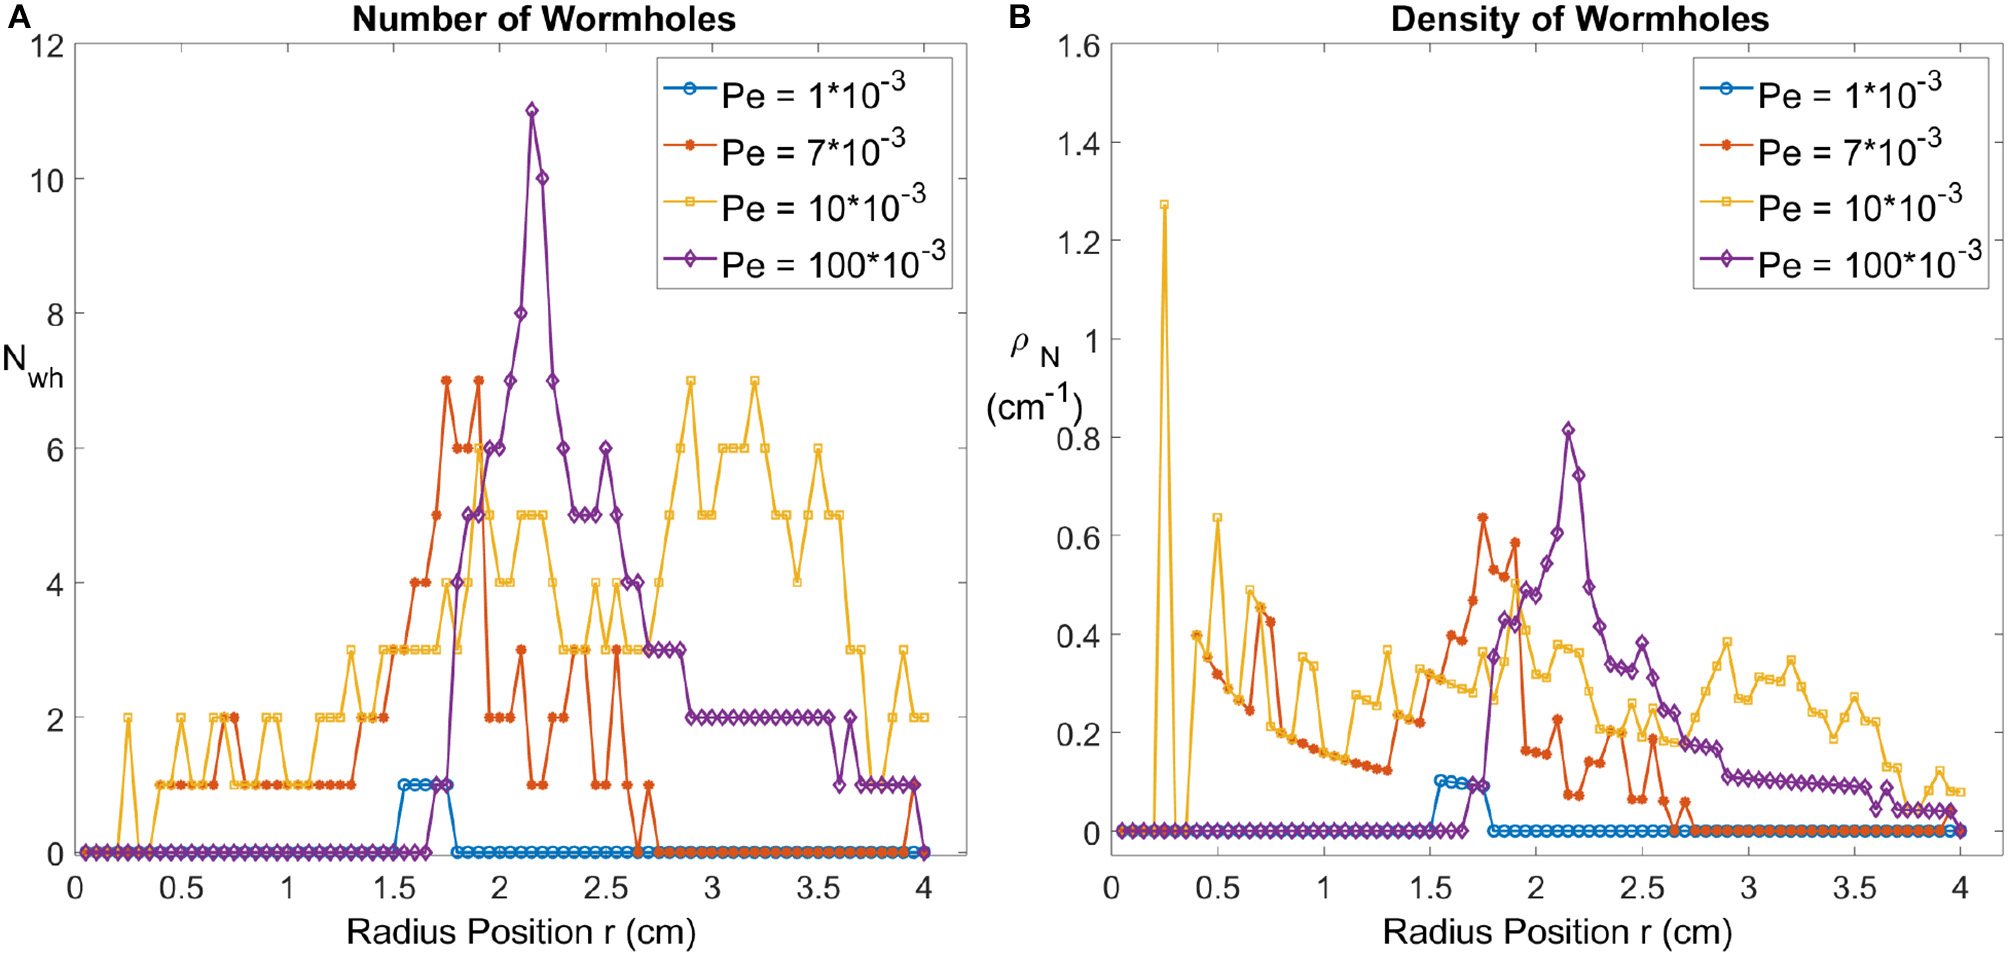
(A) The number of wormholes Nwh as a function of radius r, for four different Péclet numbers. (B) The density of wormholes ρN as a function of radius r.
Roughness and Ramified Fingering
Besides the wormhole density, other significant characteristic features of the wormholes are their widths and the extent of ramification. In some classical instabilities, as Saffman-Taylor instability, the finger width as function of distance to tip is one of the most finely studied quantities [56]. The ramification and thickness of the viscous fingering patterns have been characterized in water and miscible non-newtonian fluid system [57] and in drainage in a porous medium [58]. In the fracture dissolution system, the simulation results show that the rougher the aperture, the more ramified dissolution fingers will be observed [38, 59, 60]. This has also been qualitatively verified by the observation in both inwards and outwards flow in the radial geometry experiments. The roughness is defined as:
where h = h(x, y, t) is the aperture, with a initial mean aperture h0 = < h(x, y, t = 0) >. The initial aperture field is measured before dissolution using digital optical microscope Keyence VHX5000. The results give the standard deviation of the initial aperture σ0 = 10.0μm where . Taking into account that h0 varies from 50.0 to 150.0 μm, we get the initial roughness in the range 0.07 to 0.2. For the higher roughness, experimental images show more ramified and thinner fingers than those observed at lower roughness, see Figure 7.
Figure 7
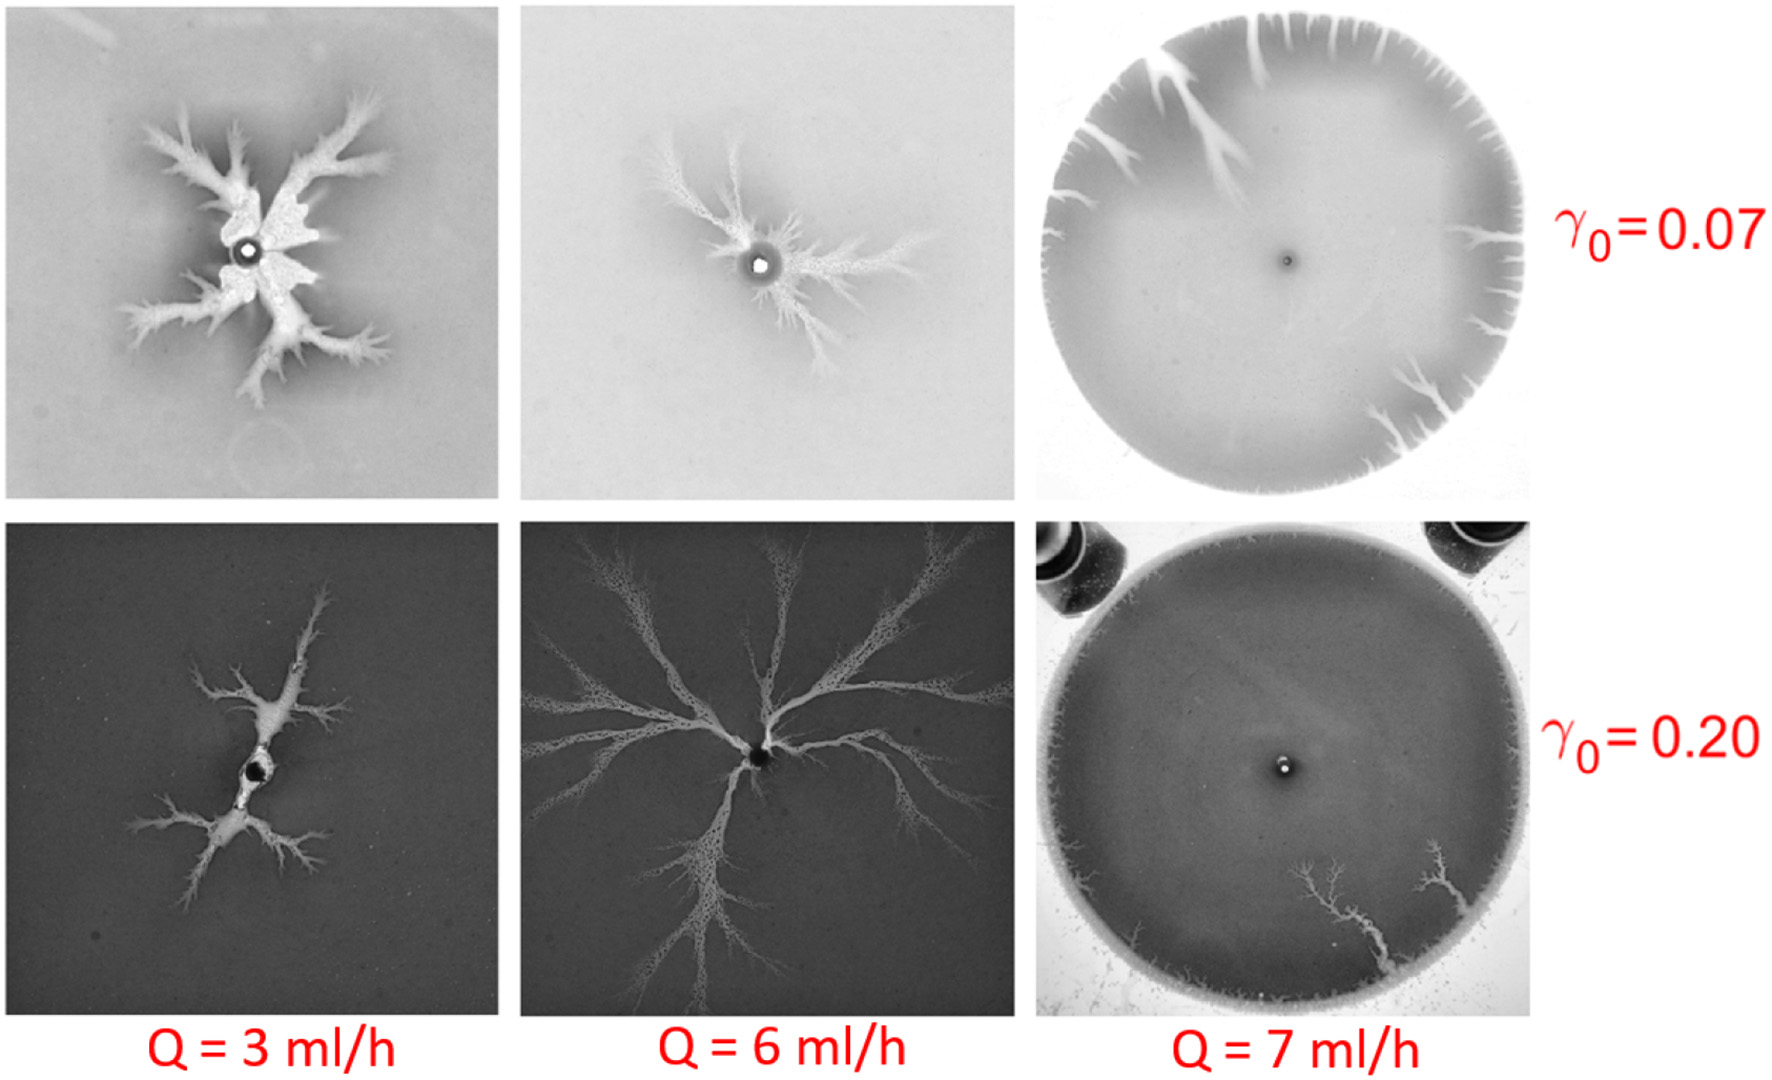
Ramified or smooth fingers with different initial roughness γ0 and injection rate Q. From top to bottom, the roughness increases from γ0 = 0.07 to γ0 = 0.20 for the initial average aperture h0 = 50.0μm(top) and 150.0μm(bottom), respectively. From left to right, the flow rate is Q = 3ml/h, 6ml/h, 7ml/h, respectively. Notice that the rightmost two dissolution patterns are obtained in the withdrawing experiments. We observe that as the roughness is increased, the patterns become thinner and more ramified.
Conclusions
The problem of flow-induced fracture dissolution has received a lot of interest in recent years due to its importance in geological phenomena as well as industrial applications. However, to our knowledge, the experimental evidence of radial dissolution in quasi-2d geometry remains scarce. In this paper, we used a plaster disk sample in a Hele-Shaw cell to study the flow-induced dissolution patterns formation in a circular geometry.
We classified the dissolution patterns and analyzed their dependence on the fundamental dimensionless groups characterizing convection, diffusion and reaction, i.e., the Péclet and Damköhler number. By changing the aperture of our Hele-Shaw cell as well as the flow rate, we can vary Péclet and Damköhler number independently and thus obtain a phase diagram of dissolution patterns in Pe-Da variables. The general features of this phase diagram are not unlike those of an analogous diagram for rectangular geometry [3], but there are also important differences. These are connected with the inhomogeneous nature of the flow in the system, with a flow rate decreasing as we move away from the inlet. Because of this, the dissolution features tend to transition with time to the forms characteristic of lower flow rates: uniform patterns become unstable and develop fingers, ramified wormholes transition toward the dominant ones. We hope that these experimental results will constitute a benchmark for the further theoretical and numerical studies of the dissolution process in a radial geometry.
Statements
Data availability statement
All datasets generated for this study are included in the article/supplementary material.
Author contributions
LX and KM designed the experiment. LX performed the experiments, analyzed the data, and authored the paper. PS, RT, EF, and KM assisted with the interpretation and data analysis and editing of the manuscript. All authors contributed to the article and approved the submitted version.
Funding
This project has received funding from the European Union's Seventh Framework Programme for research, technological development and demonstration under grant agreement no. 316889. We acknowledge the support of the University of Oslo and the support by the Research Council of Norway through its Centres of Excellence funding scheme, project number 262644 and the INSU ALEAS program, the USIAS, the French-Norwegian LIA D-FFRACT and the support by the National Science Centre (Poland) under Research Grant 2016/21/B/ST3/01373.
Acknowledgments
We thank Mihailo Jankov for technical support and Marcel Moura, Fredrik K.Eriksen, and Florian Osselin for useful discussions.
Conflict of interest
The authors declare that the research was conducted in the absence of any commercial or financial relationships that could be construed as a potential conflict of interest.
References
1.
Daccord G . Chemical dissolution of a porous medium by a reactive fluid. Phys Rev Lett. (1987) 58:479. 10.1103/PhysRevLett.58.479
2.
Daccord G Lenormand R . Fractal patterns from chemical dissolution. Nature. (1987) 325:41–3. 10.1038/325041a0
3.
Golfier F Zarcone C Bazin B Lenormand R Lasseux D Quintard M . On the ability of a Darcy-scale model to capture wormhole formation during the dissolution of a porous medium. J Fluid Mech. (2002) 457:213–54. 10.1017/S0022112002007735
4.
Xu L Marks B Toussaint R Flekkøy EG Måløy KJ . Dispersion in fractures with ramified dissolution patterns. Front Phys. (2018) 6:29. 10.3389/fphy.2018.00029
5.
Niemeyer L Pietronero L Wiesmann H . Fractal dimension of dielectric breakdown. Phys Rev Lett. (1984) 52:1033. 10.1103/PhysRevLett.52.1033
6.
Witten T Jr Sander LM . Diffusion-limited aggregation, a kinetic critical phenomenon. Phys Rev Lett. (1981) 47:1400. 10.1103/PhysRevLett.47.1400
7.
Lenormand R Touboul E Zarcone C . Numerical models and experiments on immiscible displacements in porous media. J Fluid Mech. (1988) 189:165–87. 10.1017/S0022112088000953
8.
Måløy KJ Feder J Jøssang T . Viscous fingering fractals in porous media. Phys Rev Lett. (1985) 55:2688. 10.1103/PhysRevLett.55.2688
9.
Iyer K Jamtveit B Mathiesen J Malthe-Sørenssen A Feder J . Reaction-assisted hierarchical fracturing during serpentinization. Earth Planet Sci Lett. (2008) 267:503–16. 10.1016/j.epsl.2007.11.060
10.
Ortoleva P Chadam J Merino E Sen A . Geochemical self-organization II: the reactive-infiltration instability. Am J Sci. (1987) 287:1008–40. 10.2475/ajs.287.10.1008
11.
Kelemen PB Whitehead J Aharonov E Jordahl KA . Experiments on flow focusing in soluble porous media, with applications to melt extraction from the mantle. J Geophys Res Solar Earth. (1995) 100:475–96. 10.1029/94JB02544
12.
Aharonov E Spiegelman M Kelemen P . Three-dimensional flow and reaction in porous media: implications for the Earth's mantle and sedimentary basins. J Geophys Res. (1997) 102:14821–14. 10.1029/97JB00996
13.
Romanov D Gabrovšek F Dreybrodt W . Dam sites in soluble rocks: a model of increasing leakage by dissolutional widening of fractures beneath a dam. Eng Geol. (2003) 70:17–35. 10.1016/S0013-7952(03)00073-5
14.
Michael K Golab A Shulakova V Ennis-King J Allinson G Sharma S et al . Geological storage of CO2 in saline aquifers review of the experience from existing storage operations. Int J Greenh Gas Con. (2010) 4:659–67. 10.1016/j.ijggc.2009.12.011
15.
Fredd CN Fogler HS . Influence of transport and reaction on wormhole formation in porous media. AIChE J. (1998) 44:1933–49. 10.1002/aic.690440902
16.
Lake LW Liang X Edgar TF Al-Yousef A Sayarpour M Weber D et al . Optimization of oil production based on a capacitance model of production and injection rates, SPE-107713-MS. In: Hydrocarbon Economics and Evaluation Symposium. Dallas, TX: Society of Petroleum Engineers. (2007). 10.2118/107713-MS
17.
Portier S Vuataz FD Nami P Sanjuan B Gérard A . Chemical stimulation techniques for geothermal wells: experiments on the three-well EGS system at Soultz-sous-Forêts, France. Geothermics. (2009) 38:349–59. 10.1016/j.geothermics.2009.07.001
18.
Neuville A Toussaint R Schmittbuhl J . Fracture roughness and thermal exchange: a case study at Soultz-sous-Forêts. Comptes Rendus Geoscience. (2010) 342:616–25. 10.1016/j.crte.2009.03.006
19.
Ledésert BA Hébert RL . The Soultz-sous-Forêts-enhanced geothermal system: a granitic basement used as a heat exchanger to produce electricity. In: Heat Exchangers-Basics Design Applications, J. Mitrovic, editor. IntechOpen (2012).
20.
Chadam J Hoff D Merino E Ortoleva P Sen A . Reactive infiltration instabilities. IMA J Appl Math. (1986) 36:207–21. 10.1093/imamat/36.3.207
21.
Szymczak P Ladd AJC . Reactive-infiltration instabilities in rocks. Part 2. Dissolution of a porous matrix. J Fluid Mech. (2014) 738:591–630. 10.1017/jfm.2013.586
22.
Szymczak P Ladd AJC . Reactive-infiltration instabilities in rocks. Fracture dissolution. J Fluid Mech. (2012) 702:239–64. 10.1017/jfm.2012.174
23.
Bekri S Thovert J Adler P . Dissolution of porous media. Chem Eng Sci. (1995) 50:2765–91. 10.1016/0009-2509(95)00121-K
24.
Budek A Szymczak P . Network models of dissolution of porous media. Phys Rev E. (2012) 86:056318. 10.1103/PhysRevE.86.056318
25.
Kalia N Balakotaiah V . Modeling and analysis of wormhole formation in reactive dissolution of carbonate rocks. Chem Eng Sci. (2007) 62:919–28. 10.1016/j.ces.2006.10.021
26.
Panga MK Ziauddin M Balakotaiah V . Two-scale continuum model for simulation of wormholes in carbonate acidization. AIChE J. (2005) 51:3231–48. 10.1002/aic.10574
27.
Zhang C Kang Q Wang X Zilles JL Muller RH Werth CJ . Effects of pore-scale heterogeneity and transverse mixing on bacterial growth in porous media. Environ Sci Technol. (2010) 44:3085–92. 10.1021/es903396h
28.
Szymczak P Ladd AJC . Wormhole formation in dissolving fractures. J Geophys Res Solar Earth. (2009) 114:B06203. 10.1029/2008JB006122
29.
Szymczak P Ladd AJC . Instabilities in the dissolution of a porous matrix. Geophys Res Lett. (2011) 38:L07403. 10.1029/2011GL046720
30.
Soulaine C Roman S Kovscek A Tchelepi HA . Mineral dissolution and wormholing from a pore-scale perspective. J Fluid Mech. (2017) 827:457–83. 10.1017/jfm.2017.499
31.
Starchenko V Ladd AJC . The development of wormholes in laboratory-scale fractures: perspectives from three-dimensional simulations. Water Resour Res. (2018). 54:7946–59. 10.1029/2018WR022948
32.
Osselin F Kondratiuk P Budek A Cybulski O Garstecki P Szymczak P . Microfluidic observation of the onset of reactive-infitration instability in an analog fracture. Geophys Res Lett. (2016) 43:6907–15. 10.1002/2016GL069261
33.
Hoefner M Fogler HS . Pore evolution and channel formation during flow and reaction in porous media. AIChE J. (1988) 34:45–54. 10.1002/aic.690340107
34.
McDuff D Shuchart CE Jackson S Postl D Brown JS et al . Understanding wormholes in carbonates: unprecedented experimental scale and 3-D visualization. J Petrol Techn. (2010) 62:78–81. 10.2118/129329-JPT
35.
Wang Y Hill A Schechter R . The optimum injection rate for matrix acidizing of carbonate formations , SPE-26578-MS. In: SPE Annual Technical Conference and Exhibition. Houston, TX: Society of Petroleum Engineers (1993). 10.2118/26578-MS
36.
Detwiler RL Glass RJ Bourcier WL . Experimental observations of fracture dissolution: the role of Peclet number on evolving aperture variability. Geophys Res Lett. (2003) 30:1648. 10.1029/2003GL017396
37.
Xu L Szymczak P Toussaint R Flekkøy EG Måløy KJ . Experimental observation of dissolution finger growth in radial geometry. Front Phys. (2019) 7:96. 10.3389/fphy.2019.00096
38.
Hanna RB Rajaram H . Influence of aperture variability on dissolutional growth of fissures in karst formations. Water Resour Res. (1998) 34:2843–53. 10.1029/98WR01528
39.
Cheung W Rajaram H . Dissolution finger growth in variable aperture fractures: role of the tip-region flow field. Geophys Res Lett. (2002) 29:32–1. 10.1029/2002GL015196
40.
Szymczak P Ladd AJC . Microscopic simulations of fracture dissolution. Geophys Res Lett. (2004) 31:L23606. 10.1029/2004GL021297
41.
Detwiler RL Rajaram H . Predicting dissolution patterns in variable aperture fractures: evaluation of an enhanced depth-averaged computational model. Water Resour Res. (2007) 43:W04403. 10.1029/2006WR005147
42.
Liu P Yao J Couples GD Ma J Iliev O . 3-D modelling and experimental comparison of reactive flow in carbonates under radial flow conditions. Sci Rep. (2017). 7:17711. 10.1038/s41598-017-18095-2
43.
Cohen CE Ding D Quintard M Bazin B . From pore scale to wellbore scale: impact of geometry on wormhole growth in carbonate acidization. Chem Eng Sci. (2008) 63:3088–99. 10.1016/j.ces.2008.03.021
44.
Powers TC . The properties of fresh concrete. New York, NY: John Wiley (1969).
45.
Colombani J Bert J . Holographic interferometry study of the dissolution and diffusion of gypsum in water. Geochim Cosmochim Acta. (2007) 71:1913–20. 10.1016/j.gca.2007.01.012
46.
Colombani J . Measurement of the pure dissolution rate constant of a mineral in water. Geochim Cosmochim Acta. (2008) 72:5634–40. 10.1016/j.gca.2008.09.007
47.
Bird R Stewart W Lightfoot E . Transport Phenomena, 513-542. New York, NY: John Wiley and Sons, Inc. (2001).
48.
Gupta N Balakotaiah V . Heat and mass transfer coefficients in catalytic monoliths. Chem Eng Sci. (2001) 56:4771–86. 10.1016/S0009-2509(01)00134-8
49.
Ebadian M Dong Z . Forced Convection, Internal Flow in Ducts. New York, NY: McGraw Hill (1998).
50.
Grodzki P Szymczak P . Reactive-infiltration instability in radial geometry: from dissolution fingers to star patterns. Phys Rev E. (2019) 100:033108. 10.1103/PhysRevE.100.033108
51.
Miranda J Widom M . Radial fingering in a Hele-Shaw cell: a weakly nonlinear analysis. Phys D Nonlinear Phenomena. (1998) 120:315–28. 10.1016/S0167-2789(98)00097-9
52.
Pecelerowicz M Szymczak P . Stabilizing effect of tip splitting on the interface motion. Phys Rev E. (2016) 94:062801. 10.1103/PhysRevE.94.062801
53.
Daccord G Touboul E Lenormand R . Chemical dissolution of a porous medium: limits of the fractal behaviour. Geoderma. (1989) 44:159–65. 10.1016/0016-7061(89)90025-6
54.
Huang T Zhu D Hill A . Prediction of wormhole population density in carbonate matrix acidizing, SPE-54723-MS. In: SPE European Formation Damage Conference. The Hague: Society of Petroleum Engineers (1999). 10.2118/54723-MS
55.
Cohen CE . Modélisation et Simulation de la Stimulation Acide des puits carbonatés. Institut National Polytechnique de Toulouse (2007).
56.
Saffman PG Taylor GI . The penetration of a fluid into a porous medium or Hele-Shaw cell containing a more viscous liquid. Proc R Soc Mat Phys Sci. (1958) 245:312–29. 10.1098/rspa.1958.0085
57.
Nittmann J Daccord G Stanley HE . Fractal growth viscous fingers: quantitative characterization of a fluid instability phenomenon. Nature. (1985) 314:141–4. 10.1038/314141a0
58.
Toussaint R Løvoll G Méheust Y Måløy KJ Schmittbuhl J . Influence of pore-scale disorder on viscous fingering during drainage. Eur Phys Lett. (2005) 71:583. 10.1209/epl/i2005-10136-9
59.
Upadhyay VK Szymczak P Ladd AJC . Initial conditions or emergence: what determines dissolution patterns in rough fractures?J Geophys Res Solar Earth. (2015) 120:6102–21. 10.1002/2015JB012233
60.
Kalia N Balakotaiah V . Effect of medium heterogeneities on reactive dissolution of carbonates. Chem Eng Sci. (2009) 64:376–90. 10.1016/j.ces.2008.10.026
Summary
Keywords
dissolution, phase diagram, reaction-infiltration, instability, Hele-Shaw cell
Citation
Xu L, Szymczak P, Toussaint R, Flekkøy EG and Måløy KJ (2020) Dissolution Phase Diagram in Radial Geometry. Front. Phys. 8:369. doi: 10.3389/fphy.2020.00369
Received
01 June 2020
Accepted
31 July 2020
Published
22 September 2020
Volume
8 - 2020
Edited by
Antonio F. Miguel, University of Evora, Portugal
Reviewed by
Hang Deng, Lawrence Berkeley National Laboratory, United States; Nuno A. M. Araújo, University of Lisbon, Portugal
Updates
Copyright
© 2020 Xu, Szymczak, Toussaint, Flekkøy and Måløy.
This is an open-access article distributed under the terms of the Creative Commons Attribution License (CC BY). The use, distribution or reproduction in other forums is permitted, provided the original author(s) and the copyright owner(s) are credited and that the original publication in this journal is cited, in accordance with accepted academic practice. No use, distribution or reproduction is permitted which does not comply with these terms.
*Correspondence: Le Xu le.xu@fys.uio.no
This article was submitted to Interdisciplinary Physics, a section of the journal Frontiers in Physics
Disclaimer
All claims expressed in this article are solely those of the authors and do not necessarily represent those of their affiliated organizations, or those of the publisher, the editors and the reviewers. Any product that may be evaluated in this article or claim that may be made by its manufacturer is not guaranteed or endorsed by the publisher.