- School of Management and Engineering, Nanjing University, Nanjing, China
Deep learning algorithms' powerful capabilities for extracting useful latent information give them the potential to outperform traditional financial models in solving problems of the stock market which is a complex system. In this paper, we explore the use of advanced deep learning algorithms for stock-index tracking. We partially replicate the CSI 300 Index by optimizing with respect to the difference between the returns of the tracking portfolio and the target index. We extract the complex non-linear relationship between index constituents and select a subset of constituents to construct a dynamic tracking portfolio by six well-known auto-encoders (single-hidden-layer undercomplete, sparse, contractive, stacked, denoising, and variational auto-encoders) that have been widely used in contexts other than stock-index tracking. Empirical results show that the auto-encoder-based strategies perform better than conventional ones when the tracking portfolio is constructed with a small number of stocks. Furthermore, strategies based on auto-encoders capable of learning high-capacity encodings of the input, such as sparse and denoising auto-encoders, have even better tracking performance. Our findings offer evidence that deep learning algorithms with explicitly designed hierarchical architectures are suitable for index tracking problems.
Introduction
The market index system has evolved with the development of the securities market. Financial products such as index funds, index futures, and index options emerge endlessly, indicating that indexing investment has won the favor of investors, especially institutional investors. Traditional investment based on the analysis of timing and stock fundamentals is an actively managed strategy, whereas indexing investment is passively managed. By constructing a portfolio to track a market index, investors expect to obtain the same return and volatility as the target index, with relatively lower risk and management cost, as well as better liquidity. The choice of how to construct a tracking portfolio (i.e., of an index tracking method) is crucial for the management of index funds, for hedging or arbitrage through index financial derivatives such as index futures, and for maximizing the performance of index investment generally. At the present time, the tracking methods utilized with stock index funds are fairly homogeneous but the tracking errors differ significantly. Therefore, there is great value in attempting to improve index tracking technology. In recent years, the rapid development of computer technologies and the discipline of quantitative finance especially make it possible to propose more effective index tracking methods.
The many index tracking strategies that have been put forward in theory and practice can be divided into full replication strategies and optimization strategies [1]. In the full replication method, all the constituent securities of the target index are purchased and allocated the same weights that they have in the index. Although full replication is easy to manage and operate and is highly consistent with the target index, it has many unavoidable defects. Its large portfolio size brings high transaction costs and large tracking errors [2]; some of the constituent securities may not be traded due to liquidity problems; the adverse effects of individual securities cannot be avoided; etc. In the optimization method, the historical data of the components are analyzed and a suitable number of assets for inclusion in the tracking portfolio are selected with the help of advanced algorithms. Thus, fewer securities are required to achieve the purpose of indexing investment [3]. Compared with full replication, the optimization method can significantly reduce management costs and increase tracking efficiency, advantages which have made it the focus of much current academic research.
Among the most widely applied approaches for selecting a subset of constituent stocks are market-value ranking, weight ranking, liquidity ranking [4], correlation coefficient ranking, random sampling, stratified sampling [5], and genetic algorithms [6]. However, these established stock selection approaches fail to collect and utilize adequately historical information about constituent stocks, target indexes, and the correlations between them. Therefore, it is necessary to develop new techniques.
The goal of index tracking is to make the return of the tracking portfolio as close as possible to the return of the target index. There are two main indicators used to evaluate the performance of index tracking: the standard deviation of the difference between the return of the tracking portfolio and that of the benchmark index [7] and the square root of the second-order moment of the difference [8]. There are also other, less common metrics for measuring tracking errors, such as Mean Absolute Deviation (MAD), Maximum Absolute Deviation (Max), Mean Absolute Downside Deviation (MADD), and Downside Maximum Absolute Deviation (DMax) [8]. The objective function can be constructed by minimizing one of the tracking errors defined above; the weight allocations of the tracking portfolio can then be obtained. When the tracking error is defined as the square root of second-order moment of the return difference, minimizing it requires a quadric programming model, and therefore its optimal solution can be found by best linear unbiased estimation (BLUE) [9], a standard econometric method. We will use this model to construct a tracking portfolio.
Since Markowitz [10] first proposed the mean-variance model, the measurement of index tracking errors and optimal replication methods have generated an extensive literature. For example, Roll [11] studies partial replication of the index by optimizing with respect to the volatility of the tracking error based on Markowitz's mean-variance model. Ammann and Tobler [12] present four suitable decompositions of tracking error variance. Dunis and Ho [13] introduce the concept of co-integration into the problem of index tracking optimization and obtain good tracking performance. Chiam et al. [14] build a multi-objective evolutionary system that can simultaneously optimize tracking performance and transaction cost to track the index. Filippi et al. [15] focuses on the problem of index tracking with consideration of the expected excess return, using a bi-objective approach.
Machine learning algorithms have made dramatic progress over the past four decades, and applications for them have been found in various disciplines, including financial asset management. The tools of machine learning have notable advantages in solving asset management problems. Asset managers can use machine learning techniques to identify underlying assets by discovering new patterns in a complex system and immediately make investment decisions based these insights. Further, machine learning algorithms enable new forms of data, such as data in graphic and sound formats, to be used as input to models, helping investment managers better analyze the market trend. In addition, machine learning algorithms may also reduce the negative impact of human subjective biases on investment decisions. Consequently, a growing body of research takes advantage of machine learning algorithms to study asset management or index tracking. Focardi and Fabozzi [16] propose to use clustering for constructing index tracking portfolios. They cluster co-integrated stocks based on Euclidean distances between stock price series and select one stock from each cluster to include in the tracking portfolio. Yang et al. [17] study the index-tracking problem by applying a support-vector machine model. Their empirical results show the model performs robustly on tracking the Hang Seng Index (HSI). Jeurissen and Berg [18] use a hybrid genetic algorithm, where each chromosome represents a subset of the stocks, to address the problem of stock index tracking by partial replication. A backpropagation-based neural network has been built by Zorin and Borisov [19] to form full replication of the stock index (although the tracking performance is not as good as expected). Fernández and Gómez [20] propose a heuristic solution for the portfolio selection problem based on the Hopfield network, but their results demonstrate no superiority over other heuristic models. By analyzing data from the Brazilian stock market, Freitas et al. [21] find a neural network model that outperforms the Markowitz's mean-variance model in portfolio optimization. Chen et al. [22] propose a flexible neural tree ensemble model to predict the NASDAQ-100 and S&P CNX NIFTY stock indexes, achieving reliable forecast performance. Wu et al. [23] use the non-negative-lasso method to fit and predict the CSI 300 Index with short-selling constraints; the results indicate that non-negative lasso can achieve a small tracking error.
Recently, with the rapid development of deep-learning technology, methods based on artificial intelligence have enjoyed unprecedented popularity [24]. One approach involves applying deep learning algorithms to the problem of index replication since the stock market is a complex system. A portfolio construction approach based on deep learning is first proposed in academia by Heaton et al. [25]. Ouyang et al. [26] have subsequently expanded this framework by including a dynamic asset-weight calculation method and implemented this model to track the HSI. However, their optimized asset weights may become negative, contrary to traditional asset allocation implementations. In order to accomplish partial replication, both Heaton et al. [25] and Ouyang et al. [26] select stocks by measuring the Euclidean distance between the original returns and the reconstructed returns of the index components using auto-encoders, which are the core elements of their frameworks.
Kim and Kim [27] argue that such an asset selection criterion is artificial. They modify it by constructing an auto-encoder in such a way that the deepest hidden layer has only one node (a proxy for the market index) and measuring the similarity of this latent representation to individual asset returns. We disagree with this approach. If an auto-encoder uses non-linear activation functions, then the deepest latent representations are non-linear combinations of the input original asset returns and capture some complex abstract features of the market index. Although these features can represent the market index, it is generally difficult to find their corresponding economic meanings. The candidate asset returns' similarities to these abstract features are not equal or even related to their similarities to the target index returns. A selection criterion based on this measure would therefore seem to be meaningless. Moreover, the extremely contractive structure of the auto-encoder with a single-node deepest latent layer may result in excessive loss of input information. None of the above three papers [25–27] suggests that the index tracking approach based on deep learning algorithms can outperform traditional index tracking techniques. Evidence is needed that deep learning is sufficiently advanced to handle index tracking problems. Moreover, various auto-encoders with more complex structures and better properties have been developed; it is reasonable to ask whether they can improve the performance of stock selection.
Based on the framework proposed by Heaton et al. [25], this paper investigates the applications of various auto-encoder deep-learning architectures in selecting representative stocks from the index constituents. The stocks are also selected by measuring the Euclidean distance between the original returns and the reconstructed ones. We then build dynamic tracking portfolios with the selected stocks to partially replicate the return of the index and evaluate their tracking performances. This article differs from Heaton et al. [25] and other related papers in several respects. First, we examine the effectiveness not only of the single-hidden-layer undercomplete auto-encoder but also of five other auto-encoders widely used in academe and industry, including the stacked auto-encoder and the denoising auto-encoder. Second, we propose a method for constructing dynamic tracking portfolios. The weights of the stocks in the tracking portfolio are calculated and adjusted periodically. This is more feasible and appropriate for practical indexing investment than what is done in other deep-learning methods. Third, we introduce two conventional stock selection strategies (weight ranking and market-value ranking) in addition to the strategies implemented by auto-encoders. The tracking performances of all these strategies in selecting various numbers of stocks are contrasted to confirm the advantages of applying auto-encoders.
The rest of the paper is organized as follows: section Methodology outlines the related algorithms and how they will be implemented. Section Empirical Analysis details our experimental setups for index tracking and presents the empirical results and discussion. Section Conclusions concludes the paper.
Methodology
Stock Selection Using Auto-Encoders
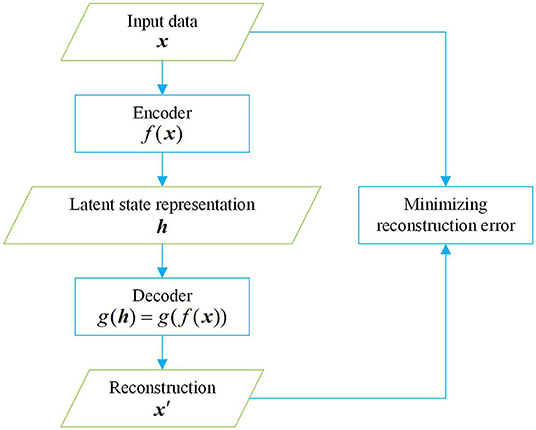
Auto-encoders are a special case of feedforward neural networks [28]. They are generally used for dimensionality reduction and feature extraction. Recently, they have also been employed as generative models to produce, for example, pictures. Unlike other feedforward neural networks, auto-encoders use unsupervised learning; their task is to copy the input to the output. An auto-encoder is composed of an encoder and a decoder. In Figure 1, x represents the input data; f(x) represents the encoder, forming a hidden layer h that discovers some latent state representation of the input; and g(h) = g(f(x)) represents the decoder, which produces a reconstruction x′. In general, the learning process of an auto-encoder can be described as minimizing the reconstruction error , which is defined as the difference between x and x′. The output of an auto-encoder is worthless if it is simply a copy of the input. Auto-encoders are prevented from replicating the input completely by imposing constraints on the hidden layers, such as limiting the number of hidden units and adding regularizers, so that latent attributes of the input data can be learned and described.
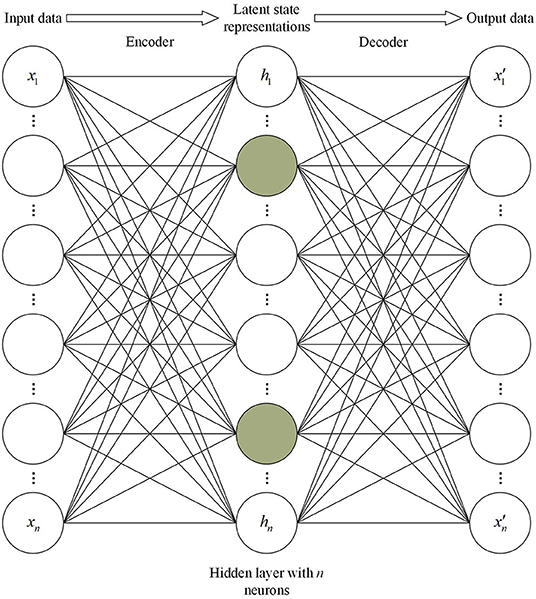
A common way to obtain useful features from an auto-encoder is to require the dimension of h to be smaller than x. An auto-encoder with this bottleneck structure is called an undercomplete auto-encoder. Consider first a single-hidden-layer undercomplete auto-encoder that contains one hidden layer with five neurons, consistent with Heaton et al. [25]. Its architecture is shown in Figure 2. Given a training batch D = {x(1), x(2), …, x(m)} containing m samples, the input of a single-hidden-layer undercomplete auto-encoder is , a vector representing n index component stock returns on a certain trading day. Similarly, the output is . The input x is mapped to h which is a vector of hidden units through the encoder. The subsequent decoder maps h to the output vector x′ to reconstruct x. The two steps can be written
where W1, W2 represent the weights of a linear transformation; b1, b2 are the biases; and f(·) is an activation function. Frequently used activation functions are sigmoid (1/(1 + e−x)) [29, 30], hyperbolic tangent (tanh(x)) [31], or rectified linear units (ReLU) (max{0, x}) [32–34]. In this paper, f(·) is set to be a ReLU function, because ReLU solves the gradient vanishing problem (in the positive interval) with a high speed of convergence and calculation compared to other activation functions. When the activation functions are linear and the loss function is the mean squared error, the action of the single-hidden-layer undercomplete auto-encoder is equivalent to Principal Component Analysis (PCA) [35]. In addition, we do linear transformation other than use non-linear activation functions on the output layer to make the output zero-centered. The characteristics of the output are thereby kept consistent with the input data.
The network of the single-hidden-layer undercomplete auto-encoder is trained by minimize the reconstruction error , i.e., the two-norm difference between the input vector and the output vector:
Back-propagation is used for the solution of Equation (3), with the popular gradient descent optimization algorithm called Adaptive Moment Estimation (Adam) [36]. (Unless otherwise stated, in the constructions of other auto-encoder models in this paper, the designs of the input and output vectors, the activation functions of the hidden layers, the loss functions, and the parameter-optimization algorithms are consistent with those of the single-hidden-layer undercomplete auto-encoder).
We already know that undercomplete auto-encoders can learn the most significant features of data distribution. However, if these auto-encoders are given too much capacity, they cannot learn any useful information. Regularized auto-encoders can solve this problem by imposing particular forms of regularization on the networks in order to encourage the models to have better generalization abilities rather than limiting their capacity. Sparse auto-encoders [37, 38] are a common kind of regularized auto-encoders. A sparse auto-encoder suppresses the activation of most neurons in the hidden layer by adding a sparsity penalty in the loss function, thereby providing another method of knowledge compression without reducing the number of nodes in the hidden layer. The architecture of the sparse auto-encoder applied in this paper is shown in Figure 3. The hidden layer has the same dimension as the input and output layers. The light-colored circles in the hidden layer represent suppressed neurons, while the dark-colored circles represent activated neurons. Since the activation of neurons is data-driven, the sparse auto-encoder can obtain specific feature representations for different input data. The network's capacity is limited to prevent excessive memorizing of input data, while the capacity to extract data features is not limited. There are two common ways of constructing the sparsity penalty: L1 regularization [39] and Kullback–Leibler (KL) divergence [40]. In this paper, we use L1 regularization. The loss function for training our sparse auto-encoder is given by
where the second term penalizes the output value of the hidden layer, scaled by a tuning parameter λ.
We also consider another regularized auto-encoder, the contractive auto-encoder [41], which is designed to make the learned feature representation insensitive to small changes around the training examples. This is accomplished by penalizing instances where a small change in the input results in a large change in the encoding space. Thus, the loss function is
where the penalty term is the squared Frobenius norm (sum of squared elements) of the Jacobian matrix for the hidden layer outputs with respect to the input observations. Although the contractive auto-encoder regularization criterion is trivial to calculate in the case of a single hidden layer auto-encoder, it becomes much more difficult in the case of deeper auto-encoders. Therefore, the contractive auto-encoder used in this paper adopts the same structure as the single-hidden-layer undercomplete auto-encoder mentioned above. Since we employ ReLU as the activation function on the hidden layer, the regularization criterion can be given the following analytical form:
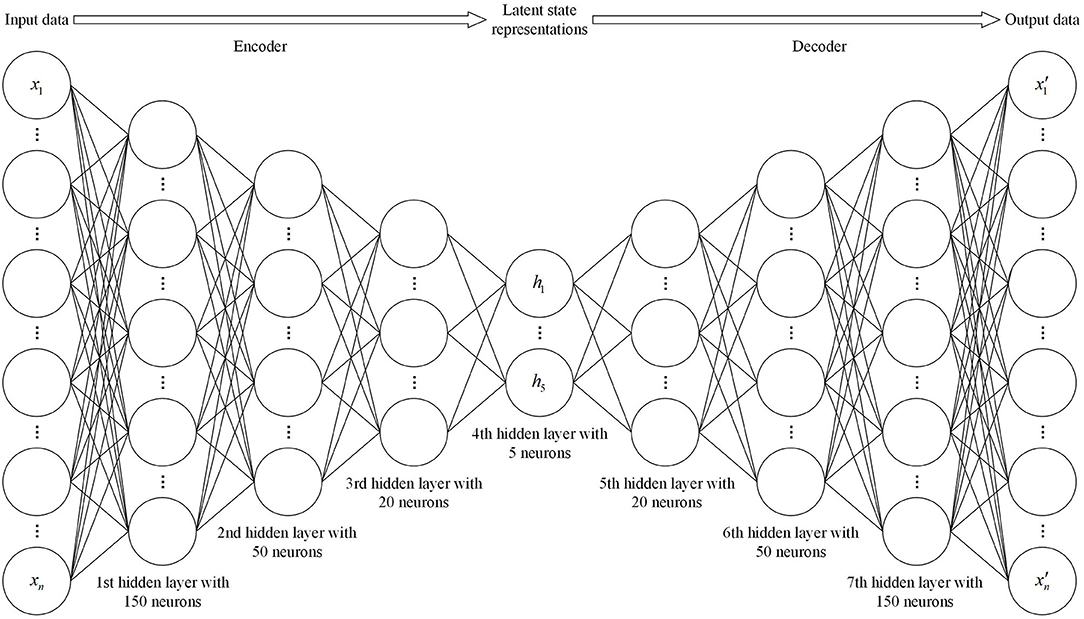
Auto-encoders are not required to be composed of a single-layer encoder and a single-layer decoder. In fact, deep auto-encoders yield much better compression than corresponding shallow auto-encoders [42]. The general method for training a deep auto-encoder consists of training a stack of shallow auto-encoders so as to pretrain the deep architecture. For this reason, deep autoencoders are also called stacked auto-encoders. The stacked auto-encoder employed in this paper is built with the structure shown in Figure 4, where the numbers of hidden layers and neurons in each layer are set by trial and error.
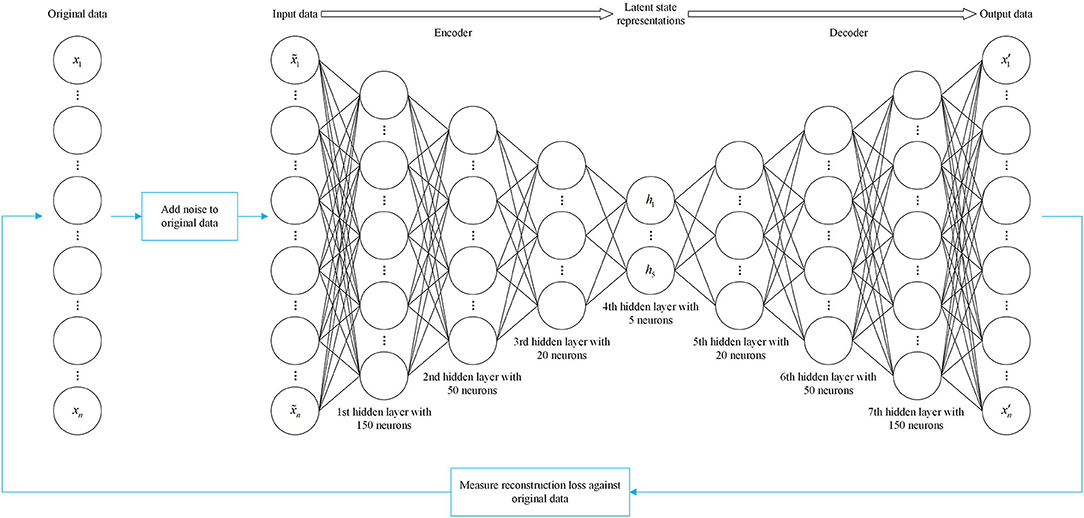
Till now, the input and output of the auto-encoders we have introduced are identical. Such models may not perform well on a testing set where the testing and training data do not exhibit the same distribution. The denoising auto-encoder [43] provides remedies for this deficiency. Denoising auto-encoders receive as input data that have been corrupted by some form of noise, and are trained to reconstruct the uncorrupted data as their output. After denoising training, the network is forced to learn more robust invariant features and obtain more effective representations of the input. This is very similar to a contractive auto-encoder in the sense that the noise is considered a series of small perturbations to the input. The difference is that contractive auto-encoders make the feature extraction function resist small perturbations of the input, while denoising auto-encoders make the reconstruction function resist them [44]. The initial input can be corrupted by adding Gaussian noise or stochastically discarding certain features. The denoising auto-encoder employed in this paper is constructed with the same architecture as the stacked auto-encoder. The only difference is that the input is the corrupted data , as shown in Figure 5, and given by
where represents a multivariate standard normal distribution with a diagonal covariance structure, and η denotes noise intensity. The loss function for the denoising auto-encoder still computes the two-norm difference between the output vector x′, and the original data x.
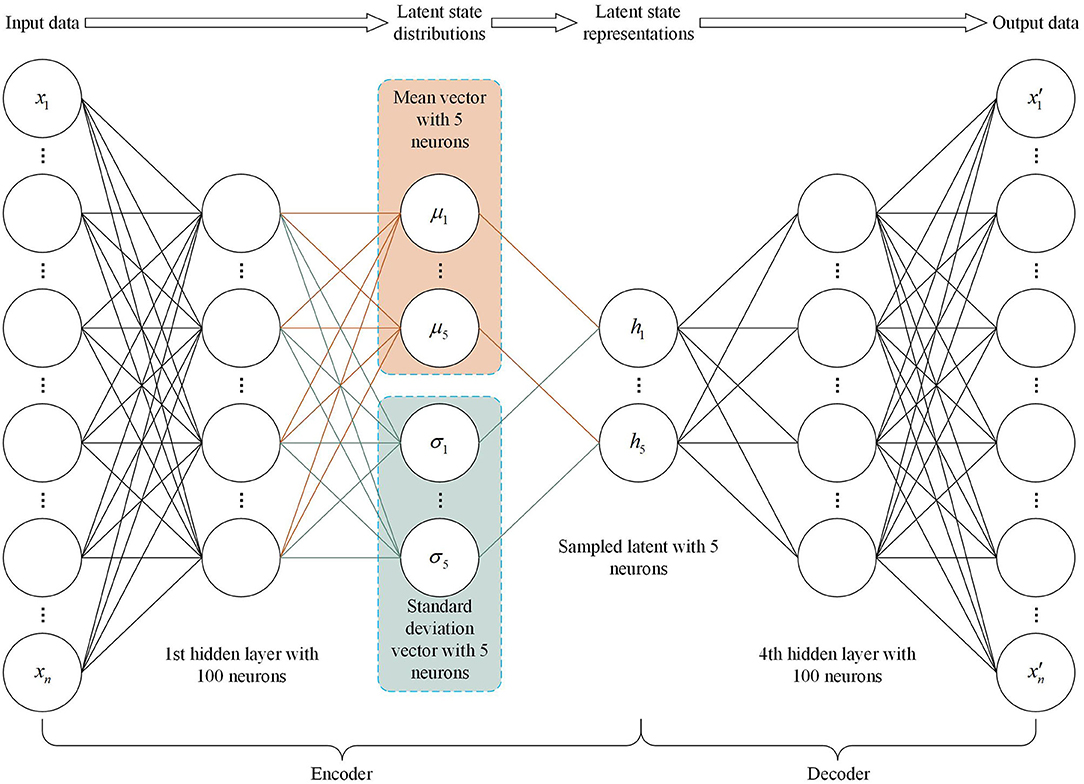
The decoder networks built by the auto-encoders we have introduced above output a single value to describe each latent attribute. However, sometimes we hope to learn a probability distribution for each latent attribute to produce a better generalization and ensure that the latent space has properties that enable the generative process. This goal can be achieved by applying a well-known generative model, the variational auto-encoder [45, 46]. The special structure of the variational auto-encoder designed for the purpose of this paper is shown in Figure 6. Its encoder outputs parameters describing a distribution for each dimension in the latent space. Here we assume that the prior distribution p(h) of the latent representation obeys a standard normal distribution, and the encoder therefore outputs two vectors describing the mean μ and variance σ2 of the latent state distribution. The decoder will then generate a latent vector h by sampling from a multivariate Gaussian model with a diagonal covariance matrix and reconstruct the original input. It is worth noting that a simple trick, reparametrization, is used when sampling. It can be expressed as
This allows us to sample from a unit Gaussian rather than sampling from the distribution , so as to ensure that the results of sampling are derivable and the error can be backpropagated through the network. The loss function for the variational auto-encoder is defined as
where
The first term in Equation (10) penalizes reconstruction errors (a feature also found in other auto-encoders). The second term encourages the learned latent-state distribution q(h|x) to be similar to the prior distribution p(h), which minimizes the KL divergence between these two distributions. The relative weights of these two items are controlled by a hyperparameter λ.
After the auto-encoders have been trained, their encoders output an n-dimensional vector that contains n different latent factors. These latent factors are obtained by the process of dimensionality reduction or compression and can be used to represent n independent implied abstract features of the stock index market. This technique is of great significance in finance. Traditional financial pricing models with shallow architectures (at most two layers) typically describe market information based on linear portfolios. For example, the capital asset pricing model (CAPM) proposed by Sharpe [47] assumes that the market return is expressed by a linear combination of asset returns. In the arbitrage pricing theory (APT) proposed by Rosenberg and McKibbon [48] and Ross [49], a layer of linear factors is used to perform pricing. These traditional financial theories also apply the idea of dimensionality reduction, as they reduce a dataset of n observations (returns or factors) to one parameter. However, while the implied market prices capture linear features of the input asset returns or factors, they ignore a large amount of latent information and the non-linear relationship between the assets in a complex system with fractality properties. For this reason, we use the auto-encoder model with a hierarchical structure of univariate activation functions of portfolios to make up for the shortcomings of traditional financial models.
The decoders then proceed to reconstruct the input individual stock-returns from the latent representations of the stock index market. However, this process involves compression encoding, and therefore will inevitably bring information loss. Following Heaton et al. [25], we calculate the information loss of each stock during the encoding-decoding process by using Equation (12) below to measure the similarity of the j-th stock with the stock index market (i.e., the total two-norm difference between every original stock return and the corresponding reconstructed one on the training batch):
The smaller is, the less information the j-th stock loses, and therefore the more similar it is to the stock index market. We rank the stocks by their communal information content, i.e., the amount of information that they share with the stock index market. Since it is not beneficial for improving index tracking performance to include too many stocks contributing the same information, we select a fixed number of the most-communal stocks plus a variable number of the least-communal stocks to construct a tracking portfolio.
In addition, in order to investigate the superiorities of auto-encoder-based stock selection strategies, we also adopt for comparison two conventional index-tracking stock-selection strategies: weight ranking and market-value ranking. We evaluate the tracking performance of these strategies under the same conditions.
Index Tracking Model
After selecting the representative stocks by the strategies above, we use an index tracking model to determine the investment weight allocated to each stock in the tracking portfolio, with the objective of minimizing tracking error and other constraints. The index tracking model established in this paper can be expressed as the following quadric programming problem:
where is a vector of the index return time series; denotes the return matrix of the selected stocks; and is a vector of stock weights. The objective function is complemented with a regularization term, , to avoid overfitting. In addition, the stock weights are kept non-negative, considering the short-selling restrictions in China's stock market.
Empirical Analysis
Data Description and Processing
We investigate partial replication of the CSI 300 Index with the index tracking strategies we have proposed. The CSI 300 Index is a barometer of China's stock market. Its main income accounts for more than seventy percent of the Chinese market, and it well-represents emerging markets throughout the world. We use the daily closing prices of the CSI 300 Index and its constituent stocks from the sample period January 1, 2010 through December 31, 2018 (comprising 2,187 trading days). Because the constituents of the CSI 300 Index are adjusted semi-annually, generally in early January and early July, we obtain the daily closing prices of all the stocks that have been included in the constituents during the sample period. We also record the mid-year and end-year market values of the constituents and their weights from 2010 to 2018, for use in weight ranking and market-value ranking.
To ensure the analysis results are accurate and reliable, we first clean the original pricing data by the following steps:
(i) Exclude the stocks if more than 20% of the pricing data is missing in the training set (defined in the next sub-section).
(ii) Exclude the stocks if all pricing data for the first 5 days and the last 5 days is missing in the training set.
(iii) Exclude the stocks if they have been ejected from the constituents of the CSI 300 Index during the training set and the following testing set (defined in the next sub-section).
(iv) Perform linear interpolation to fill the missing prices of the retained stocks.
We obtain the daily return time series ri, t for each stock or the index by calculating ri, t = (Pi, t − Pi, t−1)/Pi, t−1, where Pi, t denotes the daily closing price of stock (index) i on day t. Then all daily returns are standardized using z-score normalization as follows:
where and σi denote the mean and standard deviation of ri, t, respectively.
Design of Tracking Strategy
In order to construct a dynamically adjusted out-of-sample portfolio to track the index, the data sample is divided into training and testing sets by the rolling-window approach [50]. The rolling-window approach keeps the features of time series in the data, making it match the investment decision-making process in practice. The training set is used to train the stock selection model to select a subset of constituents. The index tracking model which takes the returns of the selected stocks as input is then also trained on the training set to obtain the stock weights. Afterwards, we construct a tracking portfolio with the selected stocks and corresponding weights obtained from the training set, and compute its portfolio return as well as the index tracking error on the testing set. We use the past four years' data as a training set. The dataset for the following 6 months is regarded as a testing set, in line with the adjustment frequency of the index constituents. This process continues for 5 years on each half-year from Jan. 2014 to Dec. 2018. For each stock selection model, there are in all 10 periods and 5 yearly index tracking results. The tracking procedure is illustrated in Figure 7.
Performance Measurement
We select stocks for each training set by employing eight selection approaches: six auto-encoder-based models, weight ranking, and market-value ranking. The auto-encoders are used to measure the degree of communal information between the stock index market and the constituent stocks. We then sort the constituents accordingly and select a subset of constituents that satisfy our requirements. As an example, Figures 8, 9 illustrate the stock 601618.SH, which shares the most communal information with the stock index market in the first period of the training sets (adopting the signal-hidden-layer undercomplete auto-encoder), and the stock 600015.SH, which shares the least. Obviously, stock 600015.SH loses much more information than stock 601618.SH during the encoding-decoding process. We already know that it is not necessary to add too much communal information to a portfolio. Following Heaton et al. [25], we select the 10 most communal stocks plus the n − 10 least communal stocks to construct a tracking portfolio, where n increases from 15 to 80 in steps of five. The weight (market value) ranking method is to select the n stocks with the largest half-yearly average weights (market values) for inclusion in a tracking portfolio.
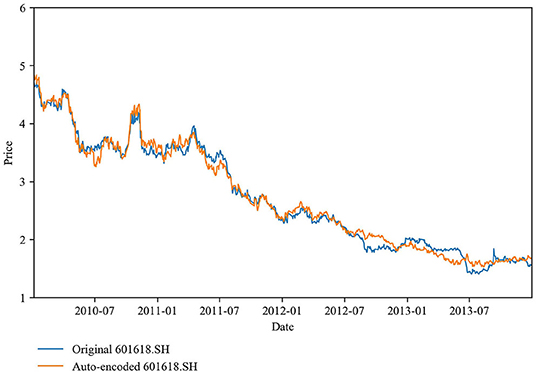
Figure 8. Stock (601618.SH) with the most communal information: the prices of the actual and auto-encoded stocks are nearly the same across the period shown.
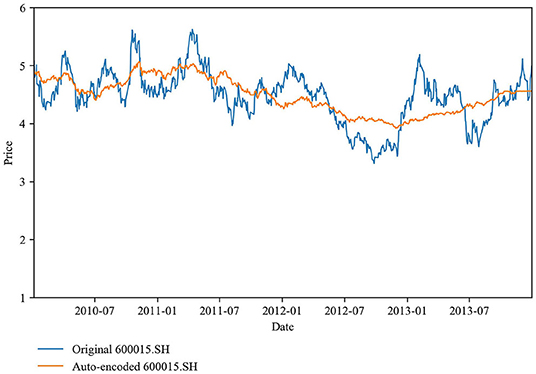
Figure 9. Stock (600015.SH) with the least communal information: the prices of the actual and auto-encoded stocks differ significantly across the period shown.
After determining the stocks required for inclusion in the tracking portfolio, we apply the index tracking model introduced in section Index Tracking Model to determine the stock weights and construct a tracking portfolio to partially replicate the CSI 300 Index. We evaluate the tracking errors on portfolios with the same number of stocks selected by different strategies. A smaller tracking error indicates better tracking performance of the stock selection strategy. The equation for calculating the average tracking error ATE is
where the T represents the total number of out-of-sample trading days (which spans from January 1, 2014 to December 31, 2018 and covers 10 adjustment periods as the tracking portfolio is adjusted every half-year); RIt and Rpt are the returns of the index and of the tracking portfolio at time t.
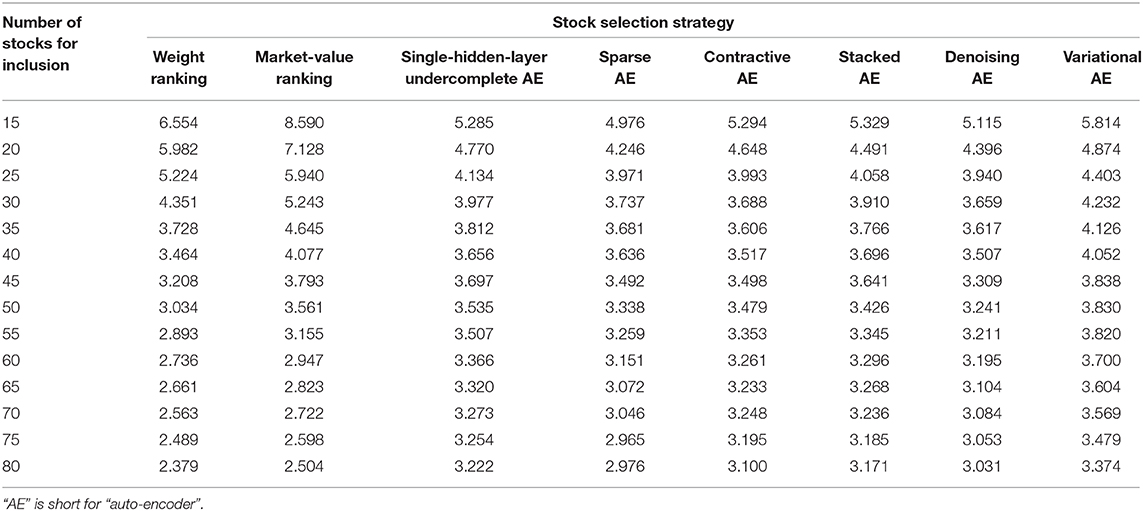
Table 1 shows the out-of-sample tracking error values for the CSI 300 Index. Figure 10 plots how the tracking error values change as a function of the number of stocks for all stock selection strategies. The tracking errors of all strategies decrease as the number of stocks in the tracking portfolio increases. In particular, the tracking error falls quickly when < 40 stocks are included in the portfolio. Furthermore, when the number of stocks included is < 30, the tracking errors of the six auto-encoder-based strategies are significantly smaller than those of the weight ranking and market-value ranking strategies. However, the falling rate of the tracking error slows down when over 40 stocks are required for inclusion. Moreover, the tracking errors of the six auto-encoder-based strategies exceed those of the weight ranking and the market-value ranking strategies when over 40 and 55 stocks are required for inclusion, respectively. We suggest the following explanations for the above results. When the tracking portfolio is constructed with many stocks selected by the weight ranking and market-value ranking strategies, the cumulative origin weight in the index of the selected stocks is larger, making the performance of the tracking portfolio closer to that of the index. While as the number of stocks in the tracking portfolio increases, the auto-encoder-based strategies append more stocks with medium communal information to the portfolio. The portfolios containing the most- and least-communal stocks are well able to reflect the market information. Thus, there is no benefit in having more medium-communal stocks.
Comparing the auto-encoder-based strategies to one another, the tracking errors of the strategies based on sparse, contractive, stacked, and denoising auto-encoders are almost always < that of the strategy based on single-hidden-layer undercomplete auto-encoder regardless of the number of stocks, although the difference is not sizeable. The explanation is that some of these four types of auto-encoders have a deeper structure that can learn more complex coding and deeper market information, while others are regularized to encourage the model to learn other features (except copying the input to the output) without limiting the model capacity by keeping the encoder and decoder shallow and the code size small. In either case, these auto-encoders can create more information-efficient representations of the market than the single-hidden-layer undercomplete auto-encoder, so that the stocks selected by the strategies based on them better represent the entire market.
However, the strategy based on the variational auto-encoder does not perform better than that based on single-hidden-layer undercomplete auto-encoder. This can also be explained. The purpose of an auto-encoder in the present work is to replicate the original input stock information from the latent space representing the compressed market information. However, a variational auto-encoder (mentioned in section Stock Selection Using Auto-Encoders, and normally used as a generative model) is meant to generate variations on an input vector from a continuous latent space: that is, its encoder only outputs a range of possible representations of the market, and these do not necessarily describe the market's current state. Therefore, the output reconstructed by the decoder is far from being a copy of the original input stock information. From this perspective, it is not surprising that the strategy based on the variational auto-encoder does not yield the desired result.
Although increasing the number of stocks in the tracking portfolio will reduce the tracking error, it will not significantly improve the tracking performance, while it will create additional transaction cost when the number of stocks included reaches a certain value. According to the previous analysis, the tracking error decreases rapidly as the number of stocks increases and the corresponding transaction cost is acceptable if a tracking portfolio is constructed with < 40 stocks. Therefore, the number of stocks in the tracking portfolio should be kept under 40 when balancing the tracking error and the transaction cost.
Considering the absolute tracking error values and the slope of the curves for the auto-encoder-based strategies in Figure 10, we find the tracking performance of auto-encoder-based strategies greatly surpasses that of conventional strategies for a 25-stock tracking portfolio. Figure 11 shows the out-of-sample cumulative return curves of the CSI 300 Index and the 25-stock tracking portfolios constructed by our proposed strategies. The relative advantages of auto-encoder-based stock selection strategies can be seen clearly. In particular, the tracking error of the market-value ranking strategy is 5.940 × 10⁻³, and that of the weight ranking strategy is 5.224 × 10⁻³. Among the six auto-encoder-based strategies, the tracking error of the denoising auto-encoder-based strategy is the smallest at 3.940 × 10⁻³, which is 33.67% lower than that of market-value ranking and 24.58% lower than that of weight ranking. The other five auto-encoder-based strategies also track better than the conventional strategies to varying degrees. Even the worst-performing auto-encoder-based strategy (the variational auto-encoder) has reductions of 25.88 and 15.72% compared to market-value ranking and weight ranking strategies, respectively. In conclusion, auto-encoder-based strategies outperform conventional strategies, provided that only a small number of stocks are required for inclusion in a tracking portfolio.
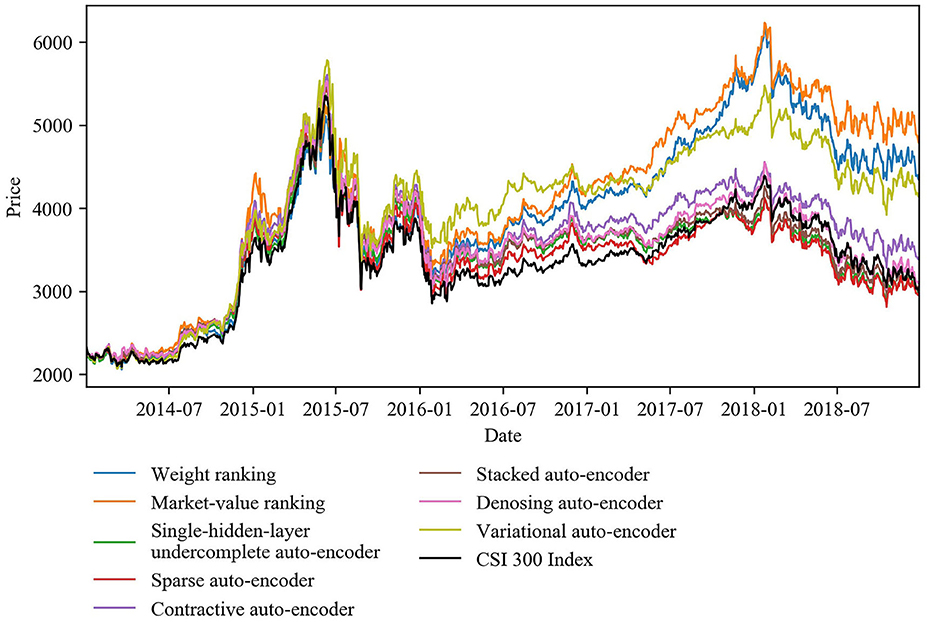
Figure 11. Out-of-sample cumulative return curves of the CSI 300 Index and the 25-stock tracking portfolios constructed by all strategies covered by this study.
Robust Test
To evaluate the sensitivity of these empirical results to changes in the data sample, we perform various robustness checks.
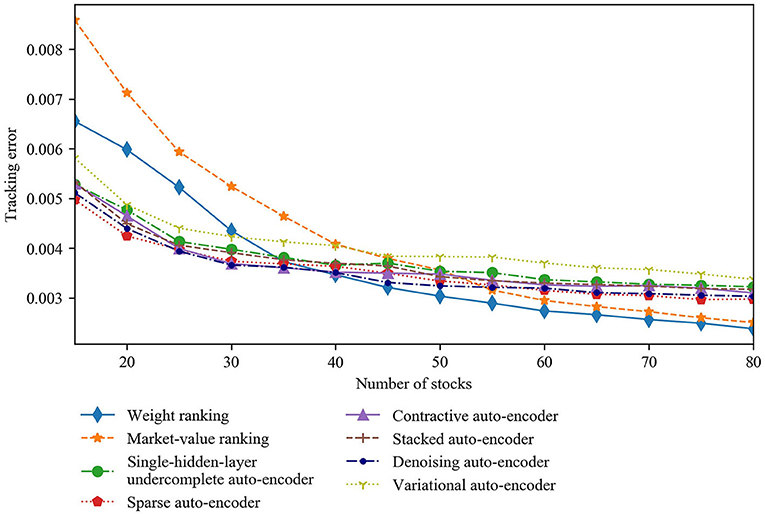
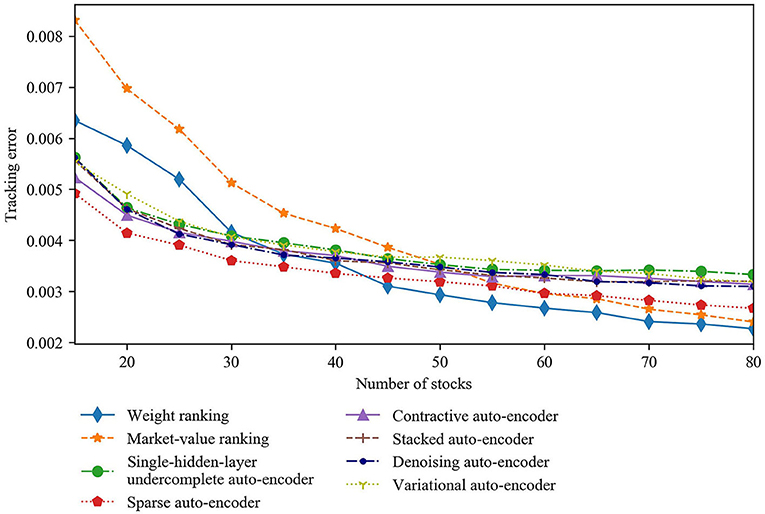
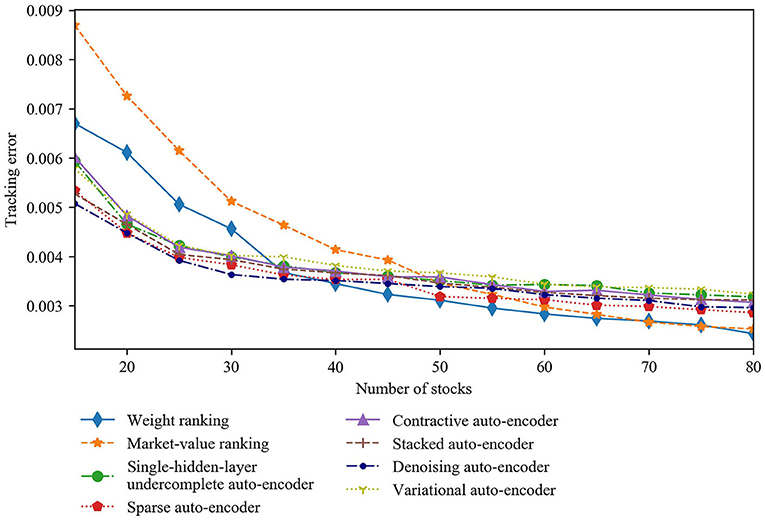
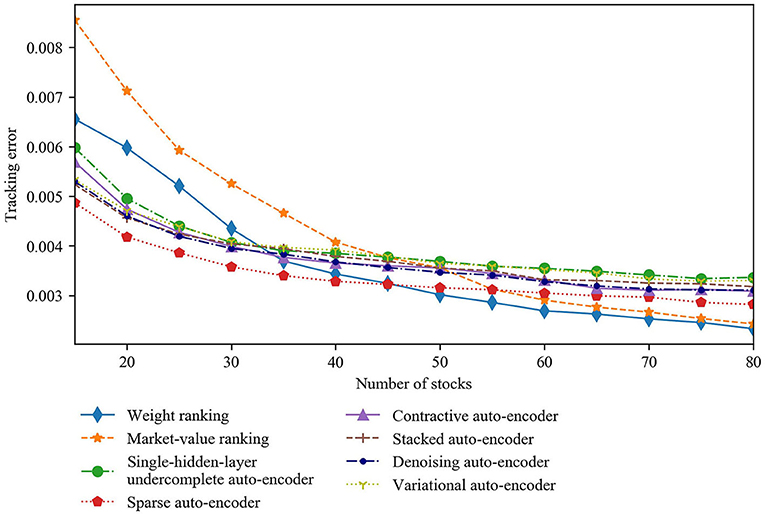
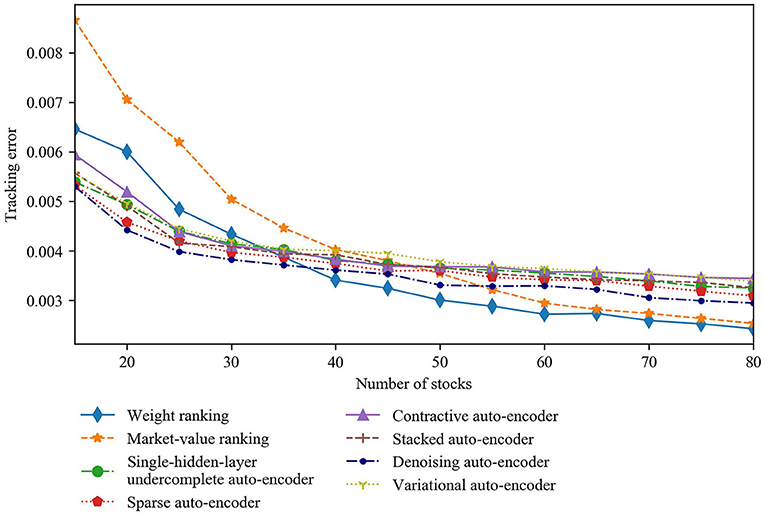
First, variations in length of the training set may have an impact on the results. As a robustness check, we analyze the tracking performance when each training set length is changed to 3 or 5 years, respectively. Keeping each testing set length at 6 months, the length of the out-of-sample period accordingly changes to 6 and 4 years, respectively. Figures 12, 13 illustrate how the curves of the tracking error vary with the number of stocks when each training set has a length of 3 and 5 years, respectively. The results reveal that the auto-encoder-based strategies tracks the index better than the conventional strategies when < 30 stocks are included in a tracking portfolio. In particular, the sparse auto-encoder-based strategy gets the lowest tracking error among all the auto-encoder-based strategies with 3-year training sets, whereas the denoising auto-encoder-based strategy performs best with 5-year training sets. In addition, the tracking error values change little in response to variations in the length of the training set. Thus, our base case results hold for these alternative training-set lengths.
Second, the rebalancing frequency, which is the reciprocal of the length of each testing set, will affect the performance of dynamic portfolio management. We compute quarterly and yearly rebalanced portfolios while keeping the training-set length unchanged to investigate the sensitivity of our results to alternative rebalancing frequencies. The results in Figures 14, 15 verify that our base case results are robust to these changes. In particular, with quarterly rebalancing, the sparse auto-encoder-based strategy tracks the index best among all auto-encoder-based strategies and brings greater improvement on conventional strategies' tracking performance compared to the base case results. In the case of a 25-stock portfolio, the tracking error of the sparse auto-encoder-based strategy is 3.861 × 10⁻³, which is 34.91% lower than the market-value ranking and 25.86% lower than the weight ranking. In contrast, with yearly rebalancing, the denoising auto-encoder-based strategy gets the best tracking performance. This proves that the sparse and denoising auto-encoder-based strategies are better at index tracking than the other four auto-encoder-based strategies.
Conclusions
We investigate the index tracking performance of deep learning-based tracking approaches. In particular, we use a variety of advanced auto-encoders: single-hidden-layer undercomplete, sparse, contractive, stacked, denoising, and variational auto-encoders to extract the complex non-linear relationship between stocks in a complex stock market system and construct dynamic tracking portfolios with subsets of stocks. Only one or two of these auto-encoders has previously been examined in the context of stock selection. Moreover, we evaluate for the first time whether auto-encoder-based strategies improve the tracking performance over the conventional strategies of weight ranking and market-value ranking.
In general, we find that whether auto-encoder-based strategies outperform conventional ones depends upon the number of stocks included in the tracking portfolio. When only a small number of stocks (probably < 30) are needed to construct a tracking portfolio, the auto-encoder-based strategies are generally superior to conventional strategies in terms of tracking performance. Furthermore, auto-encoders with particular architectures that can learn high-capacity, overcomplete encodings of the input, e.g., sparse and denoising auto-encoders, are better even than other auto-encoders at capturing complex latent representations of the market. The portfolios with stocks selected by these auto-encoders better replicate the index. However, if more than 40 stocks are required for inclusion, the conventional strategies still have the advantage.
Our findings suggest that deep learning algorithms are suitable for index tracking problems if the hierarchical architectures are explicitly designed. We expect these findings to be helpful in making asset-allocation decisions, especially, for indexing investment. Nonetheless, there are some limitations to the study: our analysis concerns a specific dataset; the impact of transaction costs on index tracking performance is not quantified; and hyper-parameter optimization is not well performed when constructing the models. Therefore, additional work with a more extensive dataset, optimized model settings, and greater practical realism would help to confirm our findings. This research can easily be extended to test other deep learning frameworks for index tracking in the future.
Data Availability Statement
Publicly available datasets were analyzed in this study. This data can be found at: the WIND database (http://www.wind.com.cn) provided by Shanghai Wind Information Co., Ltd.
Author Contributions
CZ: conceptualization, methodology, and formal analysis. CZ and FL: writing-original draft and data curation. LF: writing-review, editing, supervision, and funding acquisition. SL: formal analysis, writing-review, editing, and data curation. All authors contributed to the article and approved the submitted version.
Funding
This work was supported by the National Natural Science Foundation of China (grant numbers 71771116, 71720107001, and U1811462), the Late-stage Subsidy Project for Philosophical and Social Sciences Research Foundation of China's Ministry of Education (grant number 18JHQ058), and the Fundamental Research Funds for the Central Universities (grant number 0118/14370107).
Conflict of Interest
The authors declare that the research was conducted in the absence of any commercial or financial relationships that could be construed as a potential conflict of interest.
References
1. Frino A, Gallagher DR. Is index performance achievable? An analysis of Australian equity index funds. Abacus. (2002) 38:200–14. doi: 10.1111/1467-6281.00105
2. Masters SJ. The problem with emerging markets indexes. J Portf Manag. (1998) 24:93. doi: 10.3905/jpm.24.2.93
3. Bogle JC. Selecting equity mutual funds. J Portf Manag. (1992) 18:94. doi: 10.3905/jpm.1992.409402
4. Ouyang L, Wan L, Park C, Wang J, Ma Y. Ensemble RBF modeling technique for quality design. J Manage Sci Eng. (2019) 4:105–18. doi: 10.1016/j.jmse.2019.05.005
5. Larsen GA, Resnick BG. Empirical insights on indexing: how capitalization, stratification and weighting can affect tracking error. J Portf Manag. (1998) 25:51–60. doi: 10.3905/jpm.1998.409656
6. Shapcott J. Index Tracking: Genetic Algorithms for Investment Portfolio Selection. Edinburgh: Edinburgh Parallel Computing Centre (1992).
7. Pope PF, Yadav PK. Discovering errors in tracking error. J Portf Manag. (1994) 20:27–32. doi: 10.3905/jpm.1994.409471
8. Rudolf M, Wolter HJ, Zimmermann H. A linear model for tracking error minimization. J Bank Fin. (1999) 23:85–103. doi: 10.1016/S0378-4266(98)00076-4
9. Henderson CR. Best linear unbiased estimation and prediction under a selection model. Biometrics. (1975) 31:423–47. doi: 10.2307/2529430
10. Markowitz H. Portfolio selection. J Fin. (1952) 7:77–91. doi: 10.1111/j.1540-6261.1952.tb01525.x
11. Roll R. A mean/variance analysis of tracking error. J Portf Manag. (1992) 18:13–22. doi: 10.3905/jpm.1992.701922
12. Ammann M, Tobler J. Measurement and decomposition of tracking error variance. Forschungsgemeinschaft für Nationalökonomie an der Universität St Gallen St. Gallen (2000).
13. Dunis CL, Ho R. Cointegration portfolios of European equities for index tracking and market neutral strategies. J Asset Manag. (2005) 6:33–52. doi: 10.1057/palgrave.jam.2240164
14. Chiam SC, Tan KC, Al Mamun A. Dynamic index tracking via multi-objective evolutionary algorithm. Appl Comput. (2013) 13:3392–408. doi: 10.1016/j.asoc.2013.01.021
15. Filippi C, Guastaroba G, Speranza MG. A heuristic framework for the bi-objective enhanced index tracking problem. Omega. (2016) 65:122–37. doi: 10.1016/j.omega.2016.01.004
16. Focardi SM, Fabozzi FJ. A methodology for index tracking based on time-series clustering. Quant Fin. (2004) 4:417–25. doi: 10.1080/14697680400008668
17. Cai Z, Hong Y, Wang S. Econometric modeling and economic forecasting. J Manage Sci Eng. (2018) 3:178–82. doi: 10.3724/SP.J.1383.304010
18. Jeurissen R, van den Berg J. Optimized index tracking using a hybrid genetic algorithm. In: 2008 IEEE Congress on Evolutionary Computation (IEEE World Congress on Computational Intelligence). Hong Kong (2008).
19. Zorin A, Borisov A. Traditional and index tracking methods for portfolio construction by means of neural networks. In: Network, in Scientific Proceedings of Riga Technical University. Riga: Information Technology and Management Science (2002). p. 1–9.
20. Fernández A, Gómez S. Portfolio selection using neural networks. Comput Operations Res. (2007) 34:1177–91. doi: 10.1016/j.cor.2005.06.017
21. Freitas FD, De Souza AF, de Almeida AR. Prediction-based portfolio optimization model using neural networks. Neurocomputing. (2009) 72:2155–70. doi: 10.1016/j.neucom.2008.08.019
22. Chen Y, Yang B, Abraham A. Flexible neural trees ensemble for stock index modelling. Neurocomputing. (2007) 70:697–703. doi: 10.1016/j.neucom.2006.10.005
23. Wu L, Yang Y, Liu H. Nonnegative-lasso and application in index tracking. Comput Statis Data Anal. (2014) 70:116–26. doi: 10.1016/j.csda.2013.08.012
25. Heaton JB, Polson NG, Witte JH. Deep learning for finance: deep portfolios. Appl Stochastic Models Bus Ind. (2017) 33:3–12. doi: 10.1002/asmb.2209
26. Ouyang H, Zhang X, Yan H. Index tracking based on deep neural network. Cogn Syst Res. (2019) 57:107–14. doi: 10.1016/j.cogsys.2018.10.022
27. Kim S, Kim S. Index tracking through deep latent representation learning. Quan Fin. (2020) 20:639–52. doi: 10.1080/14697688.2019.1683599
28. Hinton GE, Zemel RS. Autoencoders, minimum description length and helmholtz free energy. In: Advances in Neural Information Processing Systems. Cambridge, MA: MIT Press (1993). p. 3–10.
29. Cybenko G. Approximation by superpositions of a sigmoidal function. Math Control Signal Syst. (1989) 2:303–14. doi: 10.1007/BF02551274
30. Barron AR. Universal approximation bounds for superpositions of a sigmoidal function. IEEE Trans Inform Theory. (1993) 39:930–45. doi: 10.1109/18.256500
31. Karlik B, Olgac AV. Performance analysis of various activation functions in generalized MLP architectures of neural networks. Int J Artif Intell Exp Syst. (2011) 1:111−22. Available online at: http://www.cscjournals.org/library/manuscriptinfo.php?mc=IJAE-26
32. Jarrett K, Kavukcuoglu K, Ranzato MA, LeCun Y. What is the best multi-stage architecture for object recognition? In: 2009 IEEE 12th International Conference on Computer Vision. Kyoto (2009). p. 2146–53. doi: 10.1109/ICCV.2009.5459469
33. Nair V, Hinton GE. Rectified linear units improve restricted boltzmann machines. In: Proceedings of the 27th International Conference on Machine Learning (ICML-10). Haifa (2010). p. 807–14.
34. Glorot X, Bordes A, Bengio Y. Deep sparse rectifier neural networks. In: Proceedings of the Fourteenth International Conference on Artificial Intelligence and Statistics, Fort Lauderdale, FL (2011). p. 315–23.
35. Wold S, Esbensen K, Geladi P. Principal component analysis. Chemometr Intell Lab Syst. (1987) 2:37–52. doi: 10.1016/0169-7439(87)80084-9
36. Kingma DP, Ba J. Adam: a method for stochastic optimization. arXiv [Preprint] arXiv:1412. (2014). Available online at: https://arxiv.org/abs/1412.6980
37. Ranzato MA, Poultney C, Chopra S, Cun YL. Efficient learning of sparse representations with an energy-based model. In: Advances in Neural Information Processing Systems. Cambrdige, MA: MIT Press (2007). p. 1137–44.
38. Ranzato MA, Boureau YL, Cun YL. Sparse feature learning for deep belief networks. In: Advances in Neural Information Processing Systems. Cambrdige, MA: MIT Press (2008). p. 1185–92.
39. Tibshirani R. Regression shrinkage and selection via the lasso. J Roy Stat Soc Ser B. (1996) 58:267–88. doi: 10.1111/j.2517-6161.1996.tb02080.x
40. Kullback S, Leibler RA. On information and sufficiency. Annals Math Stat. (1951) 22:79–86. doi: 10.1214/aoms/1177729694
41. Rifai S, Vincent P, Muller X, Glorot X, Bengio Y. Contractive auto-encoders: explicit invariance during feature extraction. In: Proceedings of the 28th International Conference on Machine Learning. Bellevue, WA (2011). p. 833–40.
42. Hinton GE, Salakhutdinov RR. Reducing the dimensionality of data with neural networks, Science. (2006) 313:504–7. doi: 10.1126/science.1127647
43. Vincent P, Larochelle H, Bengio Y, Manzagol PA. Extracting and composing robust features with denoising autoencoders. In: Proceedings of the 25th International Conference on Machine Learning. Helsinki (2008). p. 1096–103. doi: 10.1145/1390156.1390294
44. Alain G, Bengio Y. What regularized auto-encoders learn from the data-generating distribution. J Machine Learn Res. (2014) 15:3563–93. Available online at: https://jmlr.org/papers/v15/alain14a.html
45. Kingma DP, Welling M. Auto-encoding variational bayes. arXiv [Preprint] arXiv. (2013). Available online at: https://arxiv.org/abs/1312.6114
46. Kingma DP, Welling M. An introduction to variational autoencoders. Found Trends Mach Learn. (2019) 12:307–92. doi: 10.1561/2200000056
47. Sharpe WF. Capital asset prices: a theory of market equilibrium under conditions of risk. J Fin. (1964) 19:425–42. doi: 10.1111/j.1540-6261.1964.tb02865.x
48. Rosenberg B, McKibben W. The prediction of systematic and specific risk in common stocks. J Fin Quant Anal. (1973) 8:317–33. doi: 10.2307/2330027
49. Ross SA. The arbitrage theory of capital asset pricing. J Econ Theory. (1976) 13:341–60. doi: 10.1016/0022-0531(76)90046-6
Keywords: stock-index tracking, complex system, deep learning, auto-encoders, non-linear relationship
Citation: Zhang C, Liang S, Lyu F and Fang L (2020) Stock-Index Tracking Optimization Using Auto-Encoders. Front. Phys. 8:388. doi: 10.3389/fphy.2020.00388
Received: 26 June 2020; Accepted: 10 August 2020;
Published: 17 September 2020.
Edited by:
Wei-Xing Zhou, East China University of Science and Technology, ChinaReviewed by:
Dehua Shen, Tianjin University, ChinaElie Bouri, Holy Spirit University of Kaslik, Lebanon
Copyright © 2020 Zhang, Liang, Lyu and Fang. This is an open-access article distributed under the terms of the Creative Commons Attribution License (CC BY). The use, distribution or reproduction in other forums is permitted, provided the original author(s) and the copyright owner(s) are credited and that the original publication in this journal is cited, in accordance with accepted academic practice. No use, distribution or reproduction is permitted which does not comply with these terms.
*Correspondence: Libing Fang, bGJmYW5nQG5qdS5lZHUuY24=
 Chi Zhang
 Shuang Liang
 Fei Lyu
 Libing Fang