 Francesca Luoni1,2
 Uli Weber1*
 Daria Boscolo1
 Marco Durante1,2
 Claire-Anne Reidel1,3
 Christoph Schuy1
 Klemens Zink4,5
 Felix Horst1,4
- 1Biophysics Department, GSI Helmholtzzentrum für Schwerionenforschung GmbH, Darmstadt, Germany
- 2Festkörperphysik Department, Technical University of Darmstadt, Darmstadt, Germany
- 3Université de Strasbourg, CNRS, IPHC UMR 7871, Strasbourg, France
- 4Institute of Medical Physics and Radiation Protection, Technische Hochschule Mittelhessen (THM) University of Applied Sciences, Giessen, Germany
- 5Marburger Ionenstrahl-Therapiezentrum (MIT), Albrecht-Kossel-Strasse, Marburg, Germany
Precise and reliable monitoring of the particle rate is of great importance at accelerator facilities worldwide. In this article we describe the standard beam monitor calibration currently employed at the multi-purpose experimental sites Cave A and Cave M at GSI, where intense highly energetic ion beams are routinely used for a wide variety of experiments. An absolute dose-to-water measurement is performed with an air-filled ionization chamber and transferred into a calibration per primary particle. This is necessary for the raster scanning system used to enable the irradiation of extended fields, required for biophysical experiments in the research fields of particle therapy or space radiation protection. The main focus of this work is to understand through Monte Carlo simulations whether the currently used dosimetry procedure is valid for all the ion species and energies that are provided at GSI Cave A and Cave M by the SIS18 synchrotron and that will be provided by the SIS100 at FAIR. With this aim the detailed geometry of the PTW 30013 Farmer ionization chamber currently used at GSI was implemented in the transport code FLUKA and the beam quality correction factor kQ for different energies and ion species was calculated. Further details about the robustness of the calibration are investigated as well, e.g., appropriate irradiation depth of biological samples. Evidence is presented that for ions above 1 GeV/u the kQ factor decreases due to the density effect, which modifies the water-to-air stopping power ratio at relativistic energies. These findings are of particular importance for future biophysics experiments with ion beams from the SIS100 in the framework of the FAIR project. For energies in the regime of several GeV/u the constant kQ value as used in common practice should be replaced with the energy-dependent correction factor provided in this work.
1. Introduction
The majority of radiation biophysics experiments require a beam application systems that can apply a defined and reliable absorbed dose. This is valid both for nuclear physics experiments and irradiations of biological samples. The accuracy of the dosimetry and of the absolute calibration of the beam application system directly translates into that of the experiment.
Radiobiological experiments typically aim on studying and understanding dose-response relationships for different radiation qualities and for various biological endpoints. At GSI, irradiations of biological samples in the research fields of particle therapy or space radiation protection are performed with high-energy heavy ions from the SIS18 synchrotron in Caves A and M, which are equipped with a magnetic scanning system that can deflect ion beams in horizontal and vertical directions. This so-called intensity modulated raster scanning method was developed at GSI as part of the carbon ion therapy pilot project [1]. When homogenous dose distributions are irradiated, the absorbed dose depends on the distance of the scan spots and the number of particles applied per spot. A large area parallel plate ionization chamber is typically used to monitor the beam intensity during the irradiation and to trigger the scanning control system for steering the beam to the next spot when the required particle number is reached. Optionally, especially when performing experiments related to radiotherapy, a position sensitive detector such as a multi wire proportional chamber is used to control the lateral beam position [2].
The beam monitor ionization chamber must be calibrated in terms of the number of primary particles. Adapted from ion-beam therapy, this calibration is typically performed indirectly via an absorbed dose-to-water measurement with an air-filled ionization chamber under defined reference conditions (field size, measurement depth). The calibration in terms of the absorbed dose can be transferred into a calibration in terms of primary particle via the primary fluence obtained by a radiation transport calculation [3, 4].
This beam monitor calibration method is very robust but bares some potential for systematic errors. The reason is that the procedure was developed for carbon ions in the energy range used in radiotherapy, i.e., 70 to 430 MeV/u, while radiobiological experiments performed in Cave A also make use of much heavier ions (typically up to 56Fe) and much higher energies, i.e., up to 1 GeV/u. Therefore, it is necessary to quantify the uncertainty that can result from this variation of the measurement conditions. Systematic errors in dose delivery can also occur if the samples are irradiated at a depth different from the reference depth used for the beam monitor calibration. Even a small difference between the two points can actually make a difference because the entrance channel of the depth dose distributions for heavy ions are not flat.
The aims of the present work are to quantify the accuracy of the beam monitor calibration currently performed at GSI and to investigate with Monte Carlo simulations if the method can be adapted to future radiobiological experiments at the FAIR facility, which will provide heavy ion beams with energies up to 10 GeV/u [5].
2. Methods and Materials
2.1. Raster Scanning System in GSI Caves A and M
In GSI Caves A and M a raster scanning system is used to irradiate samples with a defined fluence or dose, which can be delivered homogenously to a well-defined arbitrary area. The raster scanning system is used for both irradiation of biological samples and physics experiments, e.g., nuclear physics measurements or detector tests. The heavy ion pencil beams used for irradiations have an approximately Gaussian lateral profile with a FWHM (full-width-half-maximum) that typically ranges from about 4 to about 12 mm, depending on the ion species, their kinetic energy, the beam exit window and the magnet setting used. When samples are irradiated with the raster scanning system, the area is divided into a raster of scan spots having a typical distance of a few millimeters. When a homogenous field is irradiated, the scan spot distance must be smaller than the of the pencil beam to ensure that the Gaussian beam spots can add up to a homogeneous distribution. Once the irradiation is completed, the dose is homogeneous in the center of the irradiated area and falls off with a Gaussian-like profile at the edges. The homogeneous dose at the center of the field results from a homogeneous fluence Φ which can be calculated from Equation (1)
where N is the number of particles per scan spot and dscan is the scan spot distance. The scanning area has to be much larger than the width of the scan spot. It is recommended to keep the scan area 10-20 times larger than the beam FWHM, in order to avoid the outer halo-contributions of the pencil beam spot getting lost in the superposition of the beam spots [6]. For a free-in-air irradiation, assuming a monoenergetic ion beam and neglecting δ electron effects, the absorbed dose to water Dw (the typical dosimetric quantity in radiotherapy and radiobiology) can be estimated according to Equation (2)
where ρw is the density of water and S is the stopping power (energy loss per path length) of water for the ion used for the irradiation. If the irradiation is not done free-in-air, S must be calculated for the particle spectrum at the irradiation depth. However, this is not straightforward due to the complexity of the nuclear fragmentation reactions generating the mixed radiation field.
Since the beam is delivered in spills and the beam intensity is subject to statistical fluctuations coming from the slow extraction of the synchrotron, the delivery time for the required particle number N can vary from spot to spot. The number of ions delivered to the sample is monitored continuously and as soon as the number of ions required for one spot is reached, the beam is moved to the next spot by the scanning magnets. A large area parallel plate ionization chamber positioned in front of the beam exit window is typically used as beam monitor. Depending on the intensity, also a plastic scintillator for low particle rates or a secondary electron monitor (SEETRAM) for high rates can be used. The ionization chamber output signal is transferred into a current-to-frequency converter (IFC), which is an amplifier converting the current output from the parallel plate ionization chamber into digital pulses. One pulse corresponds to a certain charge quantum (e.g., 1 pC) depending on the set sensitivity range. The pulses are continuously generated, so that the output frequency is proportional to the current output from the ionization chamber, which is in turn proportional to the particle rate of the incoming beam. The IFC output is connected to the scanner control unit, which counts the number of pulses and moves the beam from spot to spot when the number of pulses corresponding to the number of particles per spot N is reached. The measurement chain is shown in Figure 1.
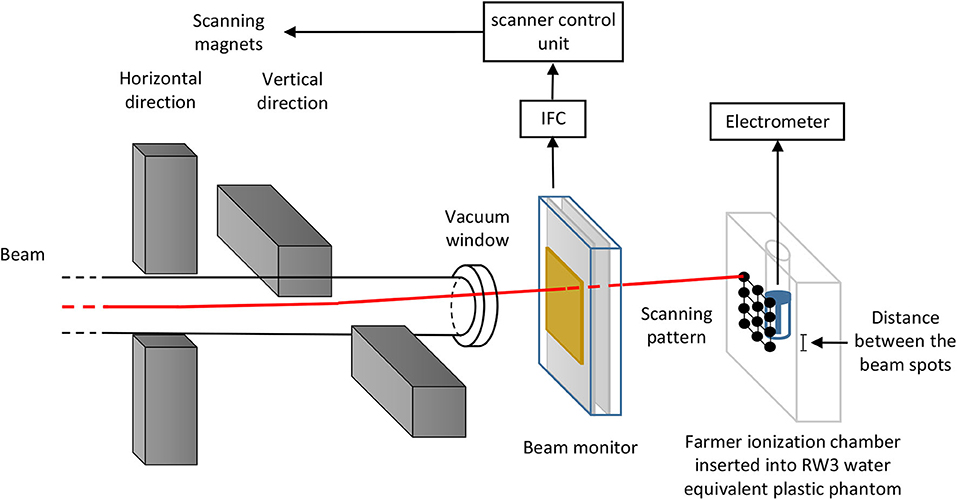
Figure 1. Schematic of the setup used in GSI cave A for the calibration of the beam monitor in terms of primary particles via an absolute dose measurement with a Farmer type ionization chamber in a water equivalent plastic phantom. Vertical and horizontal scanning magnets controlled by the scanner control unit deflect a pencil beam to scan over the irradiated sample. The scanner control unit gets an input signal from a current-to-frequency converter (IFC) coupled to the beam monitor, which in GSI Caves A and M is typically a large area parallel plate ionization chamber. The beam monitor measures the number of particles applied per spot, which is used to control the raster scanning system. The schematic is not to scale.
The system needs to be calibrated in terms of number of IFC pulses per number of ions transmitted through the monitor ionization chamber.
2.2. Beam Monitor Calibration
The monitor calibration factor has to be determined experimentally for every ion species at different energies and should be checked daily before the irradiations. Checking the monitor calibration is an important quality assurance task in particle therapy facilities [7, 8]. In principle the beam monitor can be calibrated with different methods [9]. Since the calibration is done in terms of the primary particle number, it could be performed by cross calibration with a particle counter or on basis of a charge or fluence measurement. The first method has the problem that the working intensity ranges of particle counters like plastic scintillators and the monitor ionization chamber are very different, while it is preferable to perform the calibration with the intensity actually used for irradiation of the samples. An instrument that is well-suited to measure the integral charge in an ion beam pulse is the Faraday cup. Some proton therapy centers use Faraday cups as the dosimetric standard for absolute calibration of the beam monitors [9–12]. A Faraday cup does not provide a dose information but directly the primary particle number if the beam is pure. However, Faraday cup measurements are rather sensitive to delta electrons, either scattered inside the collection volume from outside or vice versa. Those perturbations can be prevented e.g., by guard rings and magnetic fields [12] but for high energy beams they get more pronounced due to the increasing delta electron energies. Furthermore, for heavy ion beams there are some additional practical limitations concerning the use of Faraday cups, in particular due to the long range of secondary fragments created in nuclear reactions that would require very thick copper volumes to collect the entire charge carried by the beam. A calibration of the beam monitor can also be performed on basis of a fluence measurement using nuclear track etching detectors like CR39 [13] or fluorescent nuclear track detectors [14]. Before starting up the carbon ion therapy project at GSI, most radiobiological irradiations at Caves A and M were actually based on CR39. The monitor calibration for irradiations with low energy heavy ions at the GSI UNILAC is still being performed like this. However, for high energy heavy ion beams the CR39 etching technique has turned out to be not accurate enough. The main problems lie in the less pronounced tracks at high energy and in the track overlapping at high fluences.
The particle fluence is directly related to the absorbed dose (see Equation 2), therefore an absolute dose measurement can serve as an alternative method to calibrate the beam monitor in terms of primary particle number. Ionization chambers are stable to operate and give more reliable and reproducible measurement results than e.g., nuclear track detectors, especially at high particle beam rates (> 108 ions/s). Therefore, when the carbon therapy project at GSI was started, absolute dosimetry in terms of absorbed dose to water using thimble ionization chambers was established as the standard for ion beam therapy irradiations of patients and biological samples with high energy heavy ions [3, 4].
The IAEA TRS-398 code of practice gives basic recommendations on how to perform absolute dosimetry in terms of absorbed dose to water with air-filled ionization chambers for all kinds of radiotherapy beams [15]. Especially for protons, there have been a lot of recent investigations to further improve the proposed techniques and to establish a common standard [12, 16]. The method developed for carbon therapy at GSI (also applied almost identically at the clinical ion-beam therapy centers in Heidelberg and Marburg) makes use of a Farmer-type ionization chamber (PTW Farmer 30013) positioned at a low depth in a water-equivalent plastic (RW3) phantom [3, 4]. The signal of the Farmer chamber is read out with a high precision electrometer. At GSI Caves A and M a UNIDOS E universal dosimeter is used. The Farmer chamber is inserted into a 2 cm thick phantom made of water equivalent plastic (RW3) [3, 4]. The effective water equivalent measurement depth of the Farmer chamber in the phantom is 4.8 mm, to which the beam exit window, monitor chamber and air gap (typically about 2 mm of water equivalent depth) must be added. This depth is large enough to ensure δ electron equilibrium (the depth dose profile shows a build-up effect due to δ electrons in the first millimeters) but also low enough to approximate the beam as pure (with increasing depth more and more primary ions fragment into lighter ions). For the calibration measurements, the reference chamber is irradiated by a large scanned field (at least 5 × 5 cm2) which should preferably be re-scanned multiple times to achieve a homogeneous dose distribution. The absorbed dose to water at the reference depth per primary fluence has to be known to calibrate the beam monitor in terms of primary particle number (see Equation 2). The most precise way to obtain this relation is the calculation with a suitable radiation transport code (e.g., Monte Carlo codes like Geant4 [17] or FLUKA [18–20]), considering all materials in the beam line (vacuum exit window, beam monitors, air gaps, RW3 phantom).
Notably, systematic discrepancies, in the order of a few percent, between fluence measurements and absorbed dose to water measurements based on air-filled ionization chambers, have been reported [12–14]. Those deviations have not been fully explained yet. However, in GSI Caves A and M they rely on the usage of ionization chambers as it is the standard method in particle therapy, which is the main background of the research activities performed. In addition, recent water calorimetry experiments have shown good agreement with the ionization chamber concept [21, 22].
2.3. Dose Measurement and Correction Factors
The Farmer ionization chamber is a commonly used ionization chamber type for absolute dose measurements in radiotherapy. The one used in Caves A and M is a PTW TM30013 Farmer chamber, which consists of a vented cylindrical-shaped air volume (nominal volume 0.6 cm3) with a central electrode and is surrounded by a graphite electrode within a waterproof plastic housing. Further details about the Farmer chamber can be found in [15]. The ionization chamber is read out with a PTW UNIDOS E universal electrometer.
The following basic dosimetric equation describes how to determine the absorbed dose to water using an air-filled ionization chamber:
ND,w is the calibration factor in terms of absorbed dose to water provided by the manufacturer (converting the measured charge to absorbed dose to water), determined with 60Co photons at a water depth of 5 cm. ND,w is tracable to the secondary standard 60Co source of the PTW dosimetry company. kQ is the beam quality correction factor, which takes into account the different responses of the ionization chamber to the operational beam quality Q (e.g., heavy ions) and to the calibration quality Q0 (60Co photons). zref is the reference depth in water used for the beam monitor calibration. If a cylindrical ionization chamber is used for the dose measurement, not the reference point of the ionization chamber (central electrode) but the effective point of measurement has to be positioned at the reference depth. For proton and heavy ion dosimetry with cylindrical ionization chambers the effective point of measurement is located 0.75·r upstream of the reference point where r is the inner radius of the chamber [15]. Taking the effective point of measurement into account is of particular importance for the beam monitor calibration if the depth dose profile has a gradient at the measurement depth. Mcorr is the electrometer charge reading from the ionization chamber corrected for changes in air density, incomplete saturation and polarity effects. Details on those corrections are found in the existing dosimetry protocols (e.g., TRS-398 [15] or DIN-6801-1 [23]).
2.4. Dosimetry in GSI Caves A and M
In GSI Caves A and M on a daily basis, before the absolute dose measurement, the kTP correction factor accounting for changes in air density is determined. It takes into account differences in temperature and pressure between the air filling conditions in the cave and those during the calibration of the ionization chamber. kTP is determined according to the TRS-398 dosimetry potocol [15].
An irradiation plan for a certain dose is prepared assuming a theoretical calibration factor fe, which is then corrected according to the difference between the planned dose and the dose read out with the electrometer. This is how the beam monitor calibration is performed at GSI Caves A and M.
In the absence of calculations performed with a suitable radiation transport code, an estimation of the monitor calibration factor fe (beam particles per monitor pulse) can be obtained by:
F is the conversion factor of the current-to-frequency converter (charge per pulse from the IFC, e.g., 1 pF/pulse. E is the average energy deposited by a single beam particle in the active volume of the parallel plate ionization chamber [24], which can be estimated multiplying the linear energy transfer of the particle in the gas filling of the chamber by the thickness of the active volume of the chamber. The W-value is the mean energy required to form an ion pair in the detector gas [15], and e is the elementary charge. Examples of W-values given in the literature [25, 26] can be found in Table 1. In general, the W-value is specific for different detector gases and depends on the radiation quality, i.e., radiation type and energy. However, empirical observations show that for protons and heavy ions the W-value is rather independent of the ion type and energy at the high energies treated in this work [3, 27]. The values given for the gas mixture 80% argon and 20% carbon dioxide (volume percentages), which is the typical detector gas mixture used in the GSI beam monitor chambers, were obtained through the formula [28], where Ci are the mass concentrations of the gas components in the mixture.

Table 1. Examples of recommended W-values for protons and heavy ions in the gas mixtures typically filling the ionization chambers used at GSI Caves A and M.
Once the monitor calibration factor fe is determined, the free-in-air absorbed dose to water Dw can be related to the primary fluence through the following approximation:
n being the number of accumulated IFC pulses per beam spot before switching to the next spot.
2.5. Beam Quality Correction Factor kQ
The kQ correction factor is specific for the ionization chamber model and depends on the beam quality. In the TRS-398 dosimetry protocol [15] a table of recommended (theoretical) heavy ion kQ values for different ionization chamber types is given, however, it is not distinguished between different heavy ions due to the lack of data at the time of publication. For the PTW Farmer 30013 ionization chamber, a kQ = 1.032 is recommended. This is the value used for the monitor calibration that is performed before all radiobiological experiments at GSI Caves A and M. Since the kQ values given in TRS-398 are stated valid only for ions between 4He and 40Ar at energies between 100 and 450 MeV/u, but GSI also delivers heavier ions (e.g., 56Fe) with higher energies (up to 1 GeV/u), the validity of the kQ value requires further attention. Especially in view of the future FAIR facility where energies of up to 10 GeV/u will be available for radiobiological experiments, it is necessary to further investigate the assumption of an energy and ion independent kQ. In the TRS-398 protocol kQ is derived by Equation (6)
where Sw, air denotes the water-to-air stopping power ratio at the operational beam quality Q and at the calibration beam quality Q0 (60Co photons). Wair is the mean energy required to form an ion pair in air and p is the perturbation factor of the ionization chamber that accounts for its deviation from being an ideal Bragg-Gray detector [15]. For protons and heavy ions, TRS-398 assumes the detector perturbation to be negligible (pQ = 1).
Today advanced computational methods, in particular powerful Monte Carlo codes, are available to study the response of ionization chambers in different radiation fields [29–32]. The calculation of kQ factors by means of Monte Carlo simulation can be also described by Equation (7) [33, 34]:
where Dw is the absorbed dose scored in a small water voxel at the effective point of measurement of the ionization chamber and is the absorbed dose scored in the active air volume of the ionization chamber (modeled in full geometrical detail). The ratio of the Wair values is the same as in Equation (6) and must be obtained from experiments or from literature (in this work the values from the recent ICRU 90 publication [25] were used, see also Table 1).
Recently, a high precision measurement of the kQ value of the PTW 30013 Farmer chamber for 383 MeV/u 12C ions by means of water calorimetry has been performed at HIT, Heidelberg [21]. It is in good agreement with the TRS-398 recommended value.
2.6. Monte Carlo Simulations
Monte Carlo simulations using the FLUKA code (version 2011.2x.5) were performed to obtain ratios to calculate kQ correction factors according to Equation (7). Simulations were carried out for different ion species (1H, 4He, 12C, 40Ar, 56Fe) at different energies (350 MeV/u, 1 GeV/u, 4 GeV/u, 10 GeV/u) for a field size of 5 × 5 cm2. The geometry of the PTW 30013 Farmer chamber was modeled according to blueprints from the manufacturer (geometry with delta electron tracks shown in Figure 2) and it was positioned with the effective point of measurement at a water depth of 7 mm, a typical measurement depth at GSI Cave A (4.8 mm phantom depth plus about 2 mm vacuum window, monitor chamber and air gap). The mean dose in the active volume was scored in the air volume inside the chamber. The absorbed dose to water at the reference point Dw was obtained in a separate simulation where a small scoring voxel (0.2 cm3) made of water was positioned at the measurement depth.
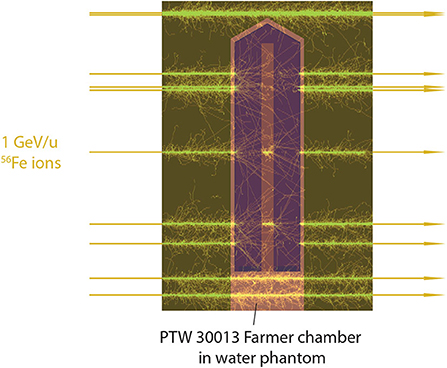
Figure 2. FLUKA simulation of the irradiation of a PTW 30013 Farmer ionization chamber in a water phantom with 1 GeV/u 56Fe ions. The tracks of the δ electrons produced by interaction of the primary ions with the phantom material are shown.
In FLUKA, charged particles can be transported down to 1 keV and their energy loss is treated with a condensed history approach. Single Coulomb scattering events are condensed in a multiple scattering algorithm. Hadron–nucleus collisions are treated via the PEANUT model while nucleus-nucleus collisions are treated via the BME for kinetic energies below 125 MeV/u and via the RQMD model for higher energies.
The transport settings were chosen to be the same as reported by Baumann et al. [33] because they were optimized specifically for ionization chamber calculations with heavy charged particles. All simulations were performed with full electromagnetic transport (photon and electron transport down to 1 keV) and with the physics models set to the highest precision level (e.g., full Rayleigh and Coulomb scatter corrections, heavy fragment evaporation and coalescence). Recently, a Fano cavity test performed by Lourenco et al. [35] showed that the FLUKA code passes the test within 0.15% if the step size in the multiple Coulomb scattering algorithm is set small enough compared to the dimensions of the cavity of interest. Therefore, in order to maximize the transport precision for the simulations of the energy deposition in the small cavities, the multiple Coulomb scattering was suppressed in these regions by adding the MULSOPT card to the FLUKA input file. Using this card, the minimum step length for multiple Coulomb scattering was increased by a factor of 10000 and single scattering was activated.
The material definitions of air, graphite and water were defined according to the ICRU 90 recommendations [25] (details reported by Baumann et al. [33]). For the other materials (e.g., PMMA, aluminum), the standard FLUKA definitions were used.
The most recent Wair values for heavy ions and 60Co photons from the ICRU 90 report [25] (34.71 eV±1.5% for heavy ions and 33.97 eV±0.35% for 60Co photons) were used instead of the values given in TRS-398 [15]. The PTW 30013 Farmer chamber ratio for 60Co photons was taken from [34] as 1.112 ± 0.1%.
For an independent calculation of kQ according to the original definition using Equation (6), the energy-dependent water-to-air stopping power ratios (Sw,air)Q were extracted from FLUKA for the different ions by using the DELTARAY card. The heavy ion perturbation factors were assumed to be negligible (pQ = 1 as recommended in TRS-398 [15]). The product of the stopping power ratio and the perturbation factor (Sw,air)Q0·pQ0 = 1.112 for 60Co photons were also taken from TRS-398 [15]. The Wair values used for the calculations were the same as stated above (taken from the ICRU 90 report [25]).
Simulations of the laterally integrated depth dose profiles for 1H, 12C, and 56Fe ions in water at two different energies were performed with the aim of evaluating the error in the dose delivery due to an eventual difference between the reference depth of the beam monitor calibration (4.8 mm) and the actual depth of the irradiated samples. These simulations were performed in a water phantom (50 × 50 cm2) and the elements of the beamline were simplified as 1 mm water slab followed by 1 m of air.
3. Results and discussion
3.1. Energy and Ion Dependence of the Water-to-Air Stopping Power Ratio
The FLUKA code allows an extraction of stopping power tables. From the tables for water and air, the water-to-air stopping power ratio Sw,air as a function of energy for different ions was obtained. The results are shown in Figure 3 and are in accordance with recent data reported by other authors [36].
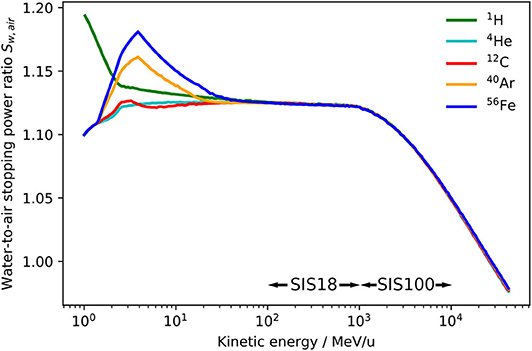
Figure 3. Unrestricted water-to-air stopping power ratio Sw,air as a function of energy for 1H, 4He, 12C, 40Ar, and 56Fe ions extracted from the FLUKA Monte Carlo code. The energy ranges provided by the heavy ion accelerators SIS18 and SIS100 are indicated.
It can be observed that the water-to-air stopping power ratio is independent of the ion species for energies above 100 MeV/u, which justifies the assumption of a kQ value independent of the ion species if ion type specific detector perturbations and variations of the Wair value are neglected. The (Wair)Q term of Equation (6) is indeed assumed to be ion independent within a 1.5% uncertainty [25]. Concerning the pQ term, ion specific variations in the level of permille or even percent can be expected, however, there are no reliable experimental data on heavy ion perturbation factors and their calculation would require very realistic and well benchmarked transport codes. New precision measurements of all dosimetric key data for heavy ions, especially the Wair value, would be useful to decrease the overall uncertainty of the kQ value.
From Figure 3 it can also be observed that above 1 GeV/u, when the ions get highly relativistic, the stopping power ratio is not constant anymore, but drops down steeply. This decrease is due to the density effect, which causes a reduction of the stopping power of water for high-energy ions while it does not affect the stopping power of air as its density is about 1, 000 times lower than the density of water. Therefore, air-filled ionization chambers show an over-response to high energetic ions if applied for absorbed dose to water measurements. This has to be taken into account within the beam quality correction. This effect is well-known for dosimetry in high energy photon therapy [37], but it is a novelty in the scope of ion beam dosimetry for the unique high energy heavy ion beams that will be available at FAIR. The assumption of an energy-independent kQ value seems therefore reasonable in the kinetic energy range 100 MeV/u to 1 GeV/u, which are the energies provided by the current GSI SIS18 accelerator, while for ions with greater energies, which will be available with the future SIS100 synchrotron at FAIR, an energy-specific kQ value should be used instead.
3.2. Energy and Ion Dependence of the PTW 30013 Farmer Chamber Beam Quality Correction Factor kQ
ratios for 1H, 4He, 12C, 40Ar, and 56Fe ions were obtained with FLUKA radiation transport simulations through a geometrical model of the PTW Farmer chamber and a water geometry with a small scoring voxel at the effective measurement position of the chamber. From these dose ratios, beam quality correction factors kQ were obtained for the ions listed above over a wide span of energies using Equation (7). The results are reported in Table 2.
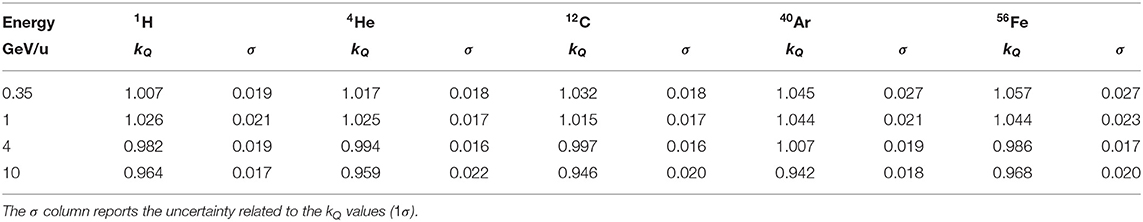
Table 2. Beam quality correction factors kQ for the PTW 30013 Farmer ionization chamber positioned with the effective point of measurement at a water depth of 7 mm for 1H, 4He, 12C, 40Ar, and 56Fe calculated with the FLUKA code for kinetic energies of 350 MeV/u, 1 GeV/u, 4 GeV/u, and 10 GeV/u.
In Figure 4 they are compared with the constant value kQ = 1.032, which is recommended for heavy ions by the TRS-398 protocol [15] and currently used for the beam monitor calibration at GSI Cave A and M. Additionally, they are compared with an energy-dependent calculation based on the formalism from TRS-398 (Equation 6) using as input for the term (Sw,air)Q the energy-dependent water-to-air stopping power ratios from FLUKA (Figure 3). Also the kQ value measured for 383 MeV/u 12C by means of calorimetry [21] is reported.
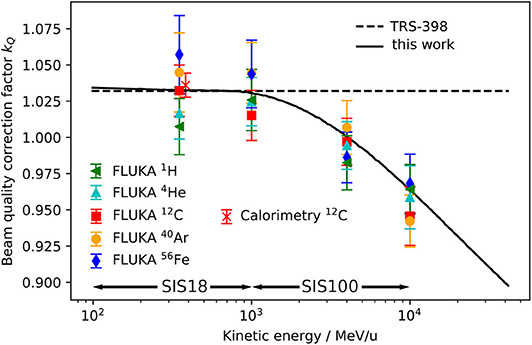
Figure 4. Beam quality correction factor kQ for the PTW 30013 Farmer ionization chamber positioned with the effective point of measurement at a water depth of 7 mm for 1H, 4He, 12C, 40Ar, and 56Fe calculated using from FLUKA simulations as inputs for Equation (7) (symbols) are compared with the constant heavy ion kQ recommended in the TRS-398 dosimetry protocol [15] (dashed line) and an energy-dependent calculation using the water-to-air stopping power ratio for protons extracted from the FLUKA code in Equation (6) (solid line). For comparison a 12C kQ value measured by means of water calorimetry [21] is shown. The energy ranges provided by the heavy ion accelerators SIS18 and SIS100 are indicated.
The error bars of the FLUKA data points contain the statistical uncertainty of the Monte Carlo simulation and the systematic uncertainties of the other input parameters of Equation (7). The uncertainties are discussed in detail in section 3.4. It can be seen that the kQ value for 350 MeV/u 12C ions calculated with FLUKA and the value measured by Osinga-Blaettermann [21] at the 12C ion therapy facility HIT in Heidelberg by means of water calorimetry, are in good agreement. This is a confirmation of the validity of the FLUKA simulations performed within this study. By comparing the FLUKA simulation results with the constant kQ value given in the TRS-398 protocol (dashed line) it can be observed that the value recommended in the protocol is perfectly suited for 12C ions at therapeutic energies. However, it also shows that a constant kQ should only be used for energies lower than 1 GeV/u. The kQ calculated using the energy-dependent water-to-air stopping power ratio for protons from FLUKA (above 100 MeV/u it is practically independent of the ion species) as input for Equation (6) (solid line) reflects well the trend of the single kQ values obtained by detailed ionization chamber simulation. At energies between 100 MeV/u and 1 GeV/u it is practically identical to the constant value (dashed line). The same drop as in Figure 3 due to the density effect above 1 GeV/u can be observed. The agreement of the single data points and the solid line is within 2.5%. The deviations of the data points from the solid line and the differences between the various ion species can be ascribed to the perturbation factors pQ (see Equation 6), which are neglected in the simplified calculation (assumption: pQ = 1) but considered by the full Monte Carlo calculation.
Figures 3, 4 indicate that the assumption of an energy-independent kQ value is reasonable for energies below 1 GeV/u, which is the energy range currently used at GSI Cave A, but not appropriate for higher energies, which will be available at FAIR. Indeed, not taking into account the energy dependence of the correction factor kQ would lead to a systematic error in absolute dosimetry of up to 7.5% at energies of 10 GeV/u. This error would directly translate into the absolute calibration of the dose application system and needs to be avoided. The variation of the kQ factor for different ion species due to different detector perturbations is in the order of 2.5%, which is in the same order as the systematic uncertainty of the calculated kQ values. Those different detector perturbations for different ions might be negligible in view of the accuracy needed for radiobiological experiments.
TRS-398 recommends to use the residual range as beam quality specifier for proton beams, while for heavy ions no unique specifier is given. Figure 4 shows that the (residual) energy per nucleon could be used as a reasonable index of the beam quality for dose measurements in the entrance channel of high energy heavy ion beams. Therefore, for practical use we recommend to apply the energy-dependent kQ value calculated according to the TRS-398 formalism (solid line in Figure 4) for absolute dosimetry and beam monitor calibration in future radiobiological experiments at FAIR.
3.3. Heavy Ion Depth Dose Profiles: Robustness of the Dose Delivery
The depth dose profile at low depth is determined by the interplay of four different effects: (1) in the first millimeters of the target, there is a steep dose build-up until a δ electron equilibrium is reached [38, 39]. Its extension depends on the maximum δ electron energy and therefore on the velocity of the primary ions. (2) The energy loss of the primary ions in the target leads to an increase of their energy loss with depth and therefore to an increase of the dose. On the other hand, fragmentation reactions can (3) decrease or (4) increase the mean energy loss. The decrease is due to removal of primary ions and the increase to the build-up of secondary fragments, which is partly overlaid by the δ electron build-up. How these effects superimpose is not trivial and depends on many factors. Figure 5 shows calculated depth dose profiles in water for 1H, 12C, and 56Fe ions at different energies. As the measurement of the absolute dose is performed with the Farmer chamber at a water depth of 4.8 mm, this is the only depth where the absolute dose is accurately determined. For this reason the dose is normalized to a water depth of 4.8 mm with the aim of studying the robustness of the dose delivery if the actual depth of the irradiated samples deviates from the reference depth.
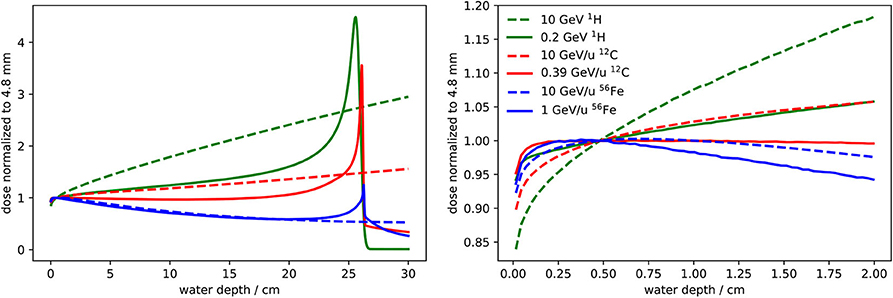
Figure 5. Depth dose profiles for 1H, 12C, and 56Fe ions at two different energies obtained with FLUKA simulations: one energy corresponds to a penetration depth of about 25 cm in water and the other is the maximum energy provided by SIS100 (10 GeV/u). The dose is normalized to a water depth of 4.8 mm, which is the reference depth for the beam monitor calibration. It is the only depth where the absolute dose is accurately determined. In the left panel the profiles up to a water depth of 30 cm are reported, while in the right panel the depth dose profiles are shown with a zoom into the entrance channel.
Figure 5 shows that the entrance channel of the depth dose profile is not a plateau for most heavy ion beams. Therefore irradiations of radiobiological samples should preferably be performed at the reference depth. If the sample is irradiated at a different depth, the dose might vary significantly, even if the shift is only a few millimeters. For this reason, the relative dose profile should be calculated using a reliable radiation transport code that considers all relevant physical effects. From the calculated depth dose profile normalized to the reference depth (like the profiles shown in Figure 5) and from the nominal dose measured by the beam monitor, the dose at the actual irradiation depth can be obtained.
3.4. Uncertainty Analysis
Table 3 breaks down the uncertainty of calculated kQ values obtained by means of Monte Carlo simulations according to Equation (7) (uncertainties in Table 2 and Figure 4) in its components. All stated uncertainties describe 1σ of the confidence interval.
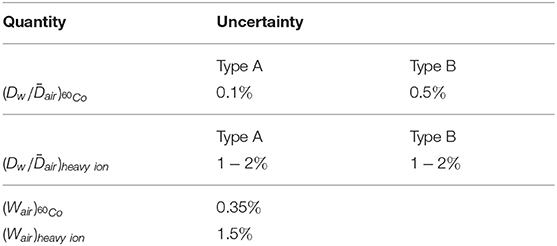
Table 3. Contributions to the uncertainty of heavy ion kQ values obtained by Monte Carlo simulations.
The type A uncertainty of Monte Carlo simulations due to the limited number of particle histories can be calculated as the standard deviation of the output from individual simulation runs using different random number seeds. They are considerably larger for the heavy ion simulations than for the 60Co photons because photon simulations are more efficient in terms of calculation time.
The type B uncertainty of Monte Carlo calculated ratios (due to uncertainties in the radiation physics and transport models, geometry, etc.) were estimated to be 0.5% based on an intercode comparison by Baumann et al. [33] and a benchmark experiment by Renner et al. [40]. The corresponding type B uncertainty of the ratios from FLUKA simulations is more difficult to estimate but certainly larger than the uncertainty for 60Co photons. The water-to-air stopping power ratios in FLUKA (shown in Figure 3) can be considered realistic, however, inaccuracies in the physics models (in particular those describing nuclear reactions) or simplifications in the detector geometry model can lead to uncertainties in the predictions of detector perturbations. The type B uncertainty of the ratio was estimated to be about 1−2% and probably depends on the ion species and energy since the FLUKA code is for some ions better benchmarked than for others. Especially for 12C ions in the therapeutic energy range its transport and physics models are well-developed [41] which reflects in the good agreement of the Monte Carlo result and the water calorimetry measurement (see Figure 4).
Since the Wair values are required as input in Equation (7) also their uncertainties have to be considered for calculated kQ values. While the uncertainty of the 60Co literature value is rather low, the corresponding (Wair)heavy ion = 34.71±1.5% value has a considerably larger uncertainty. A reduction of this uncertainty by new measurements would increase the accuracy of calculations in heavy ion dosimetry. Even if the stated uncertainty is lower, the (Wair)proton = 34.44±0.4% value shown in Table 1 was not used for the kQ calculations, because it was optimized specifically for protons in the therapeutic energy range (50−250 MeV/u) while the proton simulations in this work were done for 350 MeV and above.
Aside from the kQ value, also other factors contribute to the overall uncertainty of an absolute dose measurement and beam monitor calibration in terms of primary particle number. In Table 4 estimated uncertainties of the input quantities of Equation (3) and the conversion into primary fluence are listed.
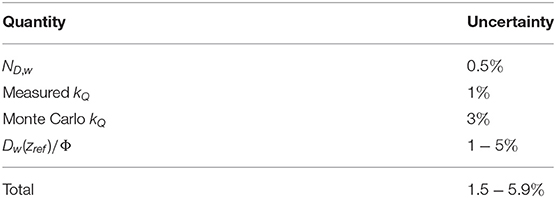
Table 4. Uncertainties of beam monitor calibration in terms of primary particle number.
The uncertainty of the calibration factor ND,w determined with 60Co photons can differ slightly between individual chamber models and is typically listed in the calibration sheet (0.55% for the PTW 30013 Farmer used at GSI). The estimated typical value of 0.5% is in accordance with a recent dosimetry intercomparison between different proton therapy centers where an agreement on that scale was described [42]. The uncertainty of ND,w could in principle be further reduced by calibration at a primary standard dosimetry laboratory instead of using a secondary standard 60Co source which is the common procedure for instance at the company PTW. However, as pointed out in TRS-398 [15] the overall improvement is only marginal while the effort would increase strongly.
For 12C ions a precise calorimetric measurement of kQ with an uncertainty <1% is available, while for other ions such experimental kQ values are missing. Therefore, Monte Carlo calculated kQ values for different ions with uncertainties around 2−3% are provided in this work for the energy range that will be available for radiobiological experiments at the FAIR facility.
Another important quantity for the calibration of the beam monitor in terms of primary particle numbers is the absorbed dose to water at the reference depth per primary fluence Dw(zref)/Φ which is typically obtained by Monte Carlo simulation. Its uncertainty can be considered to be low for well-characterized particles like protons or 12C ions at therapeutic energies (in the order of 1% [43]) but is estimated up to 5% for more exotic ions and energies. As for the ratios, the main uncertainty in the Monte Carlo simulation are the nuclear reaction models. An inaccurate modeling of the attenuation or build-up effects (see Figure 5) leads to uncertainties in the absorbed dose to water at the reference depth. For radiobiological irradiations where the quantity of interest is typically absorbed dose, the uncertainty of Dw(zref)/Φ is of minor importance. However, in some experiments an accurate determination of the primary particle number is required. An example are recent attempts to measure absolute nuclear reaction cross sections by means of activation where the determination of the primary particle number represented a major source of uncertainty [44, 45].
In summary the estimated uncertainties, considering that they are independent, add up to values between 1.5% (lower values) and 5.9% (upper values) for the absolute monitor calibration in terms of primary particle number. The lower uncertainty can be reached for the well-characterized protons and 12C ions in the therapeutic energy range while for other ion species the calibration will be less accurate. Improvements in accuracy can be reached by further development and benchmarking of Monte Carlo transport models against experimental data, but also by new measurements of dosimetric key data like heavy ion Wair values or direct measurement of kQ values by means of water calorimetry.
4. Conclusions
The absolute dosimetry and beam monitor calibration procedure as currently applied at GSI Cave A and M were explained in detail and an uncertainty analysis was performed. The accuracy of the beam quality correction factor kQ to be applied for the PTW 30013 Farmer ionization chamber was studied in detail as it is a main contributor to the overall accuracy of the calibration procedure and subsequent dose delivery. The Monte Carlo study performed within the present work showed that the assumption of kQ being ion independent is valid within an uncertainty of 2.5%, while the assumption of kQ being energy independent is valid only up to energies of 1 GeV/u. Therefore, the constant value kQ = 1.032 recommended for the PTW 30013 chamber and heavy ions by the TRS-398 protocol [15] and currently used for the beam monitor calibration at GSI Caves A and M, is suitable for the experiments currently performed. However, for experiments at FAIR, in which the energy of the accelerated ions will reach up to 10 GeV/u, the constant kQ value should be replaced with the energy-dependent correction factor provided in this work. The reason for the need of an energy-dependent beam quality correction factor has been identified as the density effect on the water-to-air stopping power ratio.
In addition, it is recommended to irradiate biological samples at the reference depth of 4.8 mm. If a sample has a lower depth by itself, for instance cell flasks with a typical wall thickness of 1 mm, it is recommended to introduce a bolus preferably consisting of water-equivalent material (e.g., PMMA or RW3).
Data Availability Statement
The original contributions presented in the study are included in the article/supplementary material, further inquiries can be directed to the corresponding author/s.
Author Contributions
FL and FH compiled the manuscript with support and input from UW, DB, CS, C-AR, KZ, and MD. FH performed the Monte Carlo simulations and made the considerations for kQ with support from KZ. FL performs daily monitor calibration and dosimetry at GSI Cave A supported by UW, DB, C-AR, and CS. UW and MD guided and assigned the work. All authors contributed to the article and approved the submitted version.
Funding
This work was partially supported by EU Horizon2020 grant 73,0983 (INSPIRE). The measurements were performed in Caves A and M in the frame of FAIR Phase-0 supported by the GSI Helmholtzzentrum für Schwerionenforschung in Darmstadt (Germany).
Conflict of Interest
The authors declare that the research was conducted in the absence of any commercial or financial relationships that could be construed as a potential conflict of interest.
References
1. Haberer T, Becher W, Schardt D, Kraft G. Magnetic scanning system for heavy ion therapy. Nucl Instrum Methods Phys Res A. (1993) 330:296–305. doi: 10.1016/0168-9002(93)91335-K
2. Badura E, Brand H, Essel HG, Haberer T. Control system for cancer therapy with a heavy ion beam at GSI. IEEE Trans Nucl Sci. (2000) 47:170–3. doi: 10.1109/23.846141
3. Hartmann GH, Jäkel O, Heeg P, Karger CP, Krießbach A. Determination of water absorbed dose in a carbon ion beam using thimble ionization chambers. Phys Med Biol. (1999) 44:1193–206. doi: 10.1088/0031-9155/44/5/008
4. Jäkel O, Hartmann GH, Karger CP, Heeg P, Vatnitsky S. A calibration procedure for beam monitors in a scanned beam of heavy charged particles. Med Phys. (2004) 31:1009–13. doi: 10.1118/1.1689011
5. Durante M, Golubev A, Park WY, Trautmann C. Applied nuclear physics at the new high-energy particle accelerator facilities. Phys Rep. (2019) 800:1–37. doi: 10.1016/j.physrep.2019.01.004
6. Bellinzona VE, Ciocca M, Embriaco A, Fontana A, Mairani A, Mori M, et al. On the parametrization of lateral dose profiles in proton radiation therapy. Phys Med. (2015) 31:484–92. doi: 10.1016/j.ejmp.2015.05.004
7. Moyers MF, Toth TL, Sadagopan R, Chvetsov AV, Unkelbach J, Mohan R, et al. Task Group Report No. 202 - Physical uncertainties in the planning and delivery of light ion beam treatments. Med Phys. (2020) 202:1–107. doi: 10.37206/200
8. Arjomandy M, Taylor P, Ainsley C, Safai S, Sahoo N, Pankuch M, et al. Task Group Report No. 224 - comprehensive proton therapy machine quality assurance. Med Phys. (2019) 46:e678–705. doi: 10.1002/mp.13622
9. Karger CP, Jäkel O, Palmans H, Kanai T. Dosimetry for ion beam radiotherapy. Phys Med Biol. (2010) 55:R193–234. doi: 10.1088/0031-9155/55/21/R01
10. Grusell E, Isacsson U, Montelius A, Medin J. Faraday cup dosimetry in a proton therapy beam without collimation. Phys Med Biol. (1995) 40:1831–40. doi: 10.1088/0031-9155/40/11/005
11. Pedroni E, Scheib S, Böhringer T, Coray A, Grossmann M, S L, et al. Experimental characterization and physical modelling of the dose distribution of scanned proton pencil beams. Phys Med Biol. (2005) 50:541–61. doi: 10.1088/0031-9155/50/3/011
12. Gomà C, Lorentini S, Meer D, Safai S. Proton beam monitor chamber calibration. Phys Med Biol. (2014) 59:4961–71. doi: 10.1088/0031-9155/59/17/4961
13. Fukumura A, Hiraoka T, Omata K, Takeshita M, Kawachi K, Kanai T, et al. Carbon beam dosimetry intercomparison at HIMAC. Phys Med Biol. (1998) 43:3459–63.
14. Osinga JM, Brons S, Bartz JA, Akselrod MS, Jäkel O, Greilich S. Absorbed dose in ion beams: comparison of ionisation- and fluence-based measurements. Radiat Protect Dosimetr. (2014) 161:387–92. doi: 10.1093/rpd/ncu004
15. Andreo P. Absorbed Dose Determination in External Beam Radiotherapy: An International Code of Practice for Dosimetry based on Standards of Absorbed Dose to Water. IAEA TRS 398 (2006).
16. Palmans H, Vatnitsky SM. Beam monitor calibration in scanned light-ion beams. Med Phys. (2016) 43:5835–47. doi: 10.1118/1.4963808
17. Agostinelli S, Allison J, Amako K, Apostolakis J, Araujo H, Arce P, et al. Geant4 - a simulation toolkit. Nucl Instrum Methods Phys Res Sect A Accelerat Spectrom Detect Assoc Equip. (2003) 506:250–303. doi: 10.1016/S0168-9002(03)01368-8
18. Ferrari A, Sala PR, Fassò A, Ranft J. FLUKA: A Multi-Particle Transport Code. CERN-2005-10, INFN/TC_05/11, SLAC-R-773 (2005).
19. Böhlen TT, Cerutti F, Chin MPW, Fassò A, Ferrari A, Ortega PG, et al. The FLUKA code: developments and challenges for high energy and medical application. Nucl Data Sheets. (2014) 120:211–4. doi: 10.1016/j.nds.2014.07.049
20. Battistoni G, Bauer J, Boehlen TT, Cerutti F, Chin MPW, Dos Santos Augusto R, et al. The FLUKA code: an accurate simulation tool for particle therapy. Front Oncol. (2016) 11:116. doi: 10.3389/fonc.2016.00116
21. Osinga-Blättermann JM, Brons S, Greilich S, Jäkel O, Krauss A. Direct determination of k Q for Farmer-type ionization chambers in a clinical scanned carbon ion beam using water calorimetry. Phys Med Biol. (2017) 62:2033–54. doi: 10.1088/1361-6560/aa5bac
22. Renaud J, Palmans H, Sarfehnia A, Seuntjens J. Absorbed dose calorimetry. Phys Med Biol. (2020) 65:05TR02. doi: 10.1088/1361-6560/ab4f29
23. Normenausschuss Radiologie. Procedures of Dosimetry With Probe-type Detectors for Proton and Ion Radiation - Part 1: Ionization Chambers. DIN 6801-1:2019-09 (2019).
24. Kraft G, Weber U. Tumor therapy with ion beams. In: Grupen C, Buvat I, editors. Handbook of Particle Detection and Imaging. Heidelberg: Springer. (2012). p. 1179–205.
25. International Commission on Radiation Units and Measurements. ICRU Report 90: key data for ionizing-radiation dosimetry: measurement standards and applications. J ICRU. (2016) 14:1–110. doi: 10.1093/jicru/ndw034
26. International Commission on Radiation Units and Measurements. ICRU Report 31: Average energy required to produce an ion pair. J ICRU. (1979) 25:os16.
27. Knoll GF. Radiation Detection and Measurement, New York, NY; Chichester; Weinheim; Brisbane; Toronto; Singapore: John Wiley & Sons, Inc. (2000).
28. Paul H, Berger MJ. Atomic and Molecular Data for Radiotherapy and Radiation Research. IAEA-TECDOC–799. (1995).
29. Wulff J, Heverhagen JT, Zink K. Monte-Carlo-based perturbation and beam quality correction factors for thimble ionization chambers in high-energy photon beams. Phys Med Biol. (2008) 53:2823–36. doi: 10.1088/0031-9155/53/11/005
30. Wulff J, Heverhagen JT, Zink K, Kawrakow I. Investigation of systematic uncertainties in Monte Carlo- calculated beam quality correction factors. Phys Med Biol. (2010) 55:4481–93. doi: 10.1088/0031-9155/55/16/S04
31. Gomà C, Andreo P, Sempau J. Monte Carlo calculation of beam quality correction factors in proton beams using detailed simulation of ionization chambers. Phys Med Biol. (2016) 61:2389–406. doi: 10.1088/0031-9155/61/6/2389
32. Gomà C, Sterpin E. Monte Carlo calculation of beam quality correction factors in proton beams using PENH. Phys Med Biol. (2019) 64:185009. doi: 10.1088/1361-6560/ab3b94
33. Baumann KS, Horst F, Zink K, Gomà C. Comparison of penh, fluka, and Geant4/topas for absorbed dose calculations in air cavities representing ionization chambers in high-energy photon and proton beams. Med Phys. (2019) 46:4639–53. doi: 10.1002/mp.13737
34. Baumann KS, Kaupa S, Bach C, Engenhart-Cabillic R, Zink K. Monte Carlo calculation of beam quality correction factors in proton beams using TOPAS/GEANT4. Phys Med Biol. (2020) 65:055015. doi: 10.1088/1361-6560/ab6e53
35. Lourenço A, Bouchard H, Galer S, Royle G, Palmans H. The influence of nuclear interactions on ionization chamber perturbation factors in proton beams: FLUKA simulations supported by a Fano test. Med Phys. (2019) 46:885–91. doi: 10.1002/mp.13281
36. Burigo LN, Greilich S. Impact of new ICRU 90 key data on stopping-power ratios and beam quality correction factors for carbon ion beams. Phys Med Biol. (2019) 64:195005. doi: 10.1088/1361-6560/ab376e
37. Czarnecki D, Poppe B, Zink K. Impact of new ICRU Report 90 recommendations on calculated correction factors for reference dosimety. Phys Med Biol. (2018) 63:155015. doi: 10.1088/1361-6560/aad148
38. Pfuhl T, Horst F, Schuy C, Weber U. Dose build-up effects induced by delta electrons and target fragments in proton Bragg curves—measurements and simulations. Phys Med Biol. (2018) 63:175002. doi: 10.1088/1361-6560/aad8fc
39. Kern A, Bäumer C, Kröninger K, Mertens L, Timmermann B, Walbersloh J, et al. Determination of surface dose in pencil beam scanning proton therapy. Med Phys. (2020) 47:2277–2288. doi: 10.1002/mp.14086
40. Renner F, Wulff J, Kapsch RP, Zink K. Uncertainties in Monte Carlo-based absorbed dose calculations for an experimental benchmark. Phys Med Biol. (2015) 60:7637–53. doi: 10.1088/0031-9155/60/19/7637
41. Böhlen TT, Cerutti F, Dosanjh M, Ferrari A, Gudowska I, Mairani A, et al. Benchmarking nuclear models of FLUKA and GEANT4 for carbon ion therapy. Phys Med Biol. (2010) 55:5833–47. doi: 10.1088/0031-9155/55/19/014
42. Bäumer C, Ackermann B, Hillbrand M, Kaiser FJ, Koska B, Latzel H, et al. Dosimetry intercomparison of four proton therapy institutions in Germany employing spot scanning. Z Med Physik. (2017) 27:80–5. doi: 10.1016/j.zemedi.2016.06.007
43. Parodi K, Mairani A, Brons S, Hasch BG, Sommerer F, Naumann J, et al. Monte Carlo simulations to support start-up and treatment planning of scanned proton and carbon ion therapy at a synchrotron-based facility. Phys Med Biol. (2012) 57:3759–84. doi: 10.1088/0031-9155/57/12/3759
44. Horst F, Adi W, Aricò G, Brinkmann KT, Durante M, Reidel CA, et al. Measurement of PET isotope production cross sections for protons and carbon ions on carbon and oxygen targets for applications in particle therapy range verification. Phys Med Biol. (2019) 64:205012. doi: 10.1088/1361-6560/ab4511
Keywords: heavy ion dosimetry, beam monitor calibration, raster scanning, beam quality correction factor, kQ, radiobiological irradiations, farmer ionization chamber
Citation: Luoni F, Weber U, Boscolo D, Durante M, Reidel C-A, Schuy C, Zink K and Horst F (2020) Beam Monitor Calibration for Radiobiological Experiments With Scanned High Energy Heavy Ion Beams at FAIR. Front. Phys. 8:568145. doi: 10.3389/fphy.2020.568145
Received: 31 May 2020; Accepted: 17 August 2020;
Published: 29 September 2020.
Edited by:
Wouter van Elmpt, Maastricht University, NetherlandsReviewed by:
Hugo Palmans, National Physical Laboratory, United Kingdom; MedAustron Ion Therapy Center, AustriaStefaan Vynckier, Catholic University of Louvain, Belgium
Copyright © 2020 Luoni, Weber, Boscolo, Durante, Reidel, Schuy, Zink and Horst. This is an open-access article distributed under the terms of the Creative Commons Attribution License (CC BY). The use, distribution or reproduction in other forums is permitted, provided the original author(s) and the copyright owner(s) are credited and that the original publication in this journal is cited, in accordance with accepted academic practice. No use, distribution or reproduction is permitted which does not comply with these terms.
*Correspondence: Uli Weber, dS53ZWJlckBnc2kuZGU=