 Mads Borries1†Younes Farhangi Barooji1†Siham Yennek2
 Anne Grapin-Botton2
 Kirstine Berg-Sørensen3,4#
 Lene B. Oddershede1*
- 1Niels Bohr Institute, University of Copenhagen, Copenhagen, Denmark
- 2The Novo Nordisk Foundation Center for Stem Cell Biology, University of Copenhagen, Copenhagen, Denmark
- 3Department of Physics, Technical University of Denmark, Kongens Lyngby, Denmark
- 4DTU Health Technology, Lyngby, Denmark
The biophysical properties of polymer based gels, for instance the commonly used Matrigel, crucially depend on polymer concentration. Only certain polymer concentrations will produce a gel optimal for a specific purpose, for instance for organoid development. Hence, in order to design a polymer scaffold for a specific purpose, it is important to know which properties are optimal and to control the biophysical properties of the scaffold. Using optical tweezers, we perform a biophysical characterization of the biologically relevant Matrigel while systematically varying the polymer concentration. Using the focused laser beam we trace and spectrally analyze the thermal fluctuations of an inert tracer particle. From this, the visco-elastic properties of the Matrigel is quantified in a wide frequency range through scaling analysis of the frequency power spectrum as well as by calculating the complex shear modulus. The viscoelastic properties of the Matrigel are monitored over a timespan of 7 h. At all concentrations, the Matrigel is found to be more fluid-like just after formation and to become more solid-like during time, settling to a constant state after 1–3 h. Also, the Matrigel is found to display increasingly more solid-like properties with increasing polymer concentration. To demonstrate the biological relevance of these results, we expand pancreatic organoids in Matrigel solutions with the same polymer concentration range and demonstrate how the polymer concentration influences organoid development. In addition to providing quantitative information about how polymer gels change visco-elastic properties as a function of polymer concentration and time, these results also serve to guide the search of novel matrices relevant for organoid development or 3D cell culturing, and to ensure reproducibility of bio-relevant Matrigels.
Introduction
Cells in an organism are surrounded by a matrix, often made of biopolymers, whose physical properties dramatically influence cell behavior. For instance, the visco-elastic properties of the extracellular matrix (ECM) has been shown to play an important role in fundamental cellular processes such as cell migration [1, 2], proliferation [3–5], and differentiation [6–8], as well as for the spreading of cancerous cells [5, 9, 10]. For this reason, much effort has been put into developing physics-based tools, experimental and theoretical, to enable characterization of the biophysical properties of polymer solutions. Atomic force microscopy (AFM) and shear rheology are two common experimental techniques which allow for quantification of the elastic properties of the ECM [11, 12]. However, both methods still struggle to measure the stiffness changes of the ECM during imaging of cells in culture media and none of them have the ability to measure deep inside organisms or tissue in a non-invasive manner. Optical tweezers and video-microscopy are two other techniques, which has proven capable of quantifying visco-elastic properties, also inside living cells and organisms, through passive monitoring of an optically trapped tracer particle. These methods have the advantage that they provide both the elastic and viscous responses of a polymer matrix over a large frequency range, including the range relevant for polymer dynamics [13, 14].
Cellular development can be influenced, or controlled, by proper matrix choice. This is instrumental for the development of organoids, which are 3D cell models, derived from a few cells, which allow for in vitro expansion of an organ for potential medical usage. Matrigel is the most commonly used polymer matrix for successful organoid development. In this paper, we use Matrigel as a biologically relevant polymer matrix with the purpose of systematically investigating how the physical properties of the polymer matrix change as a function of polymer concentration. Thereby, we continue work which was sparked by investigating the elastic properties of actin network by MacKintosh et al in 1995 [15]. More than 1800 peptides have been identified in Matrigel, however, the main components are Laminin (
Here, we systematically quantify the viscoelastic properties of Matrigel preparations at different polymer concentrations using a passive optical tweezers based method which can be carried out non-invasively during confocal imaging of the sample. These results have interest also for other types of polymeric solution where it is an outstanding question how the viscoelastic properties depend on the polymer concentration. It is also demonstrated how the physically different matrices result in different growth of embedded organoids.
Materials and Methods
Optical Setup
An overview of the optical tweezers based setup used for the experiments is provided in Figure 1. The optical trap is constructed from an infrared laser (1064 nm, Nd:YVO4, Spectra-Physics J20-BL10-106Q) directed into an inverted microscope (Leica, TCS SP5), equipped with a proper dicroic mirror. Both the laser and the microscope light are focused onto a sample placed in a sample holder through a water immersion objective (PL APO, NA = 1.2, 63X, w). The sample holder is placed on a movable piezo stage (Newport, XY Translation Stage Model M406), that is used to position the sample with respect to the focus of the optical trap. After interacting with the weakly trapped bead, the back-scattered light is collected by the condenser and imaged onto a Quadrant Photo Diode (QPD) (Hamamatsu, Si PIN photodiode S5981) in the back focal plane. In addition, the sample plane is imaged with a CCD camera (Imagesource, DFK 31AF03), monitoring the sample. The measurement output of the QPD, the raw data, consists of four voltages that are transformed into appropriate sums and differences linearly related to the position of the bead inside the trap [18, 19]. The laser was operated at 200–300 mW of which approximately 20% reached the sample plane.
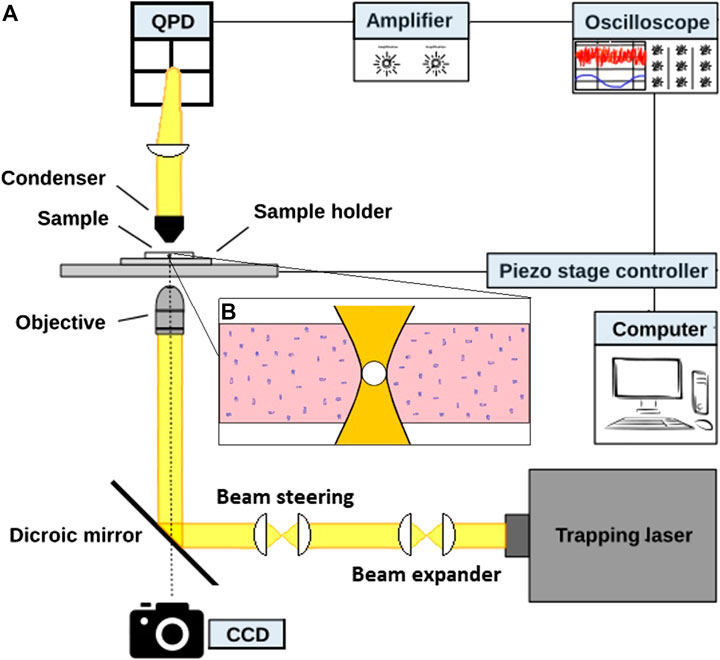
FIGURE 1. Sketch of the setup. (A) 1,064 nm laser light is directed into an inverted microscope. The microscope objective focuses the laser onto a sample (b) placed on a movable piezo stage. After interacting with the sample, the back-scattered light is collected by a condenser and focused onto a Quadrant Photo Diode (QPD). A CCD camera monitors the sample. (B) Sketch of a sample containing Matrigel solution and an optically trapped tracer particle.
Power Spectral Analysis Method
Optical tweezers exert a harmonic force,
where
When the surrounding medium is a visco-elastic medium rather than a newtonian fluid, for frequencies well above the corner frequency of the trap, the power spectrum can be described by:
For tracer motion within a medium, the value of α relates to the behavior of the tracer particle as follows:
• α = 0: The particle is completely confined by the surrounding medium.
• 0
• α = 1: The particle performs free diffusion described as Brownian motion, and the surrounding medium is purely viscous.
• α
Complex Shear Moduli
The frequency dependent complex shear modulus,
where
Thus, the different physical quantities are extracted as follows:
where the last results follows from the Kramers-Kronig relation. This method is less challenging in comparison with active methods (oscillatory microrheology) [25], however, since the trap stiffness is not accounted for, the laser power should not be too high. And since the photodiode detection system may act as an unintended filter [26], the frequency span of the method lies between the corner frequency of trap and the filtering frequency of the photodiode, this frequency interval spanning several orders of magnitude and encompassing frequencies relevant for polymer dynamics. With these concerns accounted for, the frequency dependent viscoelastic characteristics of the medium can be determined as described above. The loss tangent,
Preparation of Matrigel Matrix and Sample Chamber
The major components of the ECM include water, proteins, and polysaccharides and different types of ECMs for cell culturing are commercially available, extracted from different types of tissue using different protocols [27–29]. ECM preparations of particular viscoelastic properties can be produced with different compositions by including a variety of proteins and biopolymers. MatrigelR is a commercial ECM extracted from Engelbreth-Holm-Swarm mouse tumor cultures [30–33]. It is commonly used as a basement membrane matrix to support proliferation of stem cells while they remain in an undifferentiated state [34]. In addition, combinations of Matrigel and other ECM mixtures [35–37] are widely used as external matrix in culturing of 3D spheroids and organoids.
The Matrigel (Corning® Matrigel®, Growth Factor Reduced, Basement Membrane Matrix, Phenol Red-free, LDEV-free) was mixed with the nutrition medium Dulbecco’s Modified Eagle Medium/Nutrient Mixture F-12 (DMEM) (Gibco™, GlutaMAX™, Additives: Sodium Pyruvate & Sodium Bicarbonate). The latter is a medium that has proven to support growth of several kinds of cells and organoids, such as the pancreas organoid, providing the addition of small quantities of additional growth factors [16, 17]. The nutrition medium contains a high concentration of amino acids, vitamins and glucose.
Sample chambers, with an inner height between 300 and 500 μm, were prepared by sticking two glass slides together using vacuum grease and the chambers were then cooled down. Frozen Matrigel was put on ice to slowly thaw. Since Matrigel becomes gel-like at above approximately 4°C, the temperatures of the solutions had to be kept between 0 and 4°C. The nutrition medium was cooled to the same temperature and mixed with a 0.96 μm polystyrene bead solution. Matrigel and the nutrition medium with polystyrene beads were mixed together using pipettes and injected in the sample chambers. The chambers were then sealed completely with vacuum grease. A chamber was placed on the microscope stage and beads were trapped to conduct a measurement once per hour during 7 h.
Trapping of Beads Inside Matrigel Sample
Immediately after sample preparation, the samples were taken to the optical tweezers setup. Beforehand the laser trap was calibrated to have its focus (Figure 1B) at the same axial position as the microscope objective’s focus and to have its lateral center in the center of the field of view of the objective. At this position, the tracer beads were physically trapped in a harmonic potential. Before turning on the laser, the dispersed beads were localized and positioned in the center of the microscope objective’s focus point. The laser was then activated, it was operated at relatively low laser powers and the bead was hence trapped in a weak harmonic potential. While the bead was trapped and performing thermal fluctuations, its positions were recorded by QPD. In each chamber, for each concentration and at each point in time, five beads were trapped. And for each bead, three micro-rheology measurements were conducted.
Mouse Pancreatic Organoid Culture and Measurement
Mouse pancreatic organoids were cultured as previously described [16, 17]. Briefly, pancreatic progenitors were isolated from the dorsal pancreatic bud of a litter of mouse embryos at embryonic day (e)10.5, typically 10 embryos. The epithelial part of the bud was dissected from the surrounding mesenchyme and remaining digestive tract with microneedles, dissociated to single cells and small clusters using Trypsin 0.5% (about 5,000 cells from 10 pooled embryos) and mixed with growth factor-depleted Matrigel on ice. Drops of 8 μl of the cell:Matrigel mixture were deposited on culture plates, allowed to gel at 37°C and cultured in organoid medium [16, 17] for 7 days. In these conditions clusters of cells proliferate and self-organize to form organoids. Three concentrations of Matrigel were tested: 75%, 50%, and 25%. Images of organoid cultures were acquired after day 1, day 2, day 4, day 5 and day 7 in culture on a Leica AF6000 (HCX PL FLUOTAR 10x/0.30 Ph1 Dry, Leica DFC365 FX camera) in such a way that every single organoid could be tracked over time. Organoid area was measured over time using the freehand selection tool on ImageJ. The radius (r) of the measured areas was calculated assuming a spherical shape, and organoid growth was determined by plotting
To quantify the branching of the growing organoids, the focus plane of the objective yielding the largest area for each organoid was used to determine the area of individual organoids. At this plane, the length of the outer membrane surrounding the entire organoid, the perimeter, was quantified by Fiji routines. The ratio perimeter2/area was calculated for each organoid in order to have a dimensionless measure of branching, that is, size-independent.
Results and Discussion
Viscoelastic Properties of the Matrigel Changes as a Function of Time and Concentration
To characterize the viscoelastic properties of each sample, we retrieved α by fitting Eq 2 to the experimentally obtained power spectral data (PSD) in the frequency range 2000 Hz
Figure 2A shows two examples of the PSD as a function of frequency on a double-log plot for a trapped bead in water (a purely viscous liquid, black in Figure 2A) and in a 25% Matrigel solution (a viscoelastic medium, blue in Figure 2A). The two PSDs in Figure 2A) illustrate the difference in scaling properties of a tracer particle embedded in a purely viscous media as opposed to embedment in a viscoelastic media. Beads moving in a mixture with only 15% Matrigel solution behave as if they had been in a normal Newtonian liquid like water as their motion was characterized by
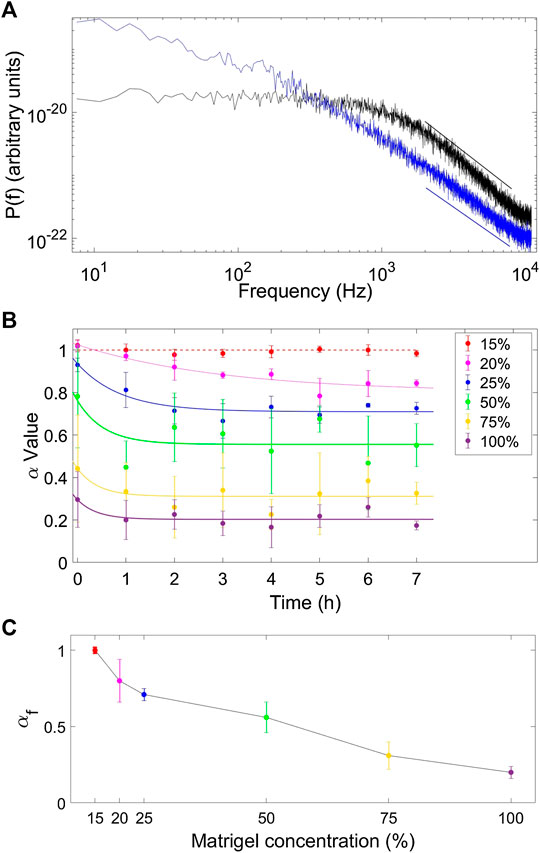
FIGURE 2. Determination of scaling properties and evaluation of how these change as a function of time and concentration. (A) Power spectrum of an optically trapped particle in water (black, α = 1) and in a Matrigel mixture (ratio 75% medium to 25% matrigel) (blue, α = 0.71) 7 h after preparation of the sample. The straight lines show fits of Eq. 2 to data, fits were carried out on data blocked as described in refs. 38 and 39. (B) Values of α as a function time for tracer particles embedded in different concentrations of matrigel solution (15% red, 20% magenta, 25% blue, 50% green, 75% orange, and pure Matrigel solution (100%) purple). Solid lines show exponential fits to the experimental data which indicate that α reaches an asymptotic value,
Over time, the fitted value of α decreased from an initial value
Complex Shear Moduli of Matrigel Change With Concentration
The viscoelastic properties of the Matrigel were also investigated through their complex shear moduli as described in Methods, however, with the extra consideration that the contribution from the optical trap should also be considered. For a particle trapped inside the medium,
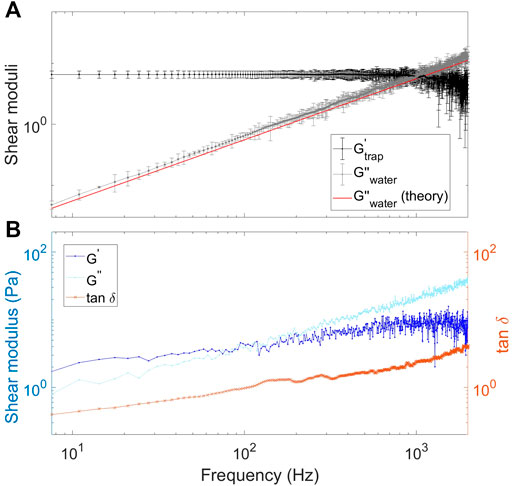
FIGURE 3. Extraction of complex shear moduli for tracer particles in water or Matrigel solutions. (A) Extracted complex shear moduli for a bead trapped in water. The black symbols and black line show the storage modulus. The gray symbols and gray line show the loss modulus, the results being in agreement with theory (red line) for a viscous liquid. (B) Extracted storage modulus,
Once the storage moduli of water are known, the shear moduli corresponding to the Matrigel solution can be extracted. As discussed above, in a solution with a 15% concentration of Matrigel, the bead experiences a medium with properties very similar to water, see also Figure 2B), which is probably due to the very low concentration of polymers. For a 20% Matrigel mixture, the loss modulus dominates the storage modulus in the entire measured frequency interval, thus implying that the solution has a dominantly liquid like behavior (
Figure 4A) demonstrates that the storage modulus of Matrigel mixtures increases with Matrigel concentration over the entire frequency range, the inset in a) shows the value of the loss modulus at f = 100 Hz as a function of concentration. The same conclusion can be drawn from inspecting the loss tangent as a function of frequency for different Matrigel concentration; the loss tangent clearly increases with Matrigel concentration over the entire frequency range (Figure 4B). The inset in Figure 4B) shows the cross over frequency, i.e., the frequency at which
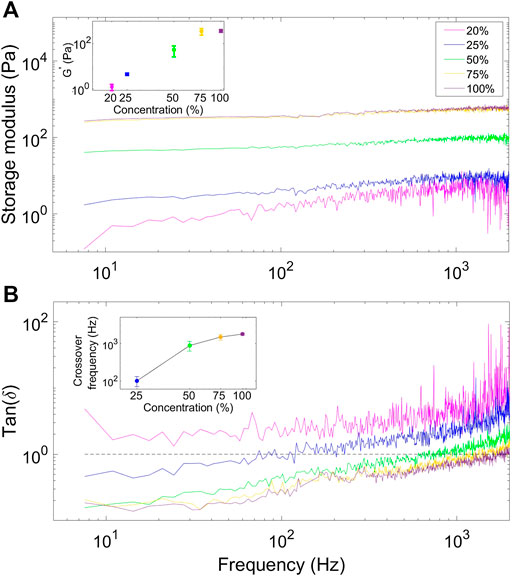
FIGURE 4. Analysis of how the elastic properties of the matrix change with polymer concentration. (A) Storage moduli of mixtures with different Matrigel concentrations (20% magenta, 25% blue, 50% green, 75% orange, and pure Matrigel solution (100%) purple). At all frequencies, the storage moduli increase with Matrigel concentration. The inset shows the value of the storage modulus at f = 100 Hz as a function of Matrigel concentration. (B) Loss tangents as a function of frequency for different Matrigel concentrations. The insert shows the value of the crossover frequency, the frequency at which
Effect of Matrigel Concentration on Organoid Expansion
To test whether variations of the mechanical properties of a Matrigel polymer matrix affects pancreas organoid growth and branching patterns, we seeded pancreatic progenitors isolated from e10.5 embryos in Matrigel-based matrices with Matrigel concentrations in the range of 25–75%. As previously reported for 75% Matrigel, we observed that organoids grew during the entire 7-day period of observation. After day 4 they started to form bulges reminiscent of the branching patterns seen in the body (Figure 5A). While the growth (measured by normalized volume) was in the same range for organoids embedded in 25%, 50% or 75% Matrigel matrices (Figure 5B), their branching visually appeared greater in higher Matrigel concentrations (Figure 5A).
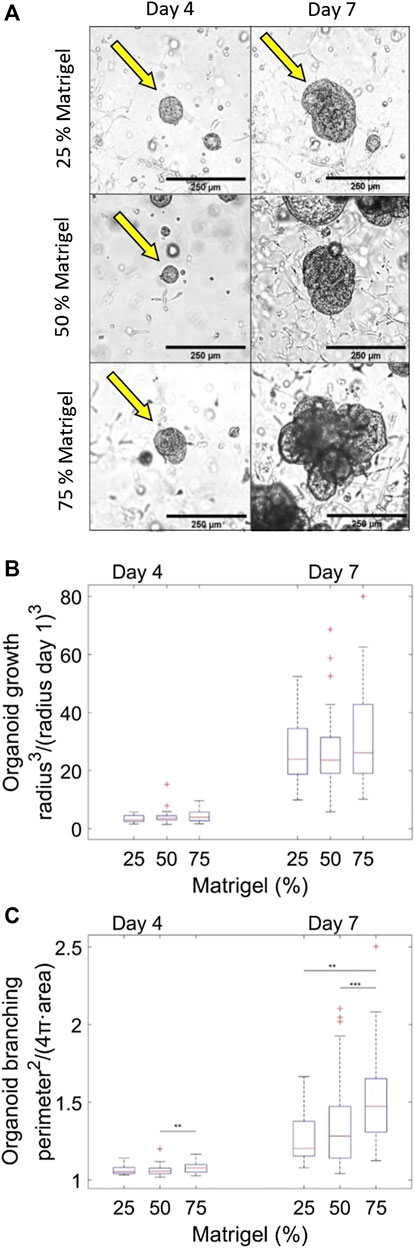
FIGURE 5. Quantification of organoid branching in Matrigel matrices of different concentrations. (A) Representative pictures of organoid growth over time in 75%, 50%, and 25% Matrigel matrices at Day 4 and Day 7, respectively. If more objects are present in an image, arrows point to examples of organoids used for data analysis. (B) Quantification of organoid growth in Matrigel matrices with different concentrations (25%, 50%, 75%). The organoid growth is monitored over time. The average of the normalized volumes r
To further analyze the branching of organoids as a function of time, the morphology of the growing organoids was determined by measuring their area and perimeter. If the perimeter compared to area is large, compared that of a disk, there is a high degree of organoid branching. In order to have a measure for branching, that is, independent of the overall size or the organoid, the perimeter2/area ratio, which is dimensionless, was calculated for each organoid at each Matrigel concentrations at day 4 and at day 7. This ratio was normalized by 4π, which is the value of the ratio for a perfect disk. Hence, the measure depicted in Figure 5C) is perimeter2/area for an organoid divided by the same ratio for a disk. If the measure exceeds 1, the organoid has some degree of branching. This measure of branching is plotted in Figure 5C) as a function of time elapsed since seeding of the organoids in the Matrigel matrix. Notice that even at the first time point (D4), the elastic properties of the matrix have reached their static behavior (cf Figure 2B).
D’Agostino tests performed on the distributions shown in Figure 5C showed that a fair fraction of the distributions were not normally distributed. Hence, to evaluate whether the distributions were statistically significantly different, Mann-Whitney U tests were performed. At day 4 after seeding, organoids embedded in Matrigel matrices at all tested concentrations showed minimal branching with an average normalized perimeter2/(4πarea) value between 1.06 and 1.08. At this early developmental stage there is, however, already significantly more branching in the 75% Matrigel concentration than in the 50% Matrigel concentration (p = 5.7e-3). At day 7, organoids embedded in the 75% Matrigel matrix have visibly and statistically significantly more branching than those embedded in the 50% (p = 2.9e-04) and the 25% Matrigel matrices (p = 1.8e-3). The average values of normalized perimeter2/(4πarea) at day 7 for the 25%, 50%, and 75% Matrigel concentrations are
These results show a correlation between the biophysical properties of the medium that organoids are seeded in and the developing morphology of organoids. When the Matrigel concentration is higher, the matrix becomes stiffer, as measured both by the power spectral method and through shear- and storage moduli. A higher degree of branching during pancreas organoid growth is observed for matrices of higher stiffness.
While one may have expected that the stiffness of the environment may either promote growth [41] or limit it by its resistance to compression, this was not observed in the range tested. Instead, the more rigid matrix affects the degree of organoid branching, with more branching observed at higher Matrigel concentrations. It is possible that when an organoid has penetrated a certain region of a rigid medium, the organoid expands more easily at this position and hence creates branches here. More of the organoid’s growth will then appear at this position compared to the case of a less rigid growth medium where a more uniform expansion is easier. This may be alike what was reported during the formation of cortical gyri where a mechanical instability due to tangential expansion of cells has non-linear consequences [42].
Conclusion
Optical tweezers-based micro-rheology provides a simple method to quantify visco-elastic properties in a highly localized manner and potentially deep within a sample over a large frequency range. Here, we tracked thermal fluctuations of tracer particles inside Matrigel solutions while systematically varying polymer concentrations. This allowed for extraction of the visco-elastic properties of the polymer matrix at different polymer concentrations; the visco-elastic properties were quantified though the scaling properties of the tracer particle’s positional power spectrum and by calculating the complex shear moduli.
The visco-elastic properties of a Matrigel-based polymer matrix were found to be highly dependent on polymer concentration, the higher the polymer concentration, the more elastic (less viscous) the matrix. Also, we found that the visco-elastic properties of the Matrigel matrix change over time, with the matrix being more viscous when it is first made and after a few hours it becomes more elastic and settles to a permanent degree of elasticity.
Organoids embedded in a higher Matrigel concentration developed a larger degree of branching, however, their overall size did not change with Matrigel concentration. Being aware of the fact that organoid growth morphology is dependent on Matrigel concentration will be important for bioengineering of proper growth matrices and for understanding how tissues mechanically interact with their environment.
Data Availability Statement
The raw data supporting the conclusions of this article will be made available by the authors, without undue reservation.
Author Contributions
The study was designed by LBO, MB, YFB, KBS and AGB. The experimental data was acquired and analyzed by MB, YFB and SY. All authors discussed all results and participated in writing the manuscript.
Conflict of Interest
The authors declare that the research was conducted in the absence of any commercial or financial relationships that could be construed as a potential conflict of interest.
Acknowledgments
The authors acknowledge financial support from the Danish National Research Council, grant number DNRF116. The Novo Nordisk Foundation Center for Stem Cell Biology is supported by a Novo Nordisk Foundation grant number NNF17CC0027852.
References
1. Lo, CM, Wang, HB, Dembo, M, and Wang, YL. Cell movement is guided by the rigidity of the substrate. Biophys J (2000). 79:144–52. doi:10.1016/S0006-3495(00)76279-5
2. Kim, MC, Silberberg, YR, Abeyaratne, R, Kamm, RD, and Asada, HH. Computational modeling of three-dimensional ECM-rigidity sensing to guide directed cell migration. Proc Natl Acad Sci USA (2018). 115:E390–9. doi:10.1073/pnas.1717230115
3. Wells, RG. The role of matrix stiffness in regulating cell behavior. Hepatology (2008). 47:1394–400. doi:10.1002/hep.22193
4. Shin, JW, and Mooney, DJ. Extracellular matrix stiffness causes systematic variations in proliferation and chemosensitivity in myeloid leukemias. Proc Natl Acad Sci USA (2016). 113:12126–31. doi:10.1073/pnas.1611338113
5. Cavo, M, Fato, M, Peñuela, L, Beltrame, F, Raiteri, R, and Scaglione, S. Microenvironment complexity and matrix stiffness regulate breast cancer cell activity in a 3D in vitro model. Sci Rep (2016). 6, 35367. doi:10.1038/srep35367
6. Smith, LR, Cho, S, and Discher, DE. Stem cell differentiation is regulated by extracellular matrix mechanics. Physiology (2018). 33:16–25. doi:10.1152/physiol.00026.2017
7. Hwang, JH, Byun, MR, Kim, AR, Kim, KM, Cho, HJ, Lee, YH, et al. Extracellular matrix stiffness regulates osteogenic differentiation through MAPK activation. PLoS One (2015). 10:1–16. doi:10.1371/journal.pone.0135519
8. Olsen, AL, Bloomer, SA, Chan, EP, Gaça, MDA, Georges, PC, Sackey, B, et al. Hepatic stellate cells require a stiff environment for myofibroblastic differentiation. Am J Physiol Gastrointest Liver Physiol (2011). 301:G110–8. doi:10.1152/ajpgi.00412.2010
9. Wullkopf, L, West, AKV, Leijnse, N, Cox, TR, Madsen, CD, Oddershede, LB, et al. Cancer cells’ ability to mechanically adjust to extracellular matrix stiffness correlates with their invasive potential. Mol Biol Cell (2018). 29:2378–85. doi:10.1091/mbc.E18-05-0319
10. Bordeleau, F, Mason, BN, Lollis, EM, Mazzola, M, Zanotelli, MR, Somasegar, S, et al. Matrix stiffening promotes a tumor vasculature phenotype. Proc Natl Acad Sci USA (2017). 114:492–7. doi:10.1073/pnas.1613855114
11. Soofi, SS, Last, JA, Liliensiek, SJ, Nealey, PF, and Murphy, CJ. The elastic modulus of matrigel™ as determined by atomic force microscopy. J Struct Biol (2009). 167:216–9. doi:10.1016/j.jsb.2009.05.005
12. Koutsopoulos, S, and Zhang, S. Long-term three-dimensional neural tissue cultures in functionalized self-assembling peptide hydrogels, matrigel and collagen I. Acta Biomater (2013). 9:5162–9. doi:10.1016/j.actbio.2012.09.010
13. Tolić-Nørrelykke, IM, Munteanu, EL, Thon, G, Oddershede, L, and Berg-Sørensen, K. Anomalous diffusion in living yeast cells. Phys Rev Lett (2004). 93:078102. doi:10.1103/PhysRevLett.93.078102
14. Wessel, A, Maheshwar, G, Grosshans, J, and Schmidt, C. The mechanical properties of early drosophila embryos measured by high-speed video microrheology. Biophys J (2015). 108:1899–1907. doi:10.1016/j.bpj.2015.02.032
15. MacKintosh, F, Kas, J, and Janmey, P. Elasticity of semiflexible biopolymer networks. Phys Rev Lett (1995). 75:4425–8. doi:10.1103/PhysRevLett.75.4425
16. Greggio, C, De Franceschi, F, Figueiredo-Larsen, M, and Grapin-Botton, A. In vitro pancreas organogenesis from dispersed mouse embryonic progenitors. J Vis Exp (2014). (89):51725. doi:10.3791/51725
17. Greggio, C, De Franceschi, F, and Grapin-Botton, A. Concise reviews: in vitro-produced pancreas organogenesis models in three dimensions: self-organization from few stem cells or progenitors. Stem Cell (2015). 33:8–14. doi:10.1002/stem.1828
18. Gittes, F, and Schmidt, CF. Interference model for back-focal-plane displacement detection in optical tweezers. Opt lett (1998). 23:7–9. doi:10.1364/ol.23.000007
19. Allersma, MW, Gittes, F, DeCastro, MJ, Stewart, RJ, and Schmidt, CF. Two-dimensional tracking of ncd motility by back focal plane interferometry. Biophys J (1998). 74:1074–85. doi:10.1016/S0006-3495(98)74031-7
20. Rohrbach, A. Stiffness of optical traps: quantitative agreement between experiment and electromagnetic theory. Phys Rev Lett (2005). 95:168102. doi:10.1103/PhysRevLett.95.168102
21. Svoboda, K, and Block, SM. Biological applications of optical forces. Annu Rev Biophys Biomol Struct (1994). 23:247–85. doi:10.1146/annurev.bb.23.060194.001335
22. Gittes, F, and Schmidt, CF. Signals and noise in micromechanical measurements. Methods Cell Biol (1998). 55:129–56. doi:10.1016/S0091-679X(08)60406-9
23. Schnurr, B, Gittes, F, MacKintosh, F, and Schmidt, C. Determining microscopic viscoelasticity in flexible and semiflexible polymer networks from thermal fluctuations. Macromolecules (1997). 30:7781–92. doi:10.1021/MA970555N
24. Pesce, G, De Luca, AC, Rusciano, G, Netti, PA, Fusco, S, and Sasso, A. Microrheology of complex fluids using optical tweezers: a comparison with macrorheological measurements. J Opt A Pure Appl Opt (2009). 11:034016. doi:10.1088/1464-4258/11/3/034016
25. Mizuno, D, Head, DA, MacKintosh, FC, and Schmidt, CF. Active and passive microrheology in equilibrium and nonequilibrium systems. Macromolecules (2008). 41:7194–202. doi:10.1021/ma801218z
26. Berg-Sørensen, K, Oddershede, L, Florin, EL, and Flyvbjerg, H. Unintended filtering in a typical photodiode detection system for optical tweezers. J Appl Phys (2003). 93:3167–76. doi:10.1063/1.1554755
27. Xing, Q, Qian, Z, Jia, W, Ghosh, A, Tahtinen, M, and Zhao, F. Natural extracellular matrix for cellular and tissue biomanufacturing. ACS Biomater Sci Eng (2016). 3:1462–76. doi:10.1021/acsbiomaterials.6b00235
28. Uriel, S, Labay, E, Francis-Sedlak, M, Moya, ML, Weichselbaum, RR, Ervin, N, et al. Extraction and assembly of tissue-derived gels for cell culture and tissue engineering. Tissue Eng C (2009). 15:309–21. doi:10.1089/ten.tec.2008.0309
29. Francis, MP, Sachs, PC, Madurantakam, PA, Sell, SA, Elmore, LW, Bowlin, GL, et al. Electrospinning adipose tissue-derived extracellular matrix for adipose stem cell culture. J Biomed Mater Res (2012). 100A:1716–24. doi:10.1002/jbm.a.34126
30. Lin, M, Jingwu, L, Qiang, N, Qiuyang, Z, Qiuyang, Z, Sen, L, et al. Organoid culture of human prostate cancer cell lines LNCaP and C4-2B. Am J Clin Exp Urol (2017). 5:25–33. doi:10.1002/ijc.33315
31. Molina-Jimenez, F, Benedicto, I, Thi, VLD, Gondar, V, Lavillette, D, Marin, JJ, et al. Matrigel-embedded 3D culture of huh-7 cells as a hepatocyte-like polarized system to study hepatitis C virus cycle. Virology (2012). 425:31–9. doi:10.1016/j.virol.2011.12.021
32. Drost, J, Karthaus, WR, Gao, D, Driehuis, E, Sawyers, CL, Chen, Y, et al. Organoid culture systems for prostate epithelial and cancer tissue. Nat Protoc (2016). 11:347–58. doi:10.1038/nprot.2016.006
33. Sodunke, TR, Turner, KK, Caldwell, SA, McBride, KW, Reginato, MJ, and Noh, HM. Micropatterns of matrigel for three-dimensional epithelial cultures. Biomaterials (2007). 28:4006–16. doi:10.1016/j.biomaterials.2007.05.021
34. Hughes, CS, Postovit, LM, and Lajoie, GA. Matrigel: a complex protein mixture required for optimal growth of cell culture. Proteomics (2010). 10:1886–90. doi:10.1002/pmic.200900758
35. Kuo, CT, Wang, JY, Lin, YF, Wo, AM, Chen, BPC, and Lee, H. Three-dimensional spheroid culture targeting versatile tissue bioassays using a PDMS-based hanging drop array. Sci Rep (2017). 7:4363. doi:10.1038/s41598-017-04718-1
36. Anguiano, M, Castilla, C, Maska, M, Ederra, C, Pelaez, R, Morales, X, et al. Characterization of three-dimensional cancer cell migration in mixed collagen-matrigel scaffolds using microfluidics and image analysis. PLoS One (2017). 12:e0171417. doi:10.1371/journal.pone.0171417
37. Cui, X, Hartanto, Y, and Zhang, H. Advances in multicellular spheroids formation. J R Soc Interface (2017). 14:20160877. doi:10.1098/rsif.2016.0877
38. Berg-Sørensen, K, and Flyvbjerg, H. Power spectrum analysis for optical tweezers. Rev Sci Instrum (2004). 75:594–612. doi:10.1063/1.1645654
39. Hansen, PM, Tolić-Nørrelykke, IM, Flyvbjerg, H, and Berg-Sørensen, K. Tweezercalib 2.0: faster version of matlab package for precise calibration of optical tweezers. Comput Phys Commun (2006). 174:518–20. doi:10.1016/j.cpc.2005.11.007
40. Loosemore, VE, and Forde, NR. Effects of finite and discrete sampling and blur on microrheology experiments. Opt Express (2017). 25:31239–52. doi:10.1364/OE.25.031239
41. Gjorevski, N, Sachs, N, Manfrin, A, Giger, S, Bragina, ME, Ordóñez-Morán, P, et al. Designer matrices for intestinal stem cell and organoid culture. Nature (2016). 539:560–4. doi:10.1038/nature20168
Keywords: optical trapping, viscoelasticity, polymer network, complex shear moduli, organoid development
Citation: Borries M, Barooji YF, Yennek S, Grapin-Botton A, Berg-Sørensen K and Oddershede LB (2020) Quantification of Visco-Elastic Properties of a Matrigel for Organoid Development as a Function of Polymer Concentration. Front. Phys. 8:579168. doi: 10.3389/fphy.2020.579168
Received: 01 July 2020; Accepted: 22 September 2020;
Published: 30 October 2020.
Edited by:
Halina Rubinsztein-Dunlop, The University of Queensland, AustraliaReviewed by:
Khoi Tan Nguyen, Vietnam National University, VietnamJianming Wen, Kennesaw State University, United States
Copyright © 2020 Borries, Barooji, Yennek, Grapin-Botton, Berg-Sørensen and Oddershede. This is an open-access article distributed under the terms of the Creative Commons Attribution License (CC BY). The use, distribution or reproduction in other forums is permitted, provided the original author(s) and the copyright owner(s) are credited and that the original publication in this journal is cited, in accordance with accepted academic practice. No use, distribution or reproduction is permitted which does not comply with these terms.
*Correspondence: Lene B. Oddershede, b2RkZXJzaGVkZUBuYmkua3UuZGs=
#Present address: Kirstine Berg-Sørensen Department of Health Technology, Technical University of Denmark, Kgs Lyngby, Denmark