 Vipin Tiwari
 Namrata Deyal
 Nandan S. Bisht
- Department of Physics, Kumaun University, Uttarakhand, India
COVID-19 (SARS-CoV-2) is rapidly spreading in South Asian countries, especially in India. India is the fourth most COVID-19 affected country at present i.e., until July 10, 2020. With limited medical facilities and high transmission rate, the study of COVID-19 progression and its subsequent trajectory needs to be analyzed in India. Epidemiologic mathematical models have the potential to predict the epidemic peak of COVID-19 under different scenarios. Lockdown is one of the most effective mitigation policies adopted worldwide to control the transmission rate of COVID-19 cases. In this study, we use an improvised five compartment mathematical model, i.e., Susceptible (S)-Exposed (E)-Infected (I)-Recovered (R)-Death (D) (SEIRD) to investigate the progression of COVID-19 and predict the epidemic peak under the impact of lockdown in India. The aim of this study is to provide a more precise prediction of epidemic peak and to evaluate the impact of lockdown on epidemic peak shift in India. For this purpose, we examine the most recent data (from January 30, 2020 to July 10, 2020 i.e., 160 days) to enhance the accuracy of outcomes obtained from the proposed model. The model predicts that the total number of COVID-19 active cases would be around 5.8 × 10⁵ on August 15, 2020 under current circumstances. In addition, our study indicates the existence of under-reported cases i.e., 105 during the post-lockdown period in India. Consequently, this study suggests that a nationwide public lockdown would lead to epidemic peak suppression in India. It is expected that the obtained results would be beneficial for determining further COVID-19 mitigation policies not only in India but globally as well.
Introduction
COVID-19 is a contagious disease of the Severe Acute Respiratory Syndrome Corona Virus (SARS-COV) family, and has emerged as the biggest health crisis of the twenty-first century across the globe. It has been declared as a global pandemic by World Health Organization (WHO) on March 11, 2020 just after a few months since its first case reported in Wuhan, China [1]. COVID-19 infected patients generally exhibit common symptoms like cough, fever and respiratory disorders. In the worst conditions, it might result in serious health issues like kidney failure, and pneumonia which might cause death of patients. Investigations on COVID-19 indicate that it transmits through respiratory droplets, as well as human to human transition [2].
The most serious issue with the COVID-19 pandemic is its rapidly growing transmission rate across the world. Until July 10, 2020, total confirmed cases in world are 1.2 × 10⁷ and total number of deaths are 5.5 × 10⁵ [3]. United States of America (USA), Brazil, Russia, India and United Kingdom (UK) are the top five most COVID-19 affected countries until July 10, 2020 [4]. Although researchers across the world are working on a vaccination for COVID-19 to suppress its rapid dissemination [5], an official vaccination of COVID-19 will not be available for some time. Therefore, the preliminary mitigation policies i.e., social distancing, public lockdown and improved testing efficiency are vital steps to control the transmission rate of COVID-19 worldwide [6].
Despite several mitigation policies, COVID-19 cases are in an alarming situation in South Asian countries, particularly in India. Being a developing nation and the second largest populous country in the world, it is very challenging to control the spread of COVID-19 in India. The first COVID-19 confirmed case was reported in Kerala, India on January 30, 2020 [4]. Under the lack of sufficient medical facilities in a country of 1.3 billion people, various preliminary containment strategies have been implemented by the government of India in the beginning phase of COVID-19 transmission [7–9]. Social distancing and several social awareness programs have been initiated as the first precautionary steps to prevent the possibility of human-to-human transmission. The primary goal of these strategies is to control the main cause of COVID-19 transmission i.e., the social interaction in public places i.e., schools, colleges, theaters, cultural and sports events excluding the essential public services like hospitals, daily grocery shops, banks, and police. On March 25, 2020 the Indian government announced the first official nationwide lockdown for 14 days [9]. Subsequently, the public lockdown has been implemented in five different phases in India. In the second and third phase, the lockdown has been extended up to April 15, 2020 and May 03, 2020 respectively to achieve better control on COVID-19 transmission in India. However, few relaxations (conditional inter-state travel, resuming domestic flights) in full lockdown have been provided by Indian government in the fourth (May 04- May 17, 2020) and fifth phases (May 18- May 31, 2020) of lockdown respectively. On June 01, 2020 onwards, the nationwide lockdown was partially lifted in India. Unfortunately, it resulted in a sudden growth in COVID-19 cases in the last 40 days. At present, the number of COVID-19 cases are dramatically increasing in India and tending toward its epidemic peak [10]. Therefore, it is necessary to study the dynamics and predict the future inflammation of COVID-19 in India.
Mathematical models have the potential to trace and predict the epidemic trajectory under different circumstances. Various mathematical, statistical models have been proposed to understand the dissemination trajectory for a pandemic [11–34]. Among these models, Susceptible (S)-Infected (I)-Recovered (R) model (SIR model) has been frequently used in past to predict the dynamics of various contagious diseases i.e., HIV virus [11], plague [12], SARS [13]. Recently, SIR model has also been applied for prediction of COVID-19 trajectory and its epidemic peak in all over the world [15–19]. Numerous relevant studies have been carried out in India as well [20–34]. A COVID-19 simulation models i.e., IndiaSIM have been proposed by Center for Disease Dynamics, Economics & Policy (CDDEP) to predict COVID-19 infected cases under different lockdown periods in India [25]. This model predicts the total infected cases as 106 under pre-lockdown conditions and 1.5 × 10⁶ under lockdown conditions, respectively. Pai et al. investigated the COVID-19 transmission dynamics under the effect of lockdown. This study predicts that the peak of active infected cases around 43,000 will occur in the middle of May, 2020 [29]. In another study, a compartmental mathematical model to predict COVID-19 dynamics has been proposed by analyzing data up to April 30, 2020. This study mainly focuses on the computation of basic reproduction number (R0) for COVID-19 spread and its impact on epidemic transmission in India. Moreover, Sarkar et al. proposed a six compartment mathematical model i.e., susceptible (S), asymptomatic or pauci-symptomatic infected (A), symptomatic reported infected (I), unreported infected (U), quarantine (Q), and recovered (R) [“SAIUQR” model] to predict the COVID-19 dynamics in four major states of India i.e., Jharkhand, Gujarat, Andhra Pradesh, and Chandigarh [33]. However, such studies have been carried out at the very early stage of the pandemic. Further a major problem for such short-term predictions is the determination of crucial model parameters and corresponding impact of intervention strategies on the epidemic dynamics. Moreover, these studies mainly predict the number of active cases from COVID-19 at particular region whereas the mortality i.e., death rate is also a crucial factor to take into account while forecasting the influence of a fatal pandemic i.e., COVID-19. In addition, it is pointed out in earlier studies that under-reporting i.e., the difference between the reported cases and actual confirmed cases is another vital parameter in prediction of COVID-19 trajectory [16]. A data=based study on impact of abrupt changes in intervention policies (testing) and corresponding population synchrony with transmission dynamics of Bovine-tuberculosis has been discussed [14]. It depicts how testing interruptions can alter the epidemic parameters and shift the dynamics of disease, and suggests regular testing leads to more de-synchronized infected cases.
In this study, we propose an improvised five compartment mathematical model i.e., Susceptible (S)-Exposed (E)-Infected (I)-Recovered (R)-Death (D) (SEIRD model) to analyze the progression of COVID-19 and forecast the epidemic peak of COVID-19 pandemic under the influence of a nationwide public lockdown in India. We use robust statistical methods i.e., linear regression method and least square method to estimate the SEIRD model parameters by analyzing publicly available reported data of COVID-19 outbreak in India. In particular, a few crucial factors i.e., optimized transmission rate, effective reproduction number [R (t)] and under-reporting are incorporated in this study for accounting impact of public lockdown. Consolidation of these additional parameters is helpful to provide a broader picture of COVID-19 dissemination in India.
Materials and Methods
Data Collection
The data has been collected from the open source COVID-19 dataset official websites [3, 4, 9]. Global data of COVID-19 has been retrieved from World Health Organization (WHO) official dashboard [3] whereas publicly available data sources [4, 9] have been used to perform data based study COVID-19 progression in India.
Figures 1A–C represents the spatial transmission of COVID-19 cases in India during three time periods i.e., pre-lockdown (January 30- March 24, 2020), lockdown (March 25-May 31, 2020) and post-lockdown periods (June 1-July 10, 2020). It clearly indicates that COVID-19 cases are least transmitted during the lockdown period as compared to pre-lockdown and post-lockdown across different states of India.
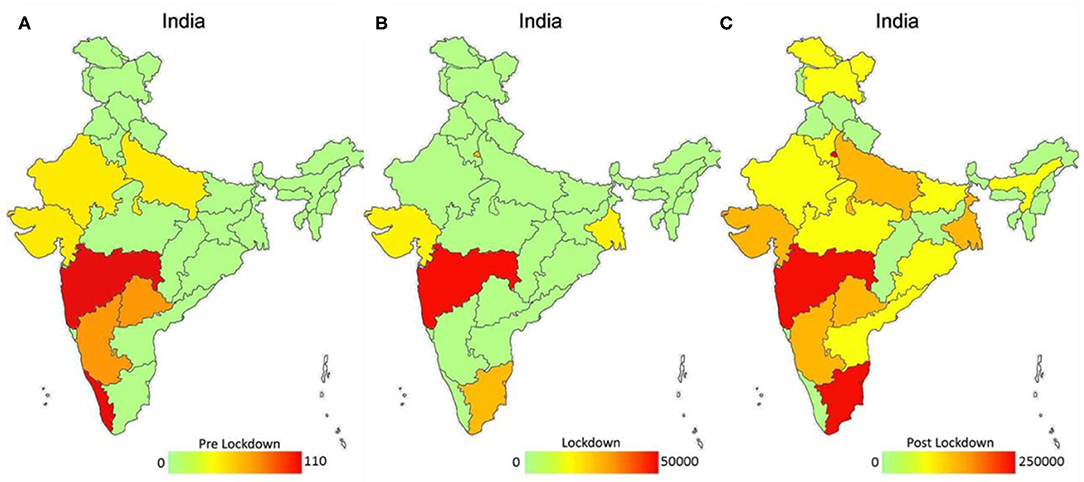
Figure 1. Spatial distribution of COVID-19 reported confirmed cases under the effect of lockdown in India (A–C). Color bar represents the spatial variation of confirmed cases from lowest (green color) to highest (red color) under three phases of lockdown i.e., pre-lockdown (A), during lockdown (B) and post-lockdown (C) in India.
SEIRD Model
We used a five-compartment epidemic model i.e., Susceptible (S)-Exposed (E)-Infected (I)-Recovered (R)-Death (D) (SEIRD model) to study COVID-19 in India. The SEIRD model has been improvised to account for the effect of the containment policy (lockdown) by adjusting the contact rate (β) and reproduction number (R) accordingly. Figure 2 represents a pictorial view of SEIRD model.
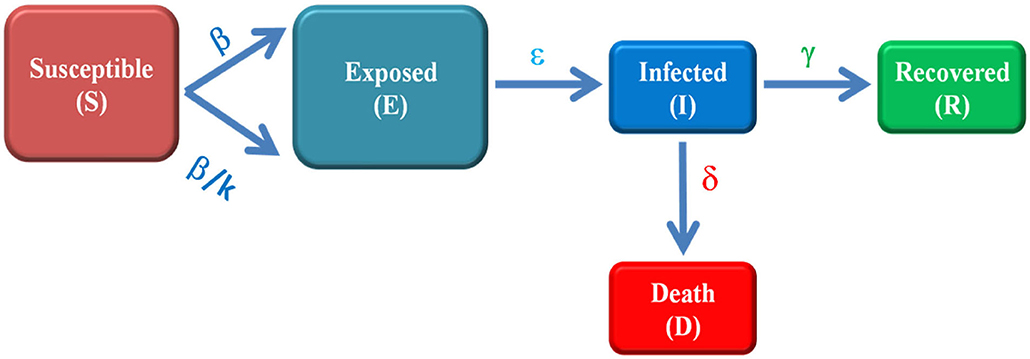
Figure 2. Schematic of modified SEIRD model. Susceptible (S) is the number of un-infected persons, exposed (E) are the individuals which are infectious but not able to transmit the disease, infected (I) represent the active cases i.e., those who can transmit the disease, recovered (R) are the number of individuals who have been cured from disease and Death (D) represents the number of deaths from COVID-19. The parameters β, ε, γ and δ are transmission rate, incubation rate, recovery rate and death rate, respectively. The transmission rate (β) is optimized to β/k, (0.2 ≤ k ≤ 1) to account for the impact of lockdown.
Theoretically, the SEIRD model can be represented by four differential equations [16]
Here β, ε, γ and δ are contact rate/transmission rate, incubation rate, recovery rate and death rate, respectively and known as model parameters.
SEIRD Model Parameters
Equations (1.1–1.5) are solved in Matlab programming software (Mathworks, R2016a) using ordinary differential equations solver function “ode45.” In this study, initial susceptible volume has been determined by multiplying the total population of India (N) with a factor 10−3 [20]. The total confirmed cases have been estimated by adding the number of infected (active) cases, recovered cases and number of deaths predicted from the model. The data is fitted with the SEIRD model to predict the possible total confirmed cases in India under the effect of lockdown. The fixed value of incubation period i.e., 5.2 days (incubation rate = 0.1923 day−1) is used in our model [21]. However, the recovery rate (γ) and death rate (δ) has been calculated with the help of Figures 3A,B, respectively. To estimate the transmission rate (β), the least square method is used to optimize the value of β [23]. We have minimized the difference between reported cases taken from [4] and predicted the number of cases as
Here C*(t) represents the data based total number of confirmed cases and C(t) represents the corresponding number of cases predicted by model. The numerical values of C(t) can be computed as [28]
Further, we have assumed that β has been changed to β/k, (0.2 ≤ k ≤ 1) under the impact of lockdown in India [29] and projected the number of total confirmed cases for the estimated β. Out of these estimated values of β, the most suitable value i.e., β = 0.4809 is used to obtain the best fit for predicted number of cases with reported number of cases. These SEIRD model parameters are listed in Table 1.
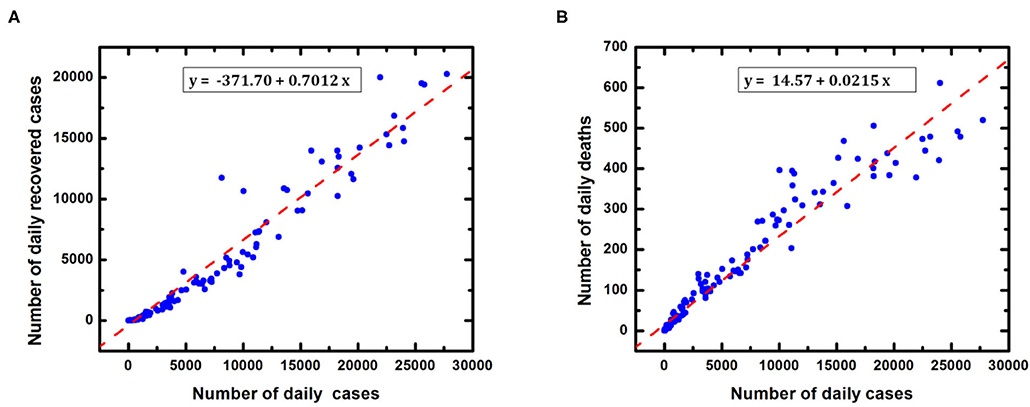
Figure 3. Determination of recovery rate and death rate in India (A) Reported recovered cases (B) Reported deaths with respect to daily confirmed cases. The recovery rate (γ) and death rate (δ) have been estimated using linear regression method with r = 0.9701 and p < 0.0001.
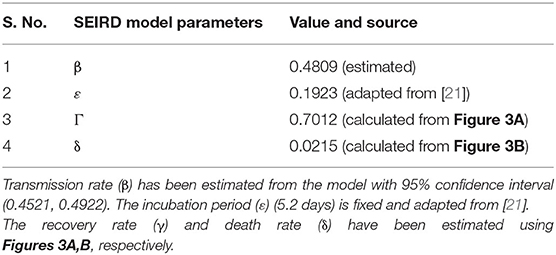
Table 1. SEIRD model parameters.
Effective Reproduction Number [R (t)]
The basic reproduction number (R0) is the most crucial parameter in the SEIRD mathematical model. It determines how the disease is transmitting over the population during a particular time interval. The value of R0 > 1 implies the disease is in outbreak state, R0 = 1 indicates that the disease is still in system but in a stable state while R0 < 1 represents the disease has diminished completely. In practice, the effective reproductive number R (t) measures the number of secondary cases generated by an infectious case once an epidemic is ongoing. In our study, we have considered R as R(t) i.e., as a function of time [17]. It is given as
Case Fatality Risk/ratio (CFR) is another important parameter for epidemic study. It interprets the status of epidemic in terms of deaths. It is defined as [16]
Results and Discussion
At first, we performed a data-based study of COVID-19 progression in India during the time period of January 30-July 10, 2020 i.e., 160 days. We have observed the trend of COVID-19 under the impact of lockdown. Figure 4A represents the number of cases progression over time and indicates that the COVID-19 cases were negligible in pre-lockdown period. It implies that the lockdown has been implemented at the beginning phase of COVID-19 transmission in India. Further on comparing the cases in the lockdown and post lockdown periods, clearly our results show that the cases are much fewer during the lockdown period, and have increased abruptly just after lockdown lifted. Similarly, Figure 4B depicts the variation of testing samples under the impact of lockdown. It is observed that a negligible amount (20,864) of samples have been tested during pre-lockdown period [3] which implies that a number of cases might have not been reported during the pre-lockdown period as well. In fact, first sample testing data has been reported on March 13, 2020 in India. Upon further analyzing the sample testing data, an increasing trend of testing samples was observed with respect to time. Apparently, a lesser number of samples had been tested during the lockdown period as compared to the post-lockdown period. Moreover, an identical ascending trend has been noticed for number of cases and number of testing samples. In addition, Figure 4C indicates that CFR is very low (1–3%) in India i.e., COVID-19 fatality is below average as compared to other countries in the world. However, CFR also increases rapidly in the post-lockdown period.
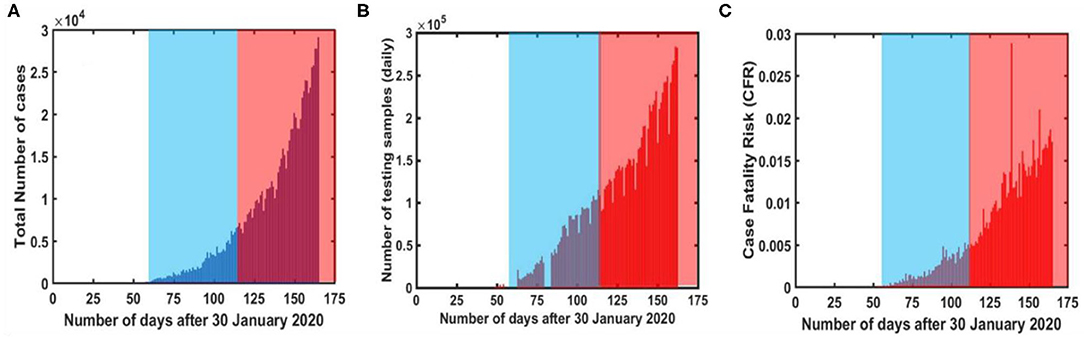
Figure 4. COVID-19 reported data [5] based analysis during different time intervals in India (A) Reported number of daily cases (B) daily tested samples (C) Case Fatality Ratio (CFR). The time interval has been divided into three sections i.e., pre-lockdown, during lockdown (blue shaded area) and post-lockdown (red shaded area), respectively.
Figure 5A represents the variation in effective reproduction number at various phases of lockdown in India. A descending trend has been observed in R during the lockdown period, whereas it hikes again as the lockdown is lifted i.e., in post lockdown period. Further observations suggest that R (t) approaches unity around August 25, 2020. It indicates that the epidemic peak should appear in August 2020 in India. Apart from this, Figure 5B represents the possible under-reported cases in India. It can be defined as the difference in the total confirmed cases predicted from model and data based reported cases [17]. A significant number of underreported cases (~105) has been observed in the beginning of post lockdown in India.
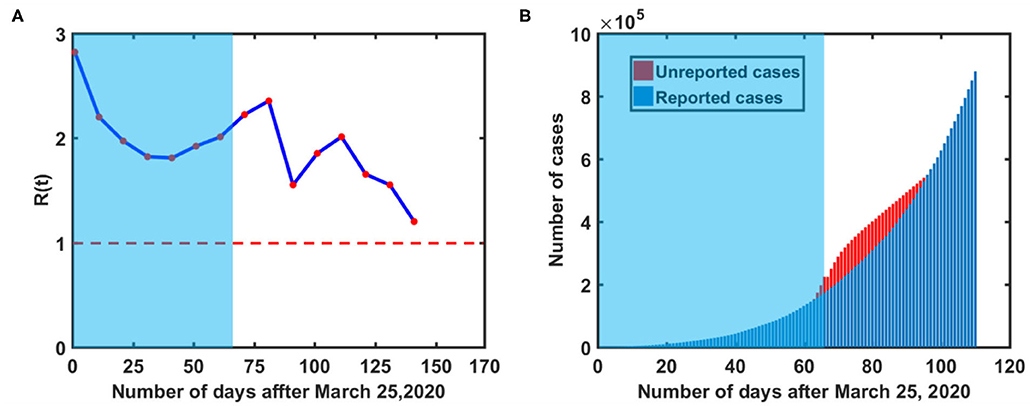
Figure 5. COVID-19 reported data-based analysis during different time intervals in India, (A) Basic Reproduction number variation over time (B) estimation of underreported cases. Red colored dashed line in (A) represents the threshold value of reproduction number i.e., R(t) = 1. The red colored region in (B) represents possible under-reported cases in India. [Blue shaded region represents actual lockdown period].
Prediction of COVID-19 Epidemic Peak in India
To forecast the trajectory of COVID-19 in subsequent months, we have applied the SEIRD model to predict the trajectory of COVID-19 under the nationwide lockdown in India. Figure 6A represents the actual transmission dynamics of all five compartments (susceptible, exposed, infected, recovered and death) for COVID-19 in India. Figure 6B provides more clear insights of the epidemic peak in India based on actual model parameters. It is estimated that the maximum number of COVID-19 confirmed cases and active cases should be found around 2.5 × 10⁶ and 5.8 × 10⁵ respectively at mid-August 2020. The red colored markers represent the COVID−19 trajectory based on reported data [4]. On the other hand, Figure 7A shows the five-compartment (SEIRD) trajectory under the pre-lockdown condition in India. It indicates that the number of cases would be around 107 in that case. Moreover, Figure 7B depicts if a lockdown of 100 days could have been implemented instead of 65 days, the number of cases would be much lower i.e., 105. However, the peak would be shifted to mid-September 2020 in that case.
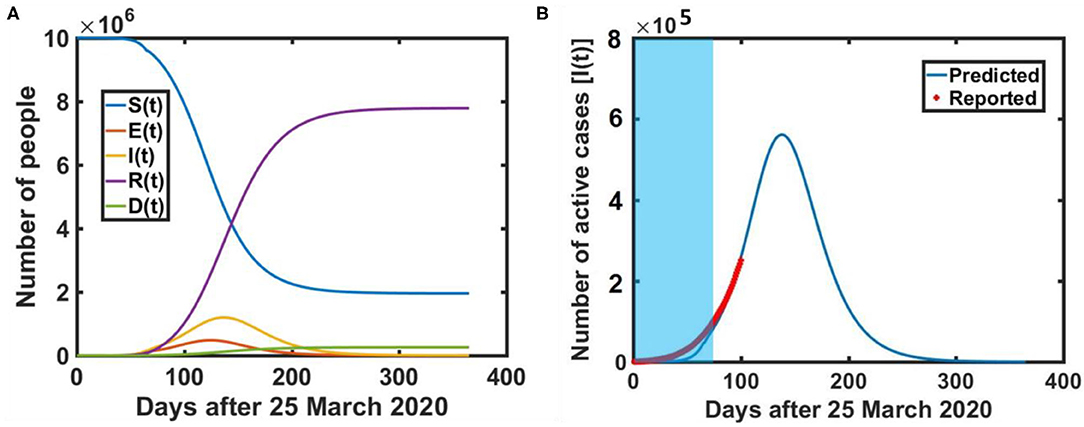
Figure 6. Mathematical model prediction of COVID-19 dissemination in India, (A) Five compartment trajectory over time (B) COVID-19 epidemic peak i.e., maximum active cases prediction in India. [Blue shaded region represents the actual lockdown period]. The incubation period and recovery rate are taken as 5.2 days (incubation rate = 1/5.2 day−1) is 0.7012 day−1 respectively.
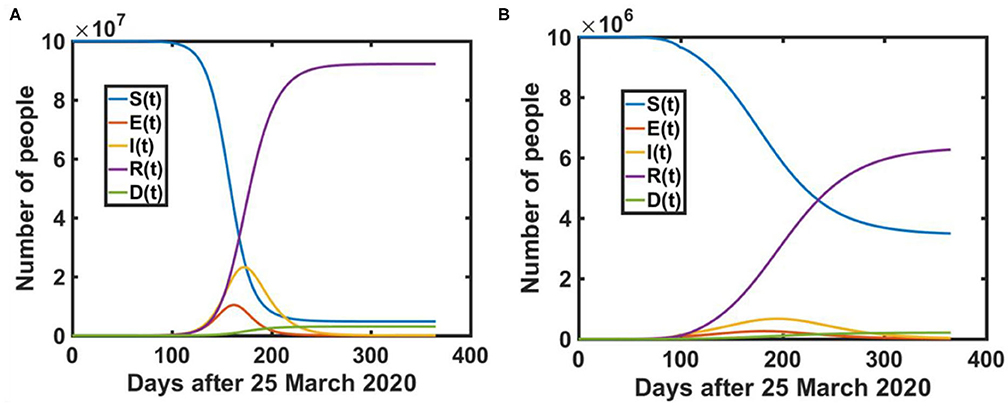
Figure 7. Mathematical model prediction of COVID-19 dissemination in India under (A) without lockdown (B) Lockdown of 100 days. The incubation period and recovery rate are taken as 5.2 days (incubation rate = 1/5.2 day−1) is 0.7012 day−1 respectively.
Table 2 represents the predicted numerical data under various lockdown possibilities in India. Observations show that the cases could be order of 107, if lockdown had not been implemented in India whereas a lockdown of 100 days instead of 65 days could suppress the cases to up to 50% of the actual cases prediction in India.
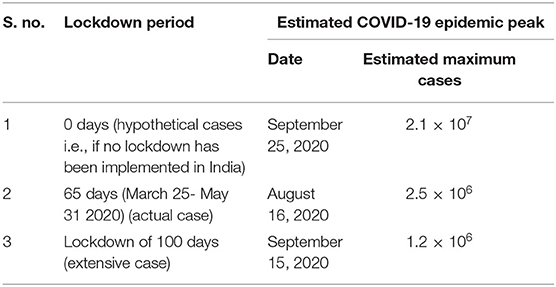
Table 2. COVID-19 epidemic peak prediction using SEIRD model in India under lockdown effect.
Conclusion
In this study, we have analyzed and predicted COVID-19 dissemination dynamics in India using a five-compartment mathematical model i.e., SEIRD model. The conventional SEIRD model has been improvised for accounting the impact of COVID-19 mitigation policy i.e., nationwide lockdown in India. The modified transmission rate [β/k, (0.2 ≤ k ≤ 1)] based on intervention strategies i.e., lockdown, time dependent reproduction number [R (t)] and determination of under reported cases are the key elements of our improvised SEIRD model. Moreover, the data has been examined up to July 10, 2020 in this study. The data based study suggests that COVID-19 inflammation has been controlled up to 50% by implementing public lockdown in India at the starting phase of disease transmission. Results indicated that the effective reproduction number has been varied within a range of 2 to 3 during the lockdown period. On the other hand, a relationship has been established between testing efficacy and disease transmission in an earlier study [34]. Our study strongly recommends improved testing efficiency (higher number of sample testing) as one of the robust strategies against COVID-19 spread worldwide. However, a significant number of un-reported cases (~105) have been identified in early post-lockdown period in India. The possible reasons for this underreporting might be inconsistency in testing samples or abrupt release of lockdown.
In addition, the COVID-19 epidemic peak has also been estimated under different possible lockdown scenarios using the mathematical model. This study predicts the maximum number of total confirmed cases and maximum active cases around 2.5 × 10⁶ and 5.8 × 10⁵, respectively on August 15, 2020. Corresponding outcomes imply that COVID-19 cases could have been controlled up to a better extent with an extensive lockdown period. Although nationwide lockdown has been implemented at the emerging phase of COVID-19 in India, this was only for 65 days. Keeping in mind the population and medical facilities in India, such a short lockdown period might not be sufficient in order to suppress COVID-19 transmission. Our study suggests that the lockdown could have been extended up to 100 days to achieve better control over COVID-19 transmission. Apart from this, the researchers around the world are engaged in developing a vaccine for SARS-COV-2. Therefore, one can expect that the evolution of such pharmaceutical intervention strategies and other medical interventions against COVID-19 might modify the outcomes of this study.
In brief, this study recommends the nationwide public lockdown as an effective controlling policy for COVID-19 dissemination, not only in India but across the globe. It will definitely play a crucial role in epidemic peak suppression of COVID-19 dissemination. Although our improvised SEIRD model provides satisfactory results, one can include few additional parameters i.e., imported or exported cases, asymptotic cases, under-reported cases etc. to enhance the validity of mathematical model while predicting an epidemic dissemination.
Data Availability Statement
Publicly available datasets were analyzed in this study. This data can be found at: https://data.world/kim4597/world-covid19/workspace/intro.
Author Contributions
VT, ND, and NB designed the study. VT and NB developed the mathematical model and simulation coding. ND contributed in manuscript writing and data interpretation. All authors contributed to the article and approved the submitted version.
Conflict of Interest
The authors declare that the research was conducted in the absence of any commercial or financial relationships that could be construed as a potential conflict of interest.
References
1. World Health Organization (WHO). Corona Virus Disease (COVID-19) Outbreak Situation. World Health Organization (2020). Available online at: https://www.who.int/emergencies/diseases/novel-coronavirus-2019
2. Zou L, Ruan F, Huang M, Liang L, Huang H, Hong Z, et al. SARS-cov-2 viral load in upper respiratory specimens of infected patients. N Engl J Med. (2020) 382:1177–9. doi: 10.1056/NEJMc2001737
3. WHO. COVID-19-Global-Data. WHO (2020). Available online at: https://covid19.who.int/info (accessed July 13, 2020).
4. Data. World-COVID-19-Data. (2020). Available online at: https://data.world/kim4597/world-covid19/workspace/intro (accessed July 14, 2020).
5. Covid-19 Vaccine Trial on Humans Starts as UK Warns. (2020). Available online at: https://edition.cnn.com/2020/04/23/health/coronavirus-vaccine-trial-uk-gbr-intl/index.html
6. Ferguson N M, Laydon D, Nedjati-Gilani Imai G, Ainslie K, Baguelin K, Bhatia S, et al. Impact of nonpharmaceutical interventions (NPIs) to reduce COVID-19 mortality and healthcare demand. Bull Math Biol. (2020) 82:52. doi: 10.1007/s11538-020-00726-x
7. Stringent and Stingy. Emerging-Market Lockdowns Match Rich-World Ones. The Handouts Do Not (2020). Available online at: https://www.lastminutestuff.com/content/Emergingmarket-lockdowns-match-richworld-ones/6241717.html (accessed July 15, 2020).
8. Indian Railways Ready to Modify 20000 Coaches Which…” -PIB. (2020). Available online at: https://pib.gov.in/PressReleasePage.aspx?PRID=1609528 (accessed July 15, 2020).
9. Government of India (2020). Available online at: https://pib.gov.in/PressReleseDetail.aspx?PRID=1613216 (accessed July 16, 2020).
10. COVID-19 Data Trend. (2020). Available online at: https://www.covid19india.org (accessed July 16, 2020).
11. Anderson RM. The role of mathematical models in the study of HIV transmission and the epidemiology of AIDS. J Acquir Immune Defic Syndr. (1988) 1:241–56.
12. Didelot X, Whittles LK, Hall I. Model-based analysis of an outbreak of bubonicplague in Cairo in 180. J R Soc Interface. (2017) 14:20170160. doi: 10.1098/rsif.2017.0160
13. Cai QC, Jiang QW, Xu QF, Cheng X, Guo Q, Sun QW, et al. To develop a model on severe acute respiratory syndrome epidemic to quantitatively evaluate the effectiveness of intervention measures. Chin J Epidemiol. (2005) 26:153–8.
14. Moustakas A, Evans M, Daliakopoulos I, Yannis Markonis Y. Abrupt events and population synchrony in the dynamics of Bovine Tuberculosis. Nat Commun. (2018) 9:2821. doi: 10.1038/s41467-018-04915-0
15. Calvetti D, Hoover AP, Rose J, Somersalo E. Metapopulation network models for understanding, predicting, and managing the coronavirus disease COVID-19. Front Phys. (2020) 8:261. doi: 10.3389/fphy.2020.00261
16. Mauger A, Barchitta M, Battiato S, Agodi A. Estimation of unreported novel coronavirus (SARS-CoV-2) infections from reported deaths: a susceptible–exposed–infectious–recovered–dead model. JCM. (2020) 9:1350. doi: 10.3390/jcm9051350
17. Saberi M, Hamedmoghadam H, Madani K, Dolk HM, Morgan AS, Morris JK, et al. Accounting for underreporting in mathematical modeling of transmission and control of COVID-19 in Iran. Front Phys. (2020) 8:289. doi: 10.3389/fphy.2020.00289
18. Chen Z, Yang J, Dai B. Forecast possible risk for COVID-19 epidemic dissemination under current control strategies in Japan. Int J Environ Res Public Health. (2020) 17:3872. doi: 10.3390/ijerph17113872
19. Fang Y, Nie Y, Penny M. Transmission dynamics of the COVID-19 outbreak and effectiveness of government interventions: a data-driven analysis. J Med Virol. (2020) 92:645–59. doi: 10.1002/jmv.25750
20. Chatterjee S, Sarkar S, Chatterjee S, Karmakar K, Paul R. Studying the progress of COVID-19 outbreak in India using SIRD model. Indian J Phys Soc Indian Assoc Cultiv Sci. (2020) 1–17. doi: 10.1007/s12648-020-01766-8
21. Pandey G, Chaudhary P, Gupta R, Pal S. SEIR and regression model based covid-19 outbreak predictions in India. arXiv. (2020). doi: 10.2196/preprints.19406
22. Dhanwant J, Ramanathan V. Forecasting Covid 19 growth in India using susceptible-infected-recovered (sir) model. arXiv. (2020). arXiv:2004.00696.
23. Kashyap V, Malhotra B. Progression of COVID-19 in Indian States - forecasting endpoints using sir and logistic growth models. medRxiv. (2020). doi: 10.1101/2020.05.15.20103028
24. Gupta S, Shankar R. Estimating the number of COVID-19 infections in Indian hot-spots using fatality data. arXiv. (2020). arXiv:2004.04025.
25. Sardar T, Nadim S, Chattopadhyay J. Assessment of 21 days lockdown effect in some states and overall India: a predictive mathematical study on covid-19 outbreak. arXiv. (2020) 139:1–10. doi: 10.1016/j.chaos.2020.110078
26. Singh R, Adhikari R. Age-structured impact of social distancing on the COVID-19 epidemic in India. arXiv. (2020). Available online at: https://arxiv.org/abs/2003.12055
27. Kaur T, Sarkar S, Chowdhury S, Sinha S, Jolly M, Dutta P. Anticipating the novel coronavirus disease (COVID-19) pandemic. medRxiv. (2020). doi: 10.1101/2020.04.08.20057430
28. Pai C, Bhaskar A, Rawoot V. Investigating the dynamics of COVID-19 pandemic in India under lockdown. Chaos Solitons Fract. (2020) 138:109988. doi: 10.1016/j.chaos.2020.109988
29. Bhandari S, Tak A, Gupta J, Patel B, Shukla J, Shaktawat AS, et al. Evolving trajectories of COVID-19 curves in India: prediction using autoregressive integrated moving average modelling. Res Square. (2020). doi: 10.21203/rs.3.rs-40385/v1
30. Samui P, Mondal J, Khajanchi S. A mathematical model for COVID-19 transmission dynamics with a case study of India. Chaos Solitons Fract. (2020) 140:110173. doi: 10.1016/j.chaos.2020.110173
31. Khajanchi S, Sarkar K. Forecasting the daily and cumulative number of cases for the COVID-19 pandemic in India. Chaos. (2020) 30:071101. doi: 10.1063/5.0016240
32. Sarkar K, Khajanchi S, Nieto J. Modeling and forecasting the COVID-19 pandemic in India. Chaos Solitons Fract. (2020) 139:110049. doi: 10.1016/j.chaos.2020.110049
33. Khajanchi S, Sarkar K, Mondal J, Perc M. Dynamics of the COVID-19 pandemic in India. arXiv. (2020). doi: 10.21203/rs.3.rs-27112/v1
Keywords: epidemic peak, SEIRD model, COVID-19, lockdown, India, under reporting
Citation: Tiwari V, Deyal N and Bisht NS (2020) Mathematical Modeling Based Study and Prediction of COVID-19 Epidemic Dissemination Under the Impact of Lockdown in India. Front. Phys. 8:586899. doi: 10.3389/fphy.2020.586899
Received: 24 July 2020; Accepted: 07 September 2020;
Published: 12 November 2020.
Edited by:
Aristides Moustakas, University of Crete, GreeceReviewed by:
Ankush Bhaskar, National Aeronautics and Space Administration, United StatesSubhas Khajanchi, Presidency University, India
Copyright © 2020 Tiwari, Deyal and Bisht. This is an open-access article distributed under the terms of the Creative Commons Attribution License (CC BY). The use, distribution or reproduction in other forums is permitted, provided the original author(s) and the copyright owner(s) are credited and that the original publication in this journal is cited, in accordance with accepted academic practice. No use, distribution or reproduction is permitted which does not comply with these terms.
*Correspondence: Nandan S. Bisht, YmlzaHQubmFuZGFuQGt1bmFpbml0YWwuYWMuaW4=; Vipin Tiwari, dmlwaW50OTJAZ21haWwuY29t