 Yun Wang
 Shengyao Jia
 Jianyuan Qin
- Center for Terahertz Research, China Jiliang University, Hangzhou, China
Fano resonances in metamaterial are important due to their low-loss subradiant behavior that allows excitation of high quality (Q) factor resonances extending from the microwave to the optical bands. Fano resonances have recently showed their great potential in the areas of modulation, filtering, and sensing for their extremely narrow linewidths. However, the Fano resonances in a metamaterial system arise from the interaction of all that form the structure, limiting the tunability of the resonances. Besides, sensing trace analytes using Fano resonances are still challenging. In the present work, we demonstrate the excitation of Fano resonances in metamaterial consisting of a period array of two concentric double-split-ring resonators with symmetry breaking (position asymmetry and gaps asymmetry). The tunability and sensing of Fano resonances are both studied in detail. Introducing position asymmetry in the metamaterial leads to one Fano resonance located at 0.50 THz, while introducing gaps asymmetry results in two Fano resonances located at 0.35 THz and 0.50 THz. The transmittance, position, and linewidth of the three Fano resonances can be easily tuned by varying the asymmetry deviations. The Q factor and figure of merit (FoM) of Fano resonances with different asymmetry deviations are calculated for performance optimization. The Fano resonances having the highest FoM are used for the sensing of analytes at different refractive indices, and the Fano resonance performing the best in refractive index sensing is further applied to detect the analyte thickness. The results demonstrate that the tunable Fano resonances show tremendous potential in sensing applications, offering an approach to engineering highly efficient modulators and sensors.
Introduction
Terahertz (THz) waves ranging from 0.1 to 10 THz show huge potential for application in communication [1], imaging [2, 3], biomedicine [4–8], and chemistry [9–12]. The great prospects of THz technology inevitably stimulate further research on the cost-effective devices to manipulate the emission, propagation, modulation, and sensing of THz waves. Metamaterial (MM) devices comprising artificially designed structures have been widely applied in THz technology, which has greatly changed conventional approaches for manipulating THz waves. MM structures possess unique electromagnetic properties that are different from natural materials; such extraordinary features provide them the ability to effectively control the THz waves. The electromagnetic properties of MM depend on the layout, orientation, and geometry of subwavelength resonators in each unit cell, as well as the coupling between the unit cells. These findings have facilitated exquisite research and acquired exciting advancements such as superlenses [13], communication [14], absorbers [15–18], cloaks [19], and sensors [20–25] in the field of THz waves. Split-ring resonator (SRR) array on a high transmittance substrate is the most popular MM structure in the aforementioned application area. SRR-based MM can exhibit inductive-capacitive resonance as the polarization of the incident THz waves is parallel to the gap of SRR. However, the dipole resonance can be excited when the polarization of incident THz waves is perpendicular to the gap of SRR. Both resonances have a relatively broad linewidth as well as a quality (Q) factor below 10 [26]. The low Q factor of these resonances is due to the radiative and nonradiative loss mechanisms in the MM [27]. At THz frequencies, the Drude metals, such as gold, copper, and aluminum, have extremely high conductivity that eliminates most of the nonradiative losses [28]. Thus, the radiative losses play a dominant role in the THz MM structure. It has been found that the dominant radiative losses can be controlled by optimizing the geometry of the metallic subwavelength structure to excite sharp asymmetric resonance with high Q factor. Such resonance is termed as Fano resonance and exhibits a very high Q factor even up to 75 [29]. Fano resonance arises from the plasmonic hybridization between narrow discrete resonance (dark mode) and a broad spectral line or continuum (bright mode). It is found that Fano resonance shows asymmetric and sharp spectral lines with narrow linewidth and has strongly confined electromagnetic fields. Because of these excellent features, Fano resonances have great potential to be applied to the design of THz high Q devices. An ultrahigh Q factor of 227 could be observed for the lowest asymmetry case in an asymmetric SRR-based MM structure [30]. However, the resonance intensity in this structure was extremely weak, and thus, the figure of merit (FoM) is lower than 47. For practical applications, a sharp resonance feature as well as strong resonance intensity is typically desired. Therefore, a SRR-based MM with Fano resonance having both ultrahigh Q factor and high FoM has been proposed [31]. The Q factor up to 394.5 and a high FoM up to 371.9 under the normal incidence of linear polarized light could be achieved by the displacement asymmetry. Among the emergent functionalities, the tunability of Fano resonance in a MM structure plays a crucial role in controlling the resonance characteristics including the position and the intensity of the resonance. Nonetheless, the accurate control of Fano resonances in coupling resonators is still difficult to achieve, which greatly hinders the development of Fano resonance-based MM devices for diverse THz applications.
Numerous molecular vibrations including molecular rotations, low frequency bond vibrations, and crystalline phonon vibrations are all present in THz region, enabling the identification and detection of molecules using THz technology. Besides, due to the advantages of low energy and high penetration, the performance of THz waves is excellent in nondestructive testing. Recently, THz technology has showed great potential in the fields of biomedicine and chemistry. However, the sensing of analytes with high sensitivity is still challenging. The strong electric field of Fano resonances can greatly enhance the interaction between the light and matters, which leads to high sensitivity in sensing applications. Therefore, Fano resonance-based MM has been used in THz technology for improving the detection sensitivity. The low-loss Fano resonances with ultra-sharp feature enable measuring the minute spectral shift due to the small change in the refractive index of the surrounding media. A simulated sensitivity level of 5.7 × 10⁴ nm/RIU was achieved, and the sensitivity could be further enhanced by using thinner substrates [32]. The combination of Fano resonance and microfluidic chip could realize the detection of trace liquid samples with a concentration of 1.4 fmol in a volume of 128 pL. Compared with the symmetric structure, the sensitivity of the asymmetric structure based on Fano resonance was increased by an order of magnitude [33]. In these studies, it is noted that MM working at THz frequencies could be easily fabricated by using the photolithograph process, which is of low cost and low requirement for accuracy compared with the fabrication of the MM working at other frequencies. Therefore, the research on the THz sensing using Fano resonance-based MM will provide an effective approach for highly sensitive sensing and promote the application and development of THz technology. In our present study, the tunability and application of the Fano resonances in MM structure arising due to the symmetric breaking are demonstrated. Different from the previous reports [32, 34, 35], our MM structure comprises a period array of two concentric SRRs. Introducing position asymmetry and gaps asymmetry can change the coupling between the two concentric SRRs and lead to the excitation of three Fano resonances (multiple Fano resonance). These resonances can be tuned by varying the asymmetry deviation. The Q factor and FoM are calculated to estimate the performances of the asymmetric MM structures at different asymmetry deviations. The best-performing Fano resonances with the highest FoM are used for sensing application by coating an analyte layer on the surface of MM structure. The sensitivities of Fano resonances are studied to evaluate the ability of these resonances in the detection of refractive index. The sensing of analyte with different thicknesses is also investigated to demonstrate the capability of Fano resonance for thickness sensing.
Structure Design
Figure 1A shows the schematic of the MM structure being excited by normally incident THz wave. The coordinates of electric field (E), magnetic field (H), and wave vector (k) of incident THz wave are also indicated. The MM structure consists of a periodic array of two copper concentric SRRs, the inner SRR and the outer SRR, on a high-resistivity silicon substrate. Figure 1B shows the unit cell of the MM-1 structure on the xy plane, which is symmetric along x-axis and y-axis. Structural symmetry of the unit cell was broken forming asymmetric MM to study the coupling between these two concentric SRRs. For MM-2, see Figure 1C; the position of inner SRR is off the center, and it moves rightwards by d = 2.4 μm along x-axis to form a position asymmetric MM structure. Meanwhile, for MM-3, the lower gaps of the two SRRs deviate from y-axis, and they both move rightwards by s = 6 μm along x-axis, creating a gap asymmetric MM structure. All three structures have the same dimension parameters: l1 = 84 μm, l2 = 60 μm, w = 6 μm, g = 3 μm, Px = Py = 100 μm, the copper thickness t1 = 0.2 μm, and the silicon substrate thickness t2 = 500 μm. The simulations were carried out using the commercially available CST Microwave Studio. The frequency domain solver was adopted with the periodic boundary conditions in the x direction and y direction, while the z direction was open to free space. The THz wave with an electric field linearly polarized along x-axis was vertically incident on the surface of MM structure. The conductivity of copper was set to σdc = 5.76 × 10⁷ S/m, and the permittivity of silicon was ε = 11.9.
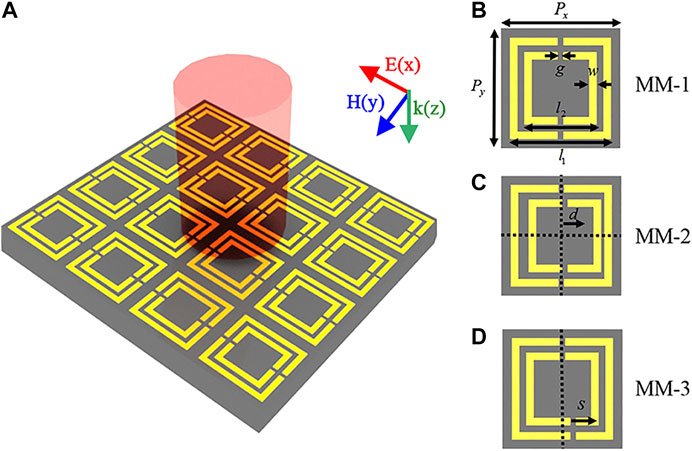
FIGURE 1. (A) Three-dimensional schematic of the MM structure being excited by a normally incident THz pulse. Two-dimensional schematic of unit cell for (B) symmetric MM structure (MM-1), (C) position asymmetric MM structure (MM-2), and (D) gaps asymmetric MM structure (MM-3) with all dimensions at a micron scale. In (C), the position of inner SRR moves rightwards by d along x-axis. In (D), the lower gaps of two SRRs move rightwards by s along x-axis. All three structures have the same dimension parameters: l1 = 84 μm, l2 = 60 μm, g = 3 μm, w = 6 μm, and Px = Py = 100 μm. The thicknesses of metallic layer and substrate layer are 0.2 and 40 μm, respectively.
The tuning of the Fano resonances in MM structure arising from the symmetric breaking was investigated by varying the position asymmetric deviation d and gap asymmetric deviation s. The transmittance spectra and the electromagnetic field distribution at resonances for different asymmetric deviations were simulated to analyze the coupling between the concentric SRRs within the unit cell. The Q factor and the FoM were also calculated. In order to confirm the sensing ability of the tunable Fano resonances, the detection of refractive index, as well as the sensing of analyte thickness, was investigated, and the sensitivities were calculated to evaluate the sensing performance.
Results and Discussions
The transmittance spectra of MM-1, MM-2, and MM-3 are shown in Figure 2A. MM-1 has two obvious transmission dips located at 0.40 THz and 0.68 THz (black line). For the dip at 0.40 THz, it can be seen from Figure 2B that the surface currents are mainly distributed in the left arm and right arm of the outer SRR, and they run parallel in these two arms. The electric field is mainly located in the upper and lower components of the outer SRR in this case. As for 0.68 THz, see Figure 2C, the parallel surface currents are mainly located in the left arm and right arm of the inner SRR. In this case, the electric field is concentrated in the upper and lower components of the inner SRR. Therefore, these two resonances are classified as dipole resonance and labeled as DD1 and DD2. After introducing the position asymmetry (d = 2.4 μm), one more transmission dip at 0.50 THz appears for MM-2 besides DD1 and DD2 (red line). As shown in Figure 2D, for 0.50 THz, the coupling of two SRRs leads to the concentration of electric field in the two gaps of the inner SRR, and the surface currents in the two SRRs are antiparallel, indicating that this resonance is attributed to the Fano mode. Thus, the resonance of 0.50 THz in MM-2 is termed as Fano resonance and marked as FD1. By introducing the gap asymmetry (s = 6 μm), there are two more transmission dips at 0.35 THz and 0.50 THz for MM-3 (blue line). Figure 2E shows that the electric field is concentrated in the gaps of the outer SRR at the resonance of 0.35 THz. The antiparallel surface currents in this case are mainly distributed in the left arm and right arm of the outer SRR, and the currents in the left arm are much stronger than those in the right arm. For the dip of 0.5 THz, similar to FD1, the coupling of the two SRRs causes antiparallel surface currents in the two SRRs with stronger currents distributed in their left arms and results in strong electric field located in the gaps of the inner SRR; see Figure 2F. The distributions of surface currents and electric field indicate that the excitations of dips in MM-3 at 0.35 THz and 0.50 THz origin from the Fano modes. Therefore, they are termed as Fano resonances and marked as FD2 and FD3. Note that DD1 and DD2 appear in all three structures, and their resonant frequencies remain almost unchanged.
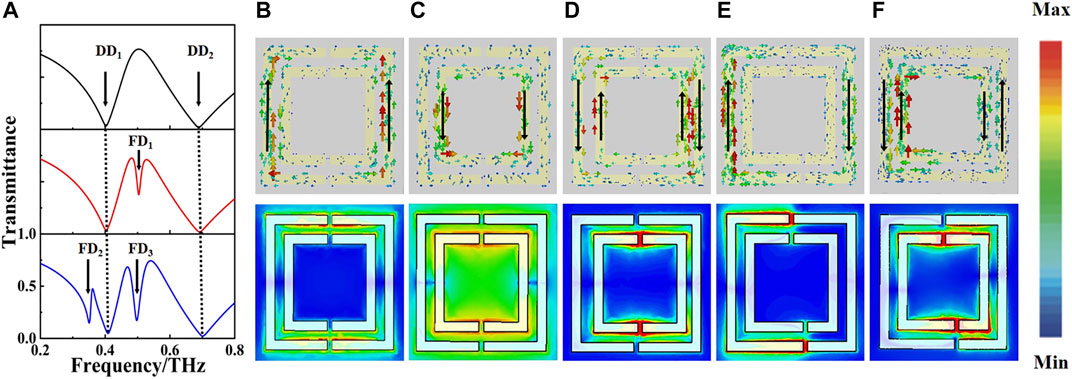
FIGURE 2. (A) Transmittance spectra of MM-1 (black line), MM-2 (red line), and MM-3 (blue line). Surface current (top) and electric field distribution (bottom) at (B) DD1 of MM-1, (C) DD2 of MM-1, (D) FD1 of MM-2, (E) FD2 of MM-3, and (F) FD3 of MM-3 on the xy plane.
These Fano resonances (FD1, FD2, and FD3) arise due to the symmetry breaking, and they can be tuned by varying the asymmetric deviation. To study the dependence of tunable resonances on the asymmetric deviation, a fine simulation for THz transmittance of MM-2 as a function of frequency and asymmetric deviation d and of MM-3 as a function of frequency and asymmetric deviation s was performed, and the results are displayed in Figure 3. The asymmetric deviation d increases from 0.6 to 3 μm with a simulated step of 0.25 μm, while the asymmetric deviation s increases from 3 to 22.5 μm with a simulated step of 0.50 μm. It is found that as the asymmetric deviation d increases gradually, FD1 of MM-2 arises, and its resonance position remains almost unchanged, as shown in Figure 3A. However, the transmittance of FD1 slightly decreases, and its linewidth is becoming wider with d increasing. For MM-3, FD2 and FD3 appear with decreasing transmittance when the asymmetric deviation s increases, see Figure 3B. Continuing to increasing s, FD2 shows a slight red-shift. In this case, however, the position of FD3 is almost fixed at 0.5 THz, and its linewidth is getting wider. These results demonstrate that the resonance characteristics of these resonances, including the transmittance, position, and linewidth, can be tuned by changing the asymmetric deviations; such tunability has potential applications in the design of filters, modulators, switches, and sensors devices.
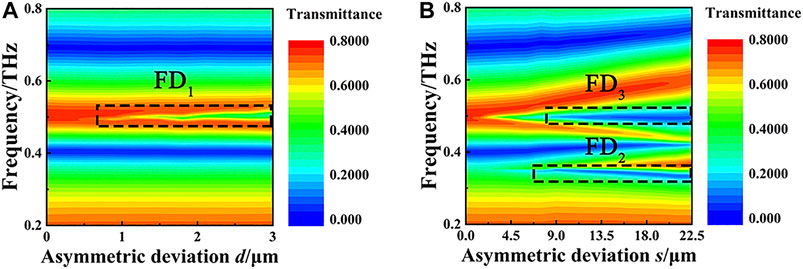
FIGURE 3. Two-dimensional diagram of transmittance as a function of frequency and asymmetric deviation for (A) FD1 of MM-2 and (B) FD2 and FD3 of MM-3.
Next, the performances of the two asymmetric MM structures (MM-2 and MM-3) vs. the asymmetric deviations d and s are evaluated in terms of Q factor and FoM. Here, the Q factor is defined as Q = f0/FWHM, where f0 is the frequency of the resonance and FWHM is the full width at half maximum. The FoM is defined as FoM = Q × ΔI, where ΔI is the resonance intensity [28]. Figure 4 depicts the responses of Q factor and FoM when the asymmetric deviation changes. The black spheres and red spheres depict the Q factor and FoM at different asymmetric deviations, respectively. It can be seen from Figure 4A that the Q factor of FD1 is 93 when the asymmetric deviation d is 0.6 μm. Then, it decreases as the asymmetric deviation d increases. In this case, the FoM increases with the increase of the asymmetric deviation d and reaches the saturated value of 13 when d = 1.8 μm. As for FD2, see Figure 4B; the change in Q factor is similar to that of FD1. When s = 3 μm, the maximum of Q factor is about 78, and then it keeps decreasing as the asymmetric deviation s increases, while the FoM grows rapidly to a maximum of 6 at s = 9 μm and decreases slowly after that. For FD3, the Q factor and FoM both show similar curve shapes to those of FD2, as shown in Figure 4C. The Q factor has a maximum of 82 at s = 3 μm, and the FoM peaks its maximum of 15 at about s = 6 μm. The higher the FoM is, the better the resonance performs. Therefore, the best performances of FD1, FD2, and FD3 are at the asymmetric deviation of 2.4, 9, and 6 μm, respectively.
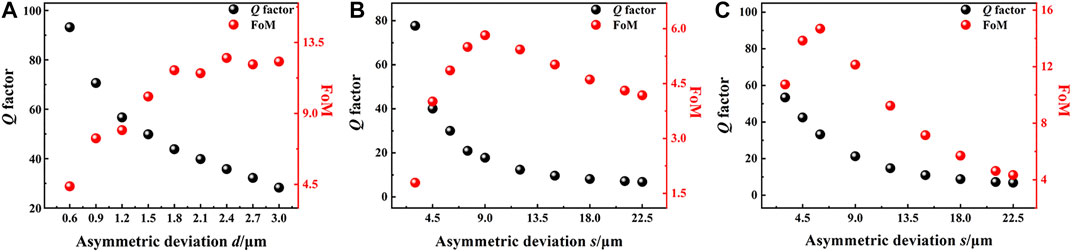
FIGURE 4. Q factor (black spheres) and FoM (red spheres) vs. asymmetric parameter for (A) FD1 in MM-2, (B) FD2 in MM-3, and (C) FD3 in MM-3.
In sensing applications, a sharp resonance feature and strong resonance intensity are both typically desired to detect a minute frequency shift that arises due to the small change in analyte. As mentioned earlier, the FoM that describes the Q factor and the resonance intensity peaks at d = 2.4 μm for FD1, s = 9 μm for FD2, and s = 6 μm for FD3, and these asymmetric deviations are chosen for asymmetric MM structures to investigate the sensing performances of these tunable resonances. Figure 5 shows the transmittance at around FD1, FD2, and FD3 for the asymmetric MM structures coated with different refractive index (n) of analyte. The thickness of analyte is fixed at 4 μm. It is found that all three dips show a red-shift and slight increasing transmittance as the refractive index of analyte increases. When the refractive index increases from 1.0 to 1.2, FD1 shifts with a value of 6.87 GHz. In this case, the frequency shifts for FD2 and FD3 are 3.86 and 7.03 GHz, respectively. With a further increase in the refractive index to 2.0, FD1, FD2, and FD3 have a frequency shift of 34.3, 27.9, and 38.4 GHz, respectively. For a more clear display of the relationship between the frequency shift and the refractive index, the frequency shifts vs. refractive index for the all three resonances and the corresponding linear fittings (dashed lines) are plotted in Figure 6A. The linear fitting of FD3 has the biggest slope, followed by FD1, while FD2 has the smallest slope. The sensitivity is applied to evaluate the sensing performances of these resonances. Here, the sensitivity is defined as S = Δf/Δn, where Δf is the frequency shift and Δn is the change in refractive index of analyte. In this way, the sensitivities of FD1, FD2, and FD3 are calculated to be 34.3 GHz/RIU, 27.9 GHz/RIU, and 38.4 GHz/RIU, respectively. Thus, FD3 performs the best in the sensing of refractive index. The difference in sensitivity of the three resonances can be attributed to the difference in electric field intensity located at the gaps [36]. Stronger electric field will provide a stronger interaction between the electromagnetic wave and the analyte, which results in higher sensitivity [37]. Further study of the thickness sensing using FD3 was also conducted, and the results are shown in Figure 6B. The refractive index of analyte is 1.6, while the analyte thickness is changed from 0 μm (without analyte) to 16 μm. The results show that the frequency shift of FD3 sharply increases when the analyte thickness increases from 0 to 5 μm, and it increases slowly as the analyte thickness varies from 5 to 12.5 μm. When the thickness of the analyte is 12.5 μm, the frequency shift reaches a saturated value of 16 GHz. These results show that the proposed structure is more suitable for sensing the thickness of thin layer analyte.
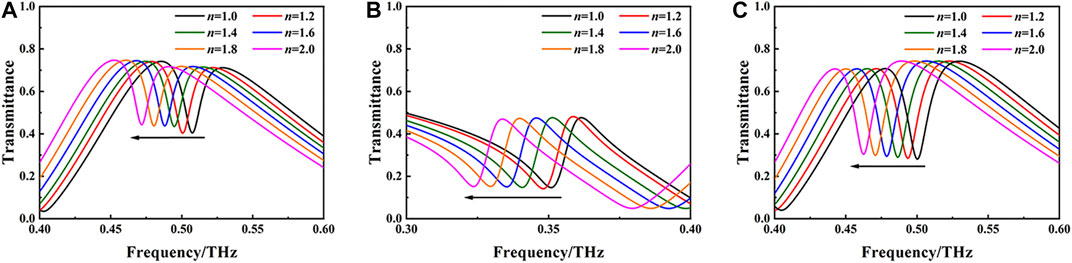
FIGURE 5. Transmittance in the vicinity of (A) FD1, (B) FD2, and (C) FD3 for the asymmetric MM structures coated with a different refractive index of analyte. The thickness of analyte is set to 4 μm, the asymmetric deviation d for FD1 is 2.4 μm, and the asymmetric deviations s for FD2 and FD3 are 9 and 6 μm, respectively.
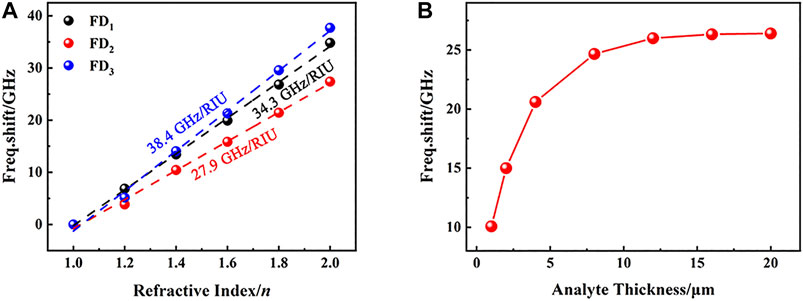
FIGURE 6. (A) Frequency shift of FD1 (black spheres), FD2 (red spheres), and FD3 (blue spheres) vs. refractive index. (B) Frequency shift of FD3 vs. analyte thickness.
Conclusion
In summary, we have demonstrated that Fano resonances can be excited by introducing asymmetry (position asymmetry and gaps asymmetry) in the MM formed by a period array of two concentric SRRs. One Fano resonance (FD1) appears when the inner SRR is off the center, and two resonances (FD2 and FD3) can be observed as the lower gaps of the two SRRs deviate from the y-axis. These phenomena are attributed to the coupling and the interaction between the two concentric SRRs. Variations in the asymmetric deviations can modulate the Fano resonances. The FoMs for FD1, FD2, and FD3 can reach 13, 6, and 15, respectively. The sensitivities of FD1, FD2, and FD3 used for refractive index sensing are 34.3 GHz/RIU, 27.9 GHz/RIU, and 38.4 GHz/RIU, respectively. The sensing of analyte thickness using FD3 shows that the frequency shift greatly increases when the analyte thickness increases from 0 to 5 μm and then slowly increases and reaches a saturated value at 12.5 μm, demonstrating that it is better suited to detect the thickness of thin layer analyte. The proposed asymmetric MM structures with tunable Fano resonances show potential applications as modulators, attenuators, filters, and sensors and can be readily applied in the THz band.
Data Availability Statement
The original contributions presented in the study are included in the article/Supplementary Material, and further inquiries can be directed to the corresponding author.
Author Contributions
JQ conceived the idea and wrote part of the manuscript. YW performed the numerical simulations and analyzed the results. SJ prepared the figures and wrote part of the manuscript. All authors have given approval to the final version of the manuscript.
Conflict of Interest
The authors declare that the research was conducted in the absence of any commercial or financial relationships that could be construed as a potential conflict of interest.
Acknowledgments
The authors acknowledge the financial support from the National Natural Science Foundation of China (No. 61705213).
References
1. Zhang R, Yang K, Abbasi QH, Qaraqe KA, Alomainy A. Analytical modelling of the effect of noise on the terahertz in-vivo communication channel for body-centric nano-networks. Nano Commun Netw (2018) 15:59–68. doi:10.1016/j.nancom.2017.04.001
2. Augustin S, Frohmann S, Jung P, Hubers HW. Mask responses for single-pixel terahertz imaging. Sci Rep (2018) 8:1–17. doi:10.1038/s41598-018-23313-6
3. Jokubauskis D, Minkevicius L, Karaliunas M, Indrisiunas S, Kasalynas I, Raciukaitis G, et al. Fibonacci terahertz imaging by silicon diffractive optics. Opt Lett (2018) 43:2795–8. doi:10.1364/OL.43.002795
4. Gong A, Qiu Y, Chen X, Zhao Z, Xia L, Shao Y. Biomedical applications of terahertz technology. Appl Spectrosc Rev (2020) 55:418–38. doi:10.1080/05704928.2019.1670202
5. Yang X, Yang K, Zhao X, Lin Z, Liu Z, Luo S, et al. Terahertz spectroscopy for the isothermal detection of bacterial DNA by magnetic bead-based rolling circle amplification. Analyst (2017) 142:4661–9. doi:10.1039/c7an01438d
6. Chen T, Zhang Q, Li Z, Hu F. Intermolecular weak interactions of crystalline purine and uric acid investigated by terahertz spectroscopy and theoretical calculation. J Lumin (2020) 223:174–81. doi:10.1016/j.jlumin.2020.117198
7. Mernea M, Ulareanu R, Calboreanu O, Chiritoiu G, Cucu D, Mihailescu DF. N-glycosylation state of TRPM8 protein revealed by terahertz spectroscopy and molecular modelling. Biochim Biophys Acta-Gen Subj (2020) 32:1864. doi:10.1016/j.bbagen.2020.129580
8. Wu X, Wang L, Peng Y, Wu F, Cao J, Chen X, et al. Quantitative analysis of direct oral anticoagulant rivaroxaban by terahertz spectroscopy. Analyst (2020) 145:3909–15. doi:10.1039/d0an00268b
9. Zhou Q, Shen Y, Li Y, Xu L, Cai Y, Deng X. Terahertz spectroscopic characterizations and DFT calculations of carbamazepine cocrystals with nicotinamide, saccharin and fumaric acid. Spectroc Acta Pt A-Molec Biomolec Spectr (2020) 105:236. doi:10.1016/j.saa.2020.118346
10. Ornik J, Knoth D, Koch M, Keck CM. Terahertz-spectroscopy for non-destructive determination of crystallinity of L-tartaric acid in smartFilms (R) and tablets made from paper. Int. J Pharm (2020) 45:581. doi:10.1016/j.ijpharm.2020.119253
11. Chen L, Ren G, Liu L, Guo P, Wang E, Zhu Z, et al. Probing NaCl hydrate formation from aqueous solutions by terahertz time-domain spectroscopy. Phys Chem Chem Phys (2020) 22(32):17791–17797. doi:10.1039/d0cp01571g
12. Wang Y, Wang Q, Zhao Z, Liu A, Tian Y, Qin J. Rapid qualitative and quantitative analysis of chlortetracycline hydrochloride and tetracycline hydrochloride in environmental samples based on terahertz frequency-domain spectroscopy. Talanta (2018) 190:284–91. doi:10.1016/j.talanta.2018.08.008
13. Haxha S, AbdelMalek F, Ouerghi F, Charlton MDB, Aggoun A, Fang X. Metamaterial superlenses operating at visible wavelength for imaging applications. Sci Rep (2018) 8:10. doi:10.1038/s41598-018-33572-y
14. Vendik IB, Vendik OG. Metamaterials and their application in microwaves: a review. Tech Phys (2013) 58:1–24. doi:10.1134/S1063784213010234
15. Watts CM, Liu X, Padilla WJ. Metamaterial electromagnetic wave absorbers. Adv Mater (2012) 24:OP98–OP120. doi:10.1002/adma.201200674
16. Tao H, Bingham CM, Strikwerda AC, Pilon D, Shrekenhamer D, Landy NI, et al. Highly flexible wide angle of incidence terahertz metamaterial absorber: design, fabrication, and characterization. Phys Rev B (2008) 15:78. doi:10.1103/PhysRevB.78.241103
17. He Z, Wu L, Liu Y, Lu Y, Wang F, Shao W, et al. Ultrawide bandwidth and large-angle electromagnetic wave absorption based on triple-nested helix metamaterial absorbers. J Appl Phys (2020) 28:127. doi:10.1063/5.0001885
18. Zhong M, Jiang X, Zhu X, Zhang J, Zhong J. Design and preparation of a single-band tunable metamaterial absorber in terahertz frequency. Phys Scripta (2020) 125:95. doi:10.1088/1402-4896/ab7681
19. Islam SS, Faruque MRI, Islam MT. An object-independent ENZ metamaterial-based wideband electromagnetic cloak. Sci Rep (2016) 159:6. doi:10.1038/srep33624
20. Cheng R, Xu L, Yu X, Zou L, Shen Y, Deng X. High-sensitivity biosensor for identification of protein based on terahertz Fano resonance metasurfaces. Optic Commun (2020) 56:473. doi:10.1016/j.optcom.2020.125850
21. Chen T, Li SY, Sun H. Metamaterials application in sensing. Sensors (2012) 12:2742–65. doi:10.3390/s120302742
22. Tao H, Kadlec EA, Strikwerda AC, Fan K, Padilla WJ, Averitt RD, et al. Microwave and Terahertz wave sensing with metamaterials. Optic Express (2011) 19:21620–6. doi:10.1364/OE.19.021620
23. Withayachumnankul W, Lin H, Serita K, Shah CM, Sriram S, Bhaskaran M, et al. Sub-diffraction thin-film sensing with planar terahertz metamaterials. Optic Express (2012) 20:3345–52. doi:10.1364/OE.20.003345
24. Wang W, Yan F, Tan S, Zhou H, Hou Y. Ultrasensitive terahertz metamaterial sensor based on vertical split ring resonators. Photon Res (2017) 5:571–7. doi:10.1364/PRJ.5.000571
25. Zhang C, Liang L, Ding L, Jin B, Hou Y, Li C, et al. Label-free measurements on cell apoptosis using a terahertz metamaterial-based biosensor. Appl Phys Lett (2016) 28:108. doi:10.1063/1.4954015
26. Zheng X, Zhao Z, Peng W, Zhao H, Zhang J, Luo Z, et al. Suppression of terahertz dipole oscillation in split-ring resonators deformed from square to triangle. Appl Phys Mater Sci Process (2017) 56:123. doi:10.1007/s00339-017-0904-7
27. Gupta M, Singh R. Toroidal versus Fano resonances in high Q planar THz metamaterials. Adv Opt Mater (2016) 4(12):2119–25. doi:10.1002/adom.201600553
28. Cong L, Manjappa M, Xu N, Al-Naib I, Zhang W, Singh R. Fano resonances in terahertz metasurfaces: a figure of merit optimization. Adv Opt Mater (2015) 3(11):1537–43. doi:10.1002/adom.201500207
29. Srivastava YK, Singh R. Impact of conductivity on Lorentzian and Fano resonant high-Q THz metamaterials: superconductor, metal and perfect electric conductor. J Appl Phys (2017) 64:122. doi:10.1063/1.4994951
30. Cao W, Singh R, Al-Naib IAI, He M, Taylor AJ, Zhang W. Low-loss ultra-high-Q dark mode plasmonic Fano metamaterials. Opt Lett (2012) 37:3366–8. doi:10.1364/OL.37.003366
31. Wang B, Xie Z, Feng S, Zhang B, Zhang Y. Ultrahigh Q-factor and figure of merit Fano metamaterial based on dark ring magnetic mode. Optic Commun (2015) 335:60–4. doi:10.1016/j.optcom.2014.08.062
32. Singh R, Cao W, Al-Naib I, Cong L, Withayachumnankul W, Zhang W. Ultrasensitive terahertz sensing with high-Q Fano resonances in metasurfaces. Appl Phys Lett (2014) 73:105. doi:10.1063/1.4895595
33. Serita K, Murakami H, Kawayama I, Tonouchi M. A terahertz-microfluidic chip with a few arrays of asymmetric meta-atoms for the ultra-trace sensing of solutions. Photonics (2019) 56:6. doi:10.3390/photonics6010012
34. Park H-R, Chen X, Ngoc-Cuong N, Peraire J, Oh S-H. Nanogap-enhanced terahertz sensing of 1 nm thick (lambda/10(6)) dielectric films. ACS Photon (2015) 2(3):150204164400005. doi:10.1021/ph500464j
35. Srivastava YK, Ako RT, Gupta M, Bhaskaran M, Sriram S, Singh R. Terahertz sensing of 7 nm dielectric film with bound states in the continuum metasurfaces. Appl Phys Lett (2019) 115:151105. doi:10.1063/1.5110383
36. Zhao Z, Gu Z, Ako RT, Zhao H, Sriram S. Coherently controllable terahertz plasmon-induced transparency using a coupled Fano-Lorentzian metasurface. Optic Express (2020) 28:15573–86. doi:10.1364/OE.393714
Keywords: terahertz, metamaterial, Fano resonance, tunable, sensing
Citation: Wang Y, Jia S and Qin J (2021) Tunable Fano Resonance and Enhanced Sensing in Terahertz Metamaterial. Front. Phys. 8:605125. doi: 10.3389/fphy.2020.605125
Received: 11 September 2020; Accepted: 17 November 2020;
Published: 08 January 2021.
Edited by:
Longqing Cong, University of Pennsylvania, United StatesReviewed by:
Yogesh Kumar Srivastava, Nanyang Technological University, SingaporeDejun Liu, Shanghai Normal University, China
Copyright © 2021 Wang, Jia and Qin. This is an open-access article distributed under the terms of the Creative Commons Attribution License (CC BY). The use, distribution or reproduction in other forums is permitted, provided the original author(s) and the copyright owner(s) are credited and that the original publication in this journal is cited, in accordance with accepted academic practice. No use, distribution or reproduction is permitted which does not comply with these terms.
*Correspondence: Jianyuan Qin, anlxaW5AY2psdS5lZHUuY24=