 Xiaoyan Li
 Yubing Han
 Wenjie Liu
 Cuifang Kuang1,2,3
 Xiang Hao
- 1State Key Laboratory of Modern Optical Instrumentation, College of Optical Science and Engineering, Zhejiang University, Hangzhou, China
- 2Ningbo Research Institute, Zhejiang University, Ningbo, China
- 3Collaborative Innovation Center of Extreme Optics, Shanxi University, Taiyuan, China
Three-dimensional (3D) imaging using dual-lens fluorescence microscopies is popular in observing fluorescently labeled biological samples, such as mammalian/model animal cells, tissues, and embryos. Specifically, dual-lens super-resolution fluorescence microscopy methods using two opposing objective lenses allow significantly higher axial resolution and better signal to noise ratio than traditional single-lens counterparts, and thus distinguish more details in 3D images of fine intracellular structures. For 3D imaging of thick tissues and entire embryos, dual-lens light-sheet fluorescence microscopy methods using two objective lenses, either orthogonal or non-orthogonal, to achieve selective plane illumination, can meet the requirements, and thus can be used to observe embryo development and structures of interest in thick tissues. This review summarizes both dual-lens fluorescence microscopy methods, including their principles, configurations, and 3D imaging applications, providing a guideline for biological laboratories with different 3D imaging needs.
Introduction
In the past decades, far-field fluorescence microscopy was widely used for observing regions of interest noninvasively in life science. These studies focusing on biological samples, especially mammalian/model animal cells, tissues, and embryos, have tremendously promoted human’s understanding of some important structures and mechanisms. In the process, three-dimensional (3D) imaging is popular and often essential because of the 3D entity characteristics of biological samples, which provides more information than two-dimensional (2D) imaging to resolve the practical structure of the samples.
Comparing with conventional epifluorescence microscopy whose 3D resolution is ∼250 nm laterally and ∼600 nm axially, traditional single-lens 3D super-resolution fluorescence microscopy (SRFM) methods, which can be divided into laser scanning confocal fluorescence microscopy [1] and widefield 3D structured illumination microscopy (3D-SIM) [2] according to their illumination modalities, can provide ∼
However, the traditional single-lens configurations cannot avoid the problem of resolution anisotropy, by which the axial resolution is substantially ∼2.5-fold worse than the lateral counterpart. The inferior axial resolution severely limits the precise 3D imaging and corresponding image-based data analysis. For this, dual-lens axial SRFM methods which sandwich the sample between two opposing objective lenses (Figure 1) to break the axial diffraction limit were developed. In the dual-lens axial SRFM configurations, there are two symmetric illumination wave fronts that interfere in the common focal region and/or two symmetric detection wave fronts that interfere on the detector when the optical lengths of the illumination arm and detection arm are both within the coherent length. The interference results into three- to seven-fold resolution improvement in the axial direction in both scanning and widefield modalities of dual-lens axial SRFM methods without (Figures 1A-C) or with (Figures 1D,E) relying on fluorescence nanoscopy. Furthermore, because the detected fluorescence photons are doubled in the dual-lens configurations, the signal-to-noise ratio (SNR) of their 3D images is improved. However, the more faithful 3D imaging results come at the expense of experimental difficulties in alignment and interference maintaining, that is, the two critically chosen objective lenses need to be aligned with a large number of parameters in parallel, and the illumination/detection arms (each >10 cm long) have to be maintained with sub-wavelength scale stability to insure interference. The two experiment requirements cause their sensitivity to refractive index inhomogeneity. As a result, the dual-lens axial SRFM methods are limited to observe subcellular structures of fixed and some living mammalian cells, and their 3D imaging of thicker samples, for example, mammalian/model animal tissues or embryos, have almost not been explored.
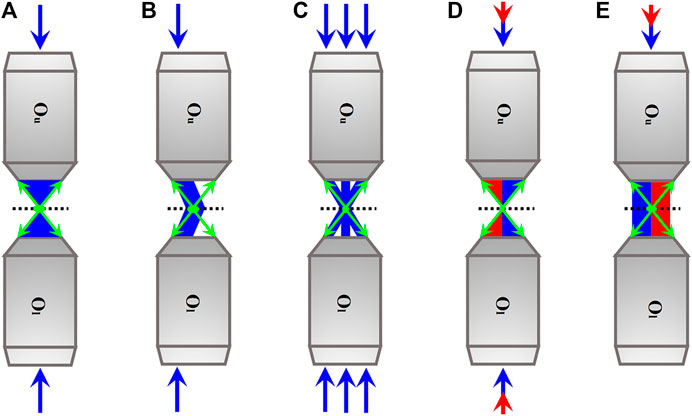
FIGURE 1. Simplified schematics of axial SRFM methods. (A)–(C) Axial SRFM methods without relying on nanoscopy. According to their illumination modalities, they can be divided into scanning modality (A), widefield modality without (B) and with (C) laterally structured illumination. (D) and (E) Axial SRFM methods relying on nanoscopy. According to their illumination modalities, they can also be divided into scanning modality in which synchronized excitation light (blue) and STED light (red) are used for sharpening focal spot (D) and widefield modality in which synchronized excitation light (blue) and activation light (red) are used for localizing the individual fluorescent molecule sequentially (E). Blue and green arrows indicate the directions of the excitation beam and fluorescence. The directions of the STED light and activation light are both indicated by red arrows. The dotted line is at the sample plane. Ou, the upper objective lens; Ol, the lower objective lens.
For thick biological samples like tissues or embryos, their 3D images can be obtained by dual-lens light-sheet fluorescence microscopy (LSFM), which is another dual-lens 3D imaging method reviewed here. In the dual-lens LSFM configurations, there are one illumination objective lens (IO) and one detection objective lens (DO) which are arranged either orthogonally or non-orthogonally to achieve selective plane illumination. The IO focuses a thin light sheet just in the position of the focal plane of the DO and thus causes no out-of-focus fluorescence distraction inherently, which results into remarkable optical sectioning capability and accompanying low phototoxicity and photobleaching, and its widefield detection mechanism is beneficial to living imaging. As a result, the dual-lens LSFM methods are widely used for longtime 3D imaging of large biological samples, such as recording the embryogenesis and early embryo development of mammalian/model animals [12]. Further combined with SR methods, they can also be used to observe fine intracellular structures in thick tissues. In fact, on top of the dual-lens LSFM configurations, some LSFM methods using three or four objective lenses were developed. Although their two-sided illumination and/or detection by adding an objective lens opposite the existing IO and/or DO achieve better 3D imaging performances to some extent, the experimental complexity is increased. These LSFM methods will not be discussed in this review, readers can refer to other publications for further details [13–15].
The present review focuses on two complementary advanced dual-lens fluorescence microscopy methods called dual-lens axial SRFM and LSFM, respectively. Specifically, the dual-lens axial SRFM with superior axial super resolution can image fine subcellular structures at a penetration depth comparable with an entire mammalian cell, but its 3D imaging capability for thicker biological samples like mammalian/model animal tissues and embryos is limited, which can be compensated by dual-lens LSFM, a type of microscopy with inherent optical sectioning capability arising from selective plane illumination, but inferior axial resolution despite the introduction of SR methods. In the following sections, we introduce the dual-lens axial SRFM and LSFM methods, including their principles, configurations, and applications, and then, we summarize this review and make a discussion and brief outlook around dual-lens 3D imaging methods.
Dual-Lens Axial Super-Resolution Fluorescence Microscopy Methods for 3D Imaging
Dual-Lens Super-Resolution Fluorescence Microscopy Methods Without Relying on Nanoscopy
Scanning Modality
In 1992, Hell et al. first proposed dual-lens axial SRFM called 4Pi microscopy because its full solid angle is nearly 4π [16]. In the first 4Pi microscopy configuration, there was only the interference between two symmetric illumination wave fronts around the focal region that was exploited, which is called the 4Pi-type-A mode. Similarly, the mode which combines the fluorescence emitted from the two opposing objective lenses coherently is called 4Pi-type-B [17]. Although the two modes are sufficient for a three- to five-fold sharpened 4Pi point spread function (4Pi-PSF) [18], a seven-fold sharpened 4Pi-PSF can be achieved by combining both modes simultaneously, which is referred to as 4Pi-type-C mode [19], and the initial left and right arrangement of the two opposing objective lenses [20] was replaced by a modified upper and lower arrangement for more convenient sample mounting [21], as shown in Figure 2.
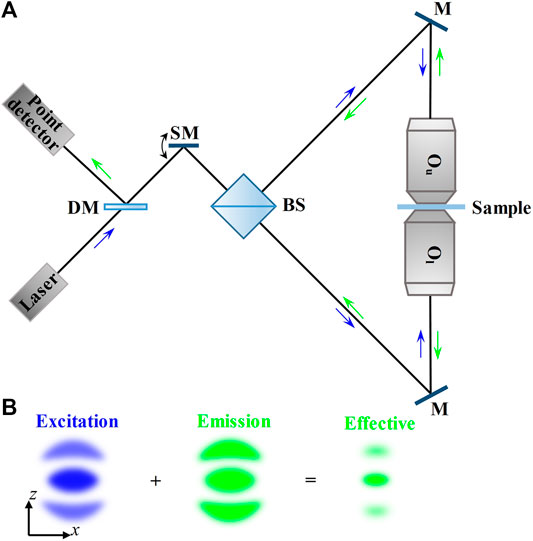
FIGURE 2. Schematic and principle of 4Pi-type–C microscopy. (A) Schematic of 4Pi-type–C microscopy. The excitation beam from the laser is fed through a scanning mirror and a 50/50 beam splitter into the 4Pi cavity. The fluorescence emitted from the sample is inversely collected by the same objective lenses and reflected by a dichroic mirror, and finally collected by a point detector. (B) PSFs in 4Pi-type–C microscopy in the axial (xz) plane. The effective PSF is obtained by the superimposition of excitation PSF and emission PSF. Blue and green arrows indicate the directions of the excitation beam and fluorescence. DM, dichroic mirror; SM, scanning mirror; BS, 50/50 beam splitter; M, mirror; Ou, the upper objective lens; Ol, the lower objective lens.
Most applications of 4Pi microscopy in 3D imaging of biological samples were based on the 4Pi-type-C mode. In combination with two-photon excitation (2PE) which can suppress “ghost images” arising from interference effectively, 4Pi microscopy was used to observe the mitochondrial network of living Saccharomyces cerevisiae cells [21] and reveals H2AX chromatin structures and their response to DNA damage in fixed HeLa cells [22] at an axial resolution of ∼100 nm. Furthermore, mitochondrial oxidative phosphorylation and energetic status can be reflected by observing the disintegration of the mitochondrial network. For example, the tubules or their branching or bifurcation points in the interconnected mitochondrion of optimum insulinoma 1NS-1E cells will be transferred into flat cisternae when cultivated at decreased glucose condition (Figures 3A,B) [23], and type-2 diabetes islet β-cells isolated from diabetic Goto-Kakizaki rats exhibit a more disintegrated mitochondrial network than those from control Wistar rats (Figures 3C,D) [24]. The standardization of these patterns may lead to the development of morphological diagnostics for Langerhans islets before their transplantations.
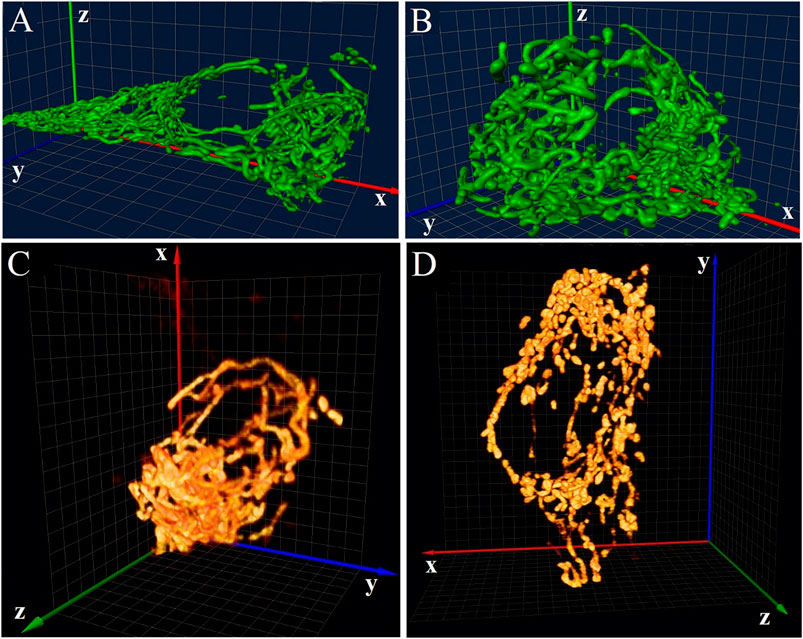
FIGURE 3. Applications of 4Pi microscopy in 3D imaging. (A) and (B) 4Pi images of the mitochondrial network in 1NS-1E cells cultivated at optimum (A) and decreased (B) glucose conditions. Figures are modified with permission from Ref. 23. Copyright © 2008 Elsevier. (C) and (D) 4Pi images of the mitochondrial network in islet β-cells of control Wistar rats (C) and diabetic Goto-Kakizaki rats (D). Figures are modified with permission from Ref. 24. Copyright © 2010 Elsevier. The size of all 3D grids shown in the background is 1 μm.
Widefield Modality
In 1995, Gustafsson et al. first developed dual-lens axial SRFM adopting widefield illumination and detection [25], which is called I5M later [26], as shown in Figures 4A and 4C. The concept of “I5” equals to a combination of “I3” (incoherent interference illumination, an analogy to 4Pi-type-A) and “I2” (image interference, an analogy to 4Pi-type-B), and thus, the I5M method also achieved up to seven-fold axial resolution improvement [27]. However, its lateral resolution is unchanged as in epifluorescence microscopy. For this, an extension of I5M called I5S which adds structured illumination in the lateral direction for lateral super resolution was proposed [28], as shown in Figures 4B and 4D. The I5S method achieved 100 nm scale near-isotropic 3D resolution and was used to image microtubule cytoskeleton in HeLa cells [29].
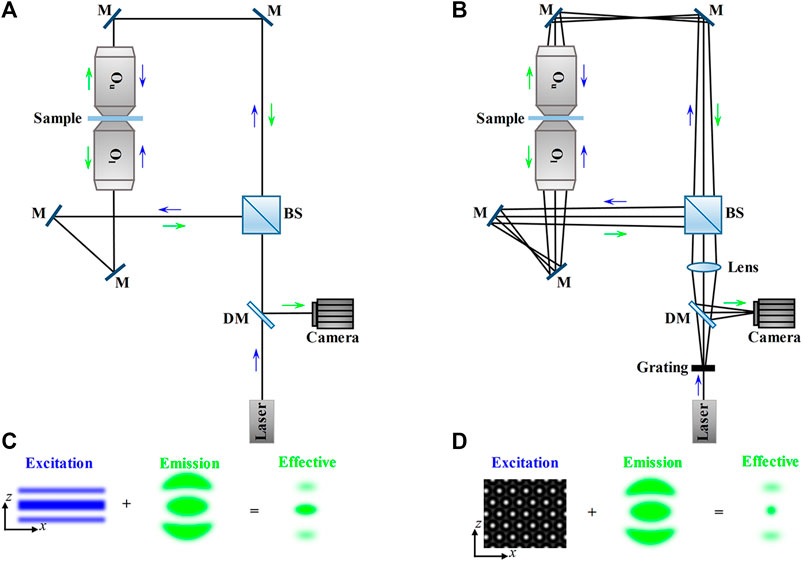
FIGURE 4. Schematic and principle of I5M and I5S. (A) Schematic of I5M. The excitation beam from the laser is fed through a beam splitter and four mirrors into the interference cavity. The fluorescence emitted from the sample is inversely collected by the same objective lenses, reflected by a dichroic mirror, and finally collected by a camera. (B) Schematic of I5S. The excitation beam from the laser is split by a grating into three diffracted beams, which is the only difference between I5S and I5M. (C) PSFs in I5M in the axial (xz) plane. The effective PSF is obtained by the superposition of excitation PSF and emission PSF. (D) The excitation pattern and PSFs in the axial (xz) plane. The effective PSF is obtained by the superimposition of the 3D interference pattern produced by the three diffracted beams and the emission PSF. Blue and green arrows indicate the directions of the excitation beam and fluorescence. DM, dichroic mirror; SM, scanning mirror; BS, 50/50 beam splitter; M, mirror; Ou, the upper objective lens; Ol, the lower objective lens.
The initial I5S implementation used gratings to split the illumination light into three diffracted beams (order 0th and ±1st), and the interference between them produced a 3D sinusoidal pattern. In contrast to the diffraction grating, ferroelectric liquid crystal spatial light modulator [30, 31] and scanning galvanometer mirror (SGM) [32–34] can satisfy the demands of faster and more flexible pattern generation. As a result, a combination of SGM-based I5S and fluorescence saturation [35] termed as saturated I5S or SI5S [36] was developed in theory and obtained near-isotropic 3D resolution below 60 nm. Its superior imaging capability can be seen from Figures 5. Furthermore, the grating- and SGM-based I5S implementations can both be provided optionality of a second camera at the detection end for higher fluorescence efficiency [37].
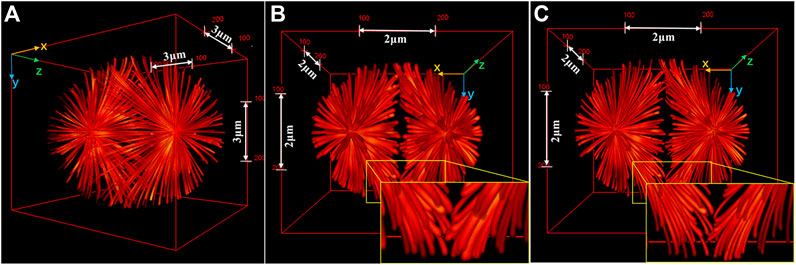
FIGURE 5. Comparison of 3D images of a complex sample reconstructed by I5S and SI5S. (A) Ground truth image. (B) and (C) 3D perspectives of the images reconstructed by I5S (B) and SI5S (C). The image reconstructed by SI5S shows more distinct structures. The insets show expansions of the yellow outlined regions of the images. Figures are modified with permission from Ref. 36. Copyright © 2020 Elsevier.
Dual-Lens Super-Resolution Fluorescence Microscopy Methods Relying on Nanoscopy
Scanning Modality
Dual-lens axial SRFM methods relying on nanoscopy which are called 4Pi nanoscopies uniformly can also be classified into scanning modality and widefield modality. In scanning modality (Figure 6A), it is the illumination light in the sample space that matters. Specifically, the sample is scanned by a sharpened scanning focal spot which is formed by superimposing diffraction-limited excitation spot and doughnut-shaped STED pattern. The synchronized excitation beam (visible laser pulse on the sub-picosecond scale) and STED beam (near-infrared laser pulse on the scale of tens of picoseconds) should be aligned carefully to achieve the most effective depletion.
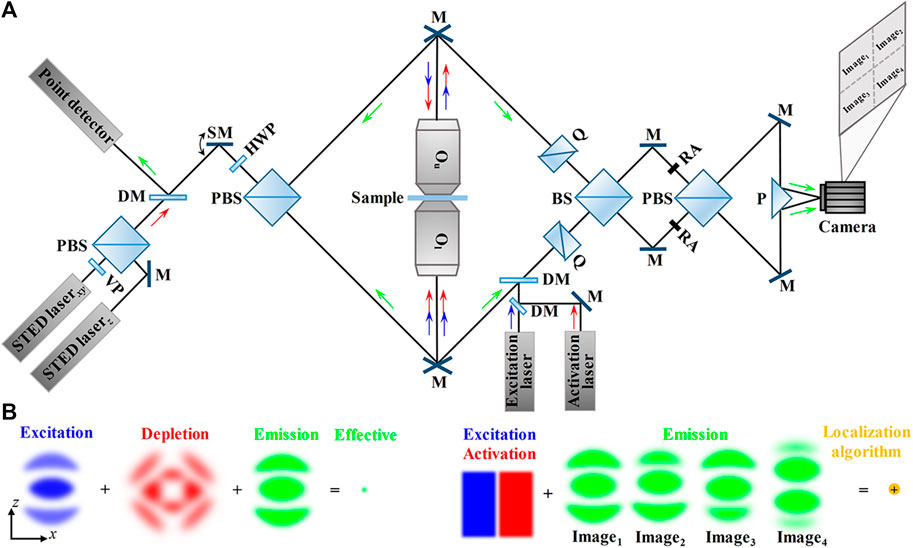
FIGURE 6. Schematic and principle of dual-lens SRFM methods relying on nanoscopy. (A) Schematic of scanning modality (left, such as isoSTED/4Pi-RESOLFT) and widefield modality (right, 4Pi-SMLM). Left: in isoSTED, the beams for STEDxy (lateral) and STEDz (axial) are combined by a polarizing beam splitter and then fed through a scanning mirror and a second polarizing beam splitter into the 4Pi cavity. The fluorescence from the sample is inversely collected by the same objective lenses and reflected by a dichroic mirror, and finally collected by a point detector. Right: in 4Pi-SMLM, the synchronized excitation beam and activation beam are fed into the interference cavity so that only individual fluorescence molecules are bright at a time. The fluorescence is divided and recombined by a beam splitter and a polarizing beam splitter to create four interference patterns with different phases, and then, the four interference patterns are imaged by the four-quadrant camera simultaneously. (B) PSFs in isoSTED (left) and 4Pi-SMLM (right) in the axial (xz) plane. Left: the isotropic effective PSF is obtained by the superimposition of excitation PSF, depletion PSF (the superimposition of STEDxy beam and STEDz beam), and emission PSF. Right: the synchronized excitation beam and activation beam make sure only individual fluorescence molecules are bright at a time. The four emission PSF images obtained by the self-interference of individual fluorescence molecules are processed by the localization algorithm to localize the individual molecules. Blue and green arrows indicate the directions of the excitation beam and fluorescence. VP, 0–2π vortex phase plate; DM, dichroic mirror; SM, scanning mirror; Q, quartz wedges; BS, 50/50 beam splitter; PBS, polarizing beam splitter; RA, rectangle aperture; M, mirror; P, prism; Ou, the upper objective lens; Ol, the lower objective lens.
In 2002, Hell et al. first implemented two concepts of STED and 4Pi synergistically [38]. The so-called STED–4Pi (4Pi-type-A in effect) nanoscopy obtained an oblate focal spot whose full width at half maximum is ∼33 nm in the axial direction but unchanged in the lateral direction. The method was used for imaging bacteria membranes [38] and microtubules in fixed HEK cells [39]. As a spherical spot is more desired to unfold the sample’s full 3D potential in most biological imaging applications, Roman et al. proposed isoSTED (4Pi-type-C in effect) nanoscopy [40]. The method exploited the polarization of illumination beams, that is, the polarization directions of two symmetric lateral depletion (STEDxy) beams and two symmetric axial depletion (STEDz) beams were perpendicular to each other so that their interferences were constructive and destructive, respectively. Meanwhile, two symmetric excitation beams interfered constructively and rendered a focal volume cut down by half. As a result, the isoSTED nanoscopy obtained an isotropic focal spot of 40–45 nm in diameter, and its 3D imaging capability was demonstrated by dissecting the distribution of the mitochondrial outer membrane proteins (Figures 7A,B) and quantifying 3D dynamics of inner membrane cristae (Figure 7C) in living PtK2 cell [41]. However, the superior imaging performance of isoSTED comes at the expense of complex implementation, including counter alignment of the two objective lenses and co-alignment of the three beams. To reduce the overall alignment effort, a segmented wave plate with chromatic selectivity was introduced into isoSTED to remain the constructive interference of the excitation beams and achieve interference between two symmetric polarization-modified STED beams [42]. The single-beam isoSTED nanoscopy achieved an isotropic 3D resolution of 20–50 nm and was used to image vimentin network and nuclear pore complex in Vero cells.
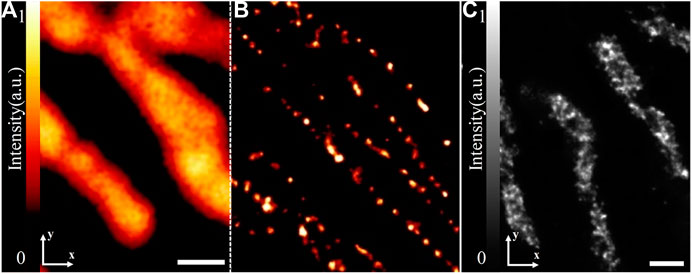
FIGURE 7. Applications of isoSTED in 3D imaging. (A) and (B) Confocal image (A) and isoSTED image (B) of the translocase on the outer membrane of mitochondria complexes. (C) isoSTED image of mitochondrial inner membrane cristae protein complexes F1F0ATPase. There are pronounced heterogeneous cristae arrangements within individual mitochondrial tubules in which some regions are absent of cristae. Figures are modified with permission from Ref. 41. Copyright © 2009 American Chemical Society. All scale bars: 500 nm.
Nevertheless, the applications of isoSTED in living cell imaging are always limited because it requires extremely high STED laser intensity to guarantee effective depletion. For this, a STED-derivative named RESOLFT, which operates reversibly switchable fluorescent proteins with low light levels to provide mandatory bright and dark states, was developed as 4Pi architecture to image living cells genteelly [43]. The 4Pi-RESOLFT nanoscopy achieved imaging of microfilaments and intermediate filaments in living HeLa cells at a 3D resolution of 30 nm.
Widefield Modality
In widefield modality, it is the emitted fluorescence detected by the camera that matters. Specifically, the sample is widefield illuminated by synchronized excitation light and activation light through the two opposing objective lenses, but the emitted fluorescence is divided into two symmetric coherent wave fronts and interfere at the camera, as shown in Figure 6A. The self-interference of individual fluorescence molecules generates three or four interference phases which are sensitive to their axial positions within the 0–2π interval, and thus the 3D coordinates of individual fluorescence molecules can be localized using localization algorithms. Therefore, the widefield modality can also be called 4Pi single-molecule localization microscopy (4Pi-SMLM).
The first realization of 4Pi-SMLM was a three-phase interferometric PALM (iPALM) in 2009 [44]. The method achieved sub-20-nm 3D resolution and was used for imaging microtubules in PtK1 cell, dorsal and ventral plasma membranes in COS7 cell, and endoplasmic reticulum/adhesion complexes in U2OS cell. Further, it performed well in multicolor imaging, such as deciphering the 3D organization of endosomal sorting complexes required for transport (ESCRT) components at human immunodeficiency virus (HIV) assembly sites in two color [45] (Figure 8A) and understanding the mechanism of recruitment of viral envelope glycoprotein (Env) to HIV type 1 (HIV-1) assembly sites in three color [46] (Figure 8B). Furthermore, the problem of its imaging of mammalian cell samples thicker than 250 nm was limited because of the axial localization ambiguity that was solved by using hyperbolic mirrors to introduce ellipticity into scanning spot [47]. The modified iPALM extended its imaging depth to 750 nm and was used to visualize the mitochondrial nucleoids in 500-nm–thick mouse fibroblasts.
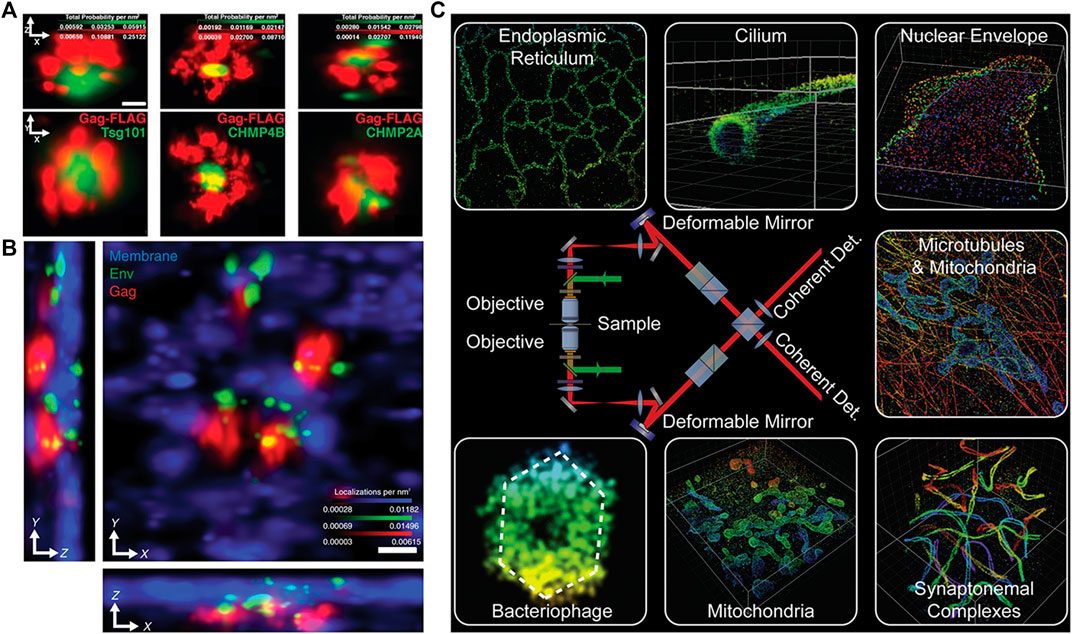
FIGURE 8. Applications of 4Pi-SMLM in 3D imaging. (A) Two-color iPALM imaging of Gag-FLAG (red) and PSCFP2-ESCRT probes (including Tsg101, CHMP4B, and CHMP2A) (green). Axial (top) and lateral (bottom) views show localization of PSCFP2-ESCRT probes with the HIV Gag lattice. The figure is modified with permission from Ref. 45. Copyright © 2018 Springer Nature. (B) Three-color iPALM imaging of subviral angular distributions of Env at HIV-1 assembly sites. Lateral (center) and axial (lower and left) views show individual Env clusters (green) with four assembly sites (red) protruding from the plasma membrane (blue). The figure is modified with permission from Ref. 46. Copyright © 2014 American Association for the Advancement of Science. (C) A sketch of 4Pi-SMSN and some imaging results. The figure is modified with permission from Ref. 49. Copyright © 2016 Elsevier. Scale bars: 50 nm (A) and 100 nm (B).
Besides, the axial localization ambiguity even at 1-μm imaging depth can be eliminated by analyzing image moments, which was first operated on four-phase 4Pi single-molecule switching (4Pi-SMS) microscopy [48]. The method achieved a 3D resolution of 5.4–6.6 nm axially and 8.3–22.3 nm laterally, and its capability for 3D imaging of biological samples thicker than 250 nm was demonstrated by observing human platelet activation and microtubules in Vero cells. Further, two-color imaging of peroxysomes (Atto 532 labeled) and microtubules (Atto 565 labeled) in a PtK2 cell was achieved through classifying Atto 532 and Atto 565 by the ratio of the combined s-polarization vs. the p-polarization components. On top of the 4Pi-SMS microscopy, a modified implementation named 4Pi-SMSN with a penetration depth up to 10 μm was achieved in 2016 [49]. The 4Pi-SMSN introduced adaptive optical elements in the “4Pi cavity” to compensate for sample-induced aberrations and replaced an electron multiplying charge-coupled device (EMCCD) with scientific complementary metal-oxide semiconductor (sCMOS) for higher quantum efficiency. Further, coupled with the optimized higher precision axial localization algorithm, the 4Pi-SMSN achieved a 3D resolution in the range of 10–20 nm and could be used to resolve almost any subcellular structure throughout a whole mammalian cell, as shown in Figure 8C. Furthermore, the 4Pi-SMSN was applied to visualize the type III protein secretion machines in living bacteria [50] and observe the Golgi apparatus in three-color at nanoscale lateral super resolution for the first time [51].
Dual-Lens Light-Sheet Fluorescence Microscopy Methods for 3D Imaging
For 3D imaging of biological samples like mammalian/model animal tissues and embryos which are thicker than mammalian cells, dual-lens LSFM performs well. Because its general configurations use two orthogonal or non-orthogonal objectives to achieve selective plane illumination, that is, placing the IO before a cylindrical lens [52] (Figure 9A) or laser scanner [53] (Figure 9B) to focus a static or dynamic light sheet in the focal plane of the DO, so the LSFM can also be called selective plane illumination microscopy (SPIM) [54].
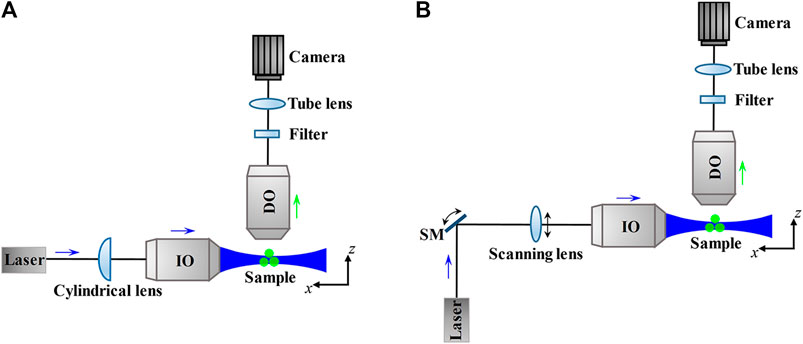
FIGURE 9. Schematic and principle of dual-lens LSFM. (A) and (B) The thin excitation light sheet produced by a cylindrical lens (A) or a laser scanner (including a scanning mirror and a scanning lens) (B) only illuminate the focal plane of the detection objective lens, which reduces photobleaching and phototoxicity to the sample. The fluorescence emitted from the sample is through the filter and tube lens and then detected by the camera. Blue and green arrows indicate the directions of the excitation beam and fluorescence. SM, scanning mirror; IO, illumination objective lens; DO, detection objective lens.
In the traditional dual-lens LSFM with a horizontal IO and a vertical DO, as shown in Figure 10A, the sample is embedded in a cylinder of agarose gel held in a glass capillary or a syringe which can be inserted from above into an aqueous-medium-filled chamber placed in the center of the illumination and detection paths. This arrangement is beneficial to the alignment of the illumination and detection axes, but the preparation and positioning of the sample are challenging. For this, some variants of dual-lens LSFM compatible with sample formats used in traditional inverted microscope appeared, such as inverted SPIM [55] and open-top SPIM [56], which use oblique orthogonally arranged IO and DO above (Figure 10B) and beneath (Figure 10C) the sample stage of a traditional inverted microscope, respectively. However, the orthogonal arrangements still require the sum of access angles of IO and DO to be less than 90°, which limits the choice of their respective numerical apertures (NA).
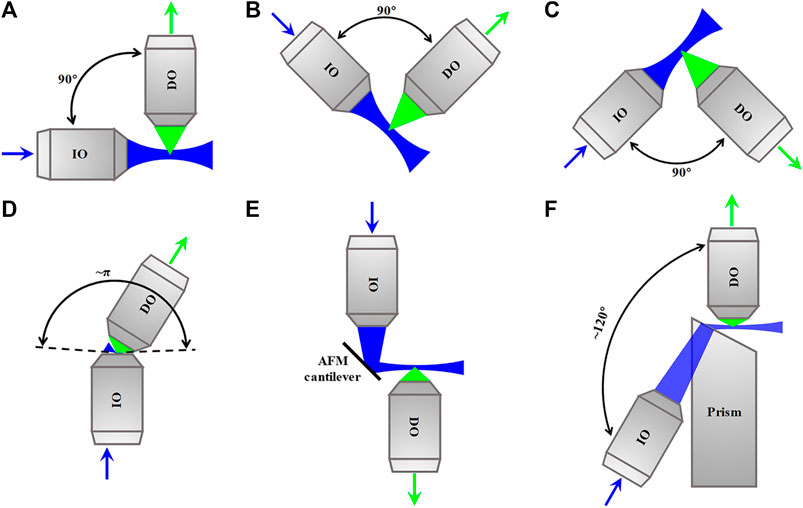
FIGURE 10. Schematics of dual-lens LSFM methods. (A)–(C) Dual-lens LSFM methods with two orthogonal objective lenses. (D)–(F) Dual-lens LSFM methods with two non-orthogonal objective lenses. Blue and green arrows indicate the directions of the excitation beam and fluorescence. IO, illumination objective lens; DO, detection objective lens; AFM, atomic force microscopy.
To solve the problem, some dual-lens LSFM configurations with non-orthogonally arranged high-NA IO and/or DO were developed. For example, πSPIM [57] whose sum of the NA opening angles of IO and DO is close to π uses a high-NA IO to produce an oblique light sheet, as shown in Figure 10D. The method was used to image endocytosis in living yeast. Besides, reflected light-sheet microscopy (RLSM) [58], in which the vertical light sheet focused by IO on the surface of atomic force microscopy (AFM), cantilever is reflected by 90° off to produce a horizontal light sheet, and the fluorescence is detected by a high-NA DO, as shown in Figure 10E. The method was used to monitor the binding properties of the glucocorticoid receptor and estrogen receptor-α to DNA in living MCF-7 cells. Combining the RLSM with individual molecule localization (IML) algorithms, 3D imaging of the spatial organization of RNA polymerase II in the nucleus of U2OS cells was achieved [59]. In addition to them, a configuration called light-sheet Bayesian microscopy (LSBM) [60] whose angle between IO and DO is approximately 120° uses a prism-coupled IO to produce a horizontal light sheet at the focal plane of a high-NA DO, as shown in Figure 10F. The LSBM adopted localization-based Bayesian algorithm and achieved 50–60 nm lateral resolution, and it was applied to image heterochromatin in the nucleus of human embryonic stem cells.
In addition to RLSM and LSBM, the SR method of IML was also introduced to traditional dual-lens LSFM configuration and achieved imaging an entire 150-μm–thick human mammary MCF10A cell spheroid at a 3D resolution of 63 nm laterally and 140 nm axially [61]. To maximize the advantage of the remarkable optical sectioning capability of LSFM, some other SR methods had also been introduced into it to resolve fine intracellular structures of thick samples. For example, SIM can be combined with dual-lens LSFM to understand some dynamic cellular and subcellular processes, such as lattice-SIM [62], which achieves structured illumination by scanning a hexagonal lattice obtained a 3D resolution of 150 nm laterally and 280 nm axially, and Bessel-SIM [63], which scans parallel Bessel beams for structured illumination, obtaining a 3D resolution of 180, 230, and 350 nm in x-, y-, and z-directions, respectively. Besides, the integration of STED and SPIM can obtain 30% and 17% resolution improvements in the axial direction and lateral direction, respectively [64]. The method was used to observe actin in zebrafish embryos, and the STED–SPIM image showed more details than its SPIM counterpart, as shown in Figures 11A and 11B. Besides, a combination of 2PE and dual-lens LSFM called two-photon three-axis digital scanned light-sheet microscopy (DSLM) [65] achieved a 3D resolution of 350 nm laterally and 600 nm axially. Further introducing stochastic optical fluctuation imaging (SOFI) into it [66], the method achieved a 3D resolution of 200 nm laterally and 500 nm axially and was used for imaging mitochondria of HeLa cells in a volume of about 25 × 30 × 11.5 μm3, as shown in Figures 11C and 11D.
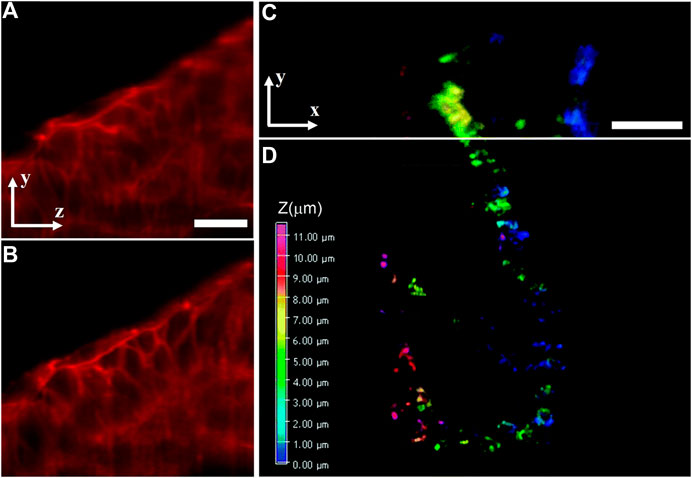
FIGURE 11. Dual-lens LSFM methods for 3D imaging of intracellular structures of thick biological samples. (A) and (B) SPIM image (A) and STED–SPIM image (B) of the actin cytoskeleton in developing zebrafish embryos. Figures are modified with permission from Ref. 64. Copyright © 2011 Elsevier. (C) and (D) 3D images of mitochondrial structures of fixed HeLa cell taken with two-photon three-axis DSLM (C) and its SOFI counterpart (D). Figures are modified with permission from Ref. 66. Copyright © 2016 The Royal Society of Chemistry. Scale bars: 20 μm (A) and 5 μm (C).
Discussion and Outlook
All 3D imaging methods reviewed here are based on dual-lens axial SRFM and LSFM which use two opposing and orthogonal/non-orthogonal objective lenses, respectively. We summarized their principles, configurations, and 3D imaging applications. We can conclude that, in 3D imaging of biological samples covering mammalian/model animal cells, tissues, and embryos, the two methods have their advantages and disadvantages but complement each other meanwhile. Specifically, the dual-lens axial SRFM methods have superior axial super resolution but are sensitive to the aberrations induced by the refractive index inhomogeneities within the sample, so they are limited to image fine intracellular structures of relatively thin biological samples like mammalian cells, and the dual-lens LSFM methods have an inferior axial resolution but inherent optical sectioning capability arising from selective plane illumination, and thus can be used for 3D imaging thicker biological samples like mammalian/model animal tissues and embryos. There are other dual-lens fluorescence microscopy methods [67] besides the ones reviewed here, for example, confocal theta fluorescence microscopy [68, 69], whose angle between illumination axis and detection axis is typically set to be 90° to improve the axial resolution and thus obtain isotropic 3D resolution. However, its axial resolution can only be increased by 3–4 times, and its lateral resolution is slightly reduced because the effective NA of the two objective lenses is less than that of a single objective lens. Besides, there is an analog of I5M called standing wave fluorescence microscopy (SWFM) [70] which also uses a pair of objective lenses positioned on opposite sides of the sample to improve the axial resolution. Differently, in the focal region of SWFM, the standing wave fringes formed by interference between two symmetric illumination wave fronts have periodic axial intensity distribution, which causes multiple fluorophores across several periods to not be distinguished because they emit the same intensity. As a result, the thickness of the observed samples in SWFM is limited to an axial extension comparable to one light wavelength which is thinner than most mammalian cells.
Furthermore, considering the experimental complexity of dual-lens axial SRFM, there are some virtual axial SRFM configurations that were developed to give access to this promising method to more laboratories. Specifically, one of the two opposing objective lenses is replaced by a flat mirror to make the incident and back-reflected illumination wave fronts interfere in the sample. These configurations provide comparable axial resolution enhancement that can be readily implemented on both scanning modality and widefield modality of the dual-lens axial SRFM methods, for example, isotropic single-objective focusing microscopy [71], axial-resolution–extended SIM through mirrored illumination [72], and mirror-enhanced axial-narrowing super-resolution STED technique [73], which can be regarded as virtual configurations of 4Pi microscopy, I5S, and isoSTED, respectively. Besides, a virtual 4Pi-SMLM configuration can be achieved by combining the single-objective reflected interference scheme with 3D particle localization [74]. Similarly, there are also some simplified setups of dual-lens LSFM for reduced experimental difficulties but unchanged imaging effect. For example, single-objective SPIM (soSPIM) in which the illumination light from a high NA objective lens is reflected by a 45° micromirror cavity to create a horizontal light sheet and the emitted fluorescence is collected through the same objective lens [75], and single-objective light-sheet microscopy (SO-LSM) which uses a 45° mirror sidewall of a microfluidic channel instead to create a horizontal light sheet [76].
Moreover, for 3D imaging of some challenging intracellular structures and structures of the eukaryotic cell nucleus, a nanoscale or even atomic-scale super resolution is essential. Recently, an advanced combination of STED and SMLM called minimal photon fluxes (MINFLUX) microscopy [77], which localizes individual switchable fluorophores with a doughnut-shaped excitation beam minimum, achieved imaging of nuclear pore complexes of mammalian cells and dual-color imaging of DNA origami at a 3D resolution in the range of 1–3 nm [78]. It was also used to image the challenging quasi-one-dimensional lattice structured spectrin tetramers which connect the adjacent actin/adducin rings along the cytoskeleton of an axon, and the MINFLUX image showed a more realistic continuous spiral structure [79] than an earlier end-to-end and side-by-side organizations revealed by STORM [80] and polarized SIM [81], respectively. Although the MINFLUX is primarily operated on the single-lens configuration to date, there is no fundamental barrier that rejects its integration into the dual-lens axial SRFM architecture to gain better SNR. Besides, 3D imaging of biological samples thicker than mammalian/model animal tissues and embryos, like the entire mouse brain and body, will contribute to a better understanding of some severe diseases related to human beings, such as Alzheimer’s and Parkinson’s. To do this, LSFM is a good choice. Meanwhile, the biological samples have to be transparent by optical clearing which uses organic solvents to make the refractive indexes of different layers matching the solvent [82, 83]. We can make a reasonable prediction that with the advent of more advanced optical clearing techniques, its combination with LSFM can lead to more unexpected discoveries.
Author Contributions
XiL conceived the idea and finished the manuscript. YH, WL, and XH gave guidance. XH, CK, and XuL supervised the project. All the authors contributed to the discussion on this manuscript.
Funding
This work was financially supported by the grants from National Key R&D Program of China (2018YFA0701400, 2018YFE0119000), the Fundamental Research Funds for the Central Universities (2019QNA5006), and Zhejiang Provincial Natural Science Foundation (LR18H180001).
Conflict of Interest
The authors declare that the research was conducted in the absence of any commercial or financial relationships that could be construed as a potential conflict of interest.
References
1. White JG, Amos WB, Fordham M. An evaluation of confocal versus conventional imaging of biological structures by fluorescence light microscopy. J Cell Biol (1987) 105(1):41–8. doi:10.1083/jcb.105.1.41.
2. Gustafsson MG, Shao L, Carlton PM, Wang CJ, Golubovskaya IN, Cande WZ, et al. Three-dimensional resolution doubling in wide-field fluorescence microscopy by structured illumination. Biophys J (2008) 94(12):4957–70. doi:10.1529/biophysj.107.120345.
3. Abbe E. Beiträge zur Theorie des Mikroskops und der mikroskopischen Wahrnehmung. Arch Mikrosk Anatat (1873) 9:413–8. doi:10.1007/BF02956173.
4. Hell SW. Far-field optical nanoscopy. Science (2007) 316(5828):1153. doi:10.1126/science.1137395.
5. Hell SW, Wichmann J. Breaking the diffraction resolution limit by stimulated emission: stimulated-emission-depletion fluorescence microscopy. Optic Lett (1994) 19(19):780–2. doi:10.1364/ol.19.000780.
6. Hell SW, Kroug M. Ground-state-depletion fluorscence microscopy: a concept for breaking the diffraction resolution limit. Appl Phys (1995) 60(5):495–7. doi:10.1007/BF01081333.
7. Hofmann M, Eggeling C, Jakobs S, Hell SW. Breaking the diffraction barrier in fluorescence microscopy at low light intensities by using reversibly photoswitchable proteins. Proc Natl Acad Sci USA (2005) 102(49):17565. doi:10.1073/pnas.0506010102.
8. Betzig E, Patterson GH, Sougrat R, Lindwasser OW, Olenych S, Bonifacino JS, et al. Imaging intracellular fluorescent proteins at nanometer resolution. Science (2006) 313(5793):1642. doi:10.1126/science.1127344.
9. Rust MJ, Bates M, Zhuang X. Sub-diffraction-limit imaging by stochastic optical reconstruction microscopy (STORM). Nat Methods (2006) 3(10):793–6. doi:10.1038/nmeth929.
10. Hess ST, Girirajan TPK, Mason MD. Ultra-high resolution imaging by fluorescence photoactivation localization microscopy. Biophys J (2006) 91(11):4258–72. doi:10.1529/biophysj.106.091116.
11. Eggeling C, Willig KI, Sahl SJ, Hell SW. Lens-based fluorescence nanoscopy. Q Rev Biophys (2015) 48(2):178–243. doi:10.1017/S0033583514000146.
12. Girkin JM, Carvalho MT. The light-sheet microscopy revolution. J Optic (2018) 20(5):053002. doi:10.1088/2040-8986/aab58a.
13. Swoger J, Huisken J, Stelzer EHK. Multiple imaging axis microscopy improves resolution for thick-sample applications. Optic Lett (2003) 28(18):1654–6. doi:10.1364/OL.28.001654.
14. Huisken J, Stainier DYR. Even fluorescence excitation by multidirectional selective plane illumination microscopy (mSPIM). Optic Lett (2007) 32(17):2608–10. doi:10.1364/OL.32.002608.
15. Tomer R, Khairy K, Amat F, Keller PJ. Quantitative high-speed imaging of entire developing embryos with simultaneous multiview light-sheet microscopy. Nat Methods (2012) 9(7):755–63. doi:10.1038/nmeth.2062.
16. Hell S, Stelzer EHK. Properties of a 4Pi confocal fluorescence microscope. J Opt Soc Am A (1992) 9(12):2159–66. doi:10.1364/JOSAA.9.002159.
17. Hell SW, Stelzer EHK, Lindek S, Cremer C. Confocal microscopy with an increased detection aperture: type-B 4Pi confocal microscopy. Opt Lett (1994) 19(3):222–4. doi:10.1364/OL.19.000222.
18. Cremer A, Verrier S, Goroshkov A, Söling H-D, Hell SW. 4Pi-microscopy of the Golgi apparatus in live mammalian cells. J Struct Biol (2004) 147(1):70–6. doi:10.1016/j.jsb.2003.10.006.
19. Hell SW, Lindek S, Cremer C, Stelzer EHK. Measurement of the 4Pi‐confocal point spread function proves 75 nm axial resolution. Appl Phys Lett (1994) 64(11):1335. doi:10.1063/1.111926.
20. Egner A, Jakobs S, Hell SW. Fast 100-nm resolution 3D-microscope reveals structural plasticity of mitochondria in live yeast. Proc Natl Acad Sci USA (2002) 99(6):3370–5. doi:10.1073/pnas.052545099.
21. Gugel H, Bewersdorf J, Jakobs S, Engelhardt J, Storz R, Hell SW. Cooperative 4Pi excitation and detection yields sevenfold sharper optical sections in live-cell microscopy. Biophys J (2004) 87(6):4146–52. doi:10.1529/biophysj.104.045815.
22. Bewersdorf J, Bennett BT, Knight KL. H2AX chromatin structures and their response to DNA damage revealed by 4Pi microscopy. Proc Natl Acad Sci USA (2006) 103(48):18137–42. doi:10.1073/pnas.0608709103.
23. Plecitá-Hlavatá L, Lessard M, Šantorová J, Bewersdorf J, Ježek P. Mitochondrial oxidative phosphorylation and energetic status are reflected by morphology of mitochondrial network in INS-1E and HEP-G2 cells viewed by 4Pi microscopy. Biochim Biophys Acta (2008) 1777(7-8):834–46. doi:10.1016/j.bbabio.2008.04.002.
24. Dlasková A, Spacek T, Santorova J, Plecita-Hlavata L, Berkova Z, Saudek F, et al. 4Pi microscopy reveals an impaired three-dimensional mitochondrial network of pancreatic islet β-cells, an experimental model of type-2 diabetes. Biochim Biophys Acta (2010) 1797(6-7):1327–41. doi:10.1016/j.bbabio.2010.02.003.
25. Gustafsson MGL, Agard DA, Sedat JW. Sevenfold improvement of axial resolution in 3D wide-field microscopy using two objective-lenses. Proc SPIE (1995) 2412:147–56. doi:10.1117/12.205334.
26. Gustafsson M, Agard D, Sedat J. 3D widefield microscopy with two objective lenses: experimental verification of improved axial resolution. Proc SPIE (1996) 2655:62–6. doi:10.1117/12.237489.
27. Gustafsson MGL, Agard DA, Sedat JW. I5M: 3D widefield light microscopy with better than 100 nm axial resolution. J Microsc (1999) 195(1):10–6. doi:10.1046/j.1365-2818.1999.00576.x.
28. Gustafsson MGL. Surpassing the lateral resolution limit by a factor of two using structured illumination microscopy. J Microsc (2000) 198(2):82–7. doi:10.1046/j.1365-2818.2000.00710.x.
29. Shao L, Isaac B, Uzawa S, Agard DA, Sedat JW, Gustafsson MG. I5S: wide-field light microscopy with 100-nm-scale resolution in three dimensions. Biophys J (2008) 94(12):4971–83. doi:10.1529/biophysj.107.120352.
30. Shao L, Kner P, Rego EH, Gustafsson MG. Super-resolution 3D microscopy of live whole cells using structured illumination. Nat Methods (2011) 8(12):1044–6. doi:10.1038/nmeth.1734.
31. Fiolka R, Shao L, Rego EH, Davidson MW, Gustafsson MG. Time-lapse two-color 3D imaging of live cells with doubled resolution using structured illumination. Proc Natl Acad Sci USA (2012) 109(14):5311–5. doi:10.1073/pnas.1119262109.
32. Chen Y, Cao R, Liu W, Zhu D, Zhang Z, Kuang C, et al. Widefield and total internal reflection fluorescent structured illumination microscopy with scanning galvo mirrors. J Biomed Optic (2018) 23(4):1–9. doi:10.1117/1.JBO.23.4.046007.
33. Chen Y, Liu W, Zhang Z, Zheng C, Huang Y, Cao R, et al. Multi-color live-cell super-resolution volume imaging with multi-angle interference microscopy. Nat Commun (2018) 9(1):4818. doi:10.1038/s41467-018-07244-4.
34. Liu W, Liu Q, Zhang Z, Han Y, Kuang C, Xu L, et al. Three-dimensional super-resolution imaging of live whole cells using galvanometer-based structured illumination microscopy. Optic Express (2019) 27(5):7237–48. doi:10.1364/OE.27.007237.
35. Mats GLG. Nonlinear structured-illumination microscopy: wide-field fluorescence imaging with theoretically unlimited resolution. Proc Natl Acad Sci USA (2005) 102(37):13081–6. doi:10.1073/pnas.0406877102.
36. Liu Q, Yuan Y, Liu W, Li X, Kuang C, Hao X, et al. Sub-60-nm 3D super-resolution imaging via saturated I5S. Optic Commun (2020) 473:125981. doi:10.1016/j.optcom.2020.125981.
37. Shao L, Winoto L, Agard DA, Gustafsson MG, Sedat JW. Interferometer-based structured-illumination microscopy utilizing complementary phase relationship through constructive and destructive image detection by two cameras. J Microsc (2012) 246(3):229–36. doi:10.1111/j.1365-2818.2012.03604.x.
38. Dyba M, Hell SW. Focal spots of size λ/23 open up far-field fluorescence microscopy at 33 nm axial resolution. Phys Rev Lett (2002) 88(16):163901. doi:10.1103/PhysRevLett.88.163901.
39. Dyba M, Jakobs S, Hell SW. Immunofluorescence stimulated emission depletion microscopy. Nat Biotechnol (2003) 21(11):1303–4. doi:10.1038/nbt897.
40. Schmidt R, Wurm CA, Jakobs S, Engelhardt J, Egner A, Hell SW. Spherical nanosized focal spot unravels the interior of cells. Nat Methods (2008) 5(6):539–44. doi:10.1038/nmeth.1214.
41. Schmidt R, Wurm CA, Punge A, Egner A, Jakobs S, Hell SW. Mitochondrial cristae revealed with focused light. Nano Lett (2009) 9(6):2508–10. doi:10.1021/nl901398t.
42. Curdt F, Herr SJ, Lutz T, Schmidt R, Engelhardt J, Sahl SJ, et al. isoSTED nanoscopy with intrinsic beam alignment. Optic Express (2015) 23(24):30891–903. doi:10.1364/OE.23.030891.
43. Bohm U, Hell SW, Schmidt R. 4Pi-RESOLFT nanoscopy. Nat Commun (2016) 7:10504. doi:10.1038/ncomms10504.
44. Shtengel G, Galbraith J, Galbraith C, Lippincott-Schwartz J, Gillette JM, Manley S, et al. Interferometric fluorescent super-resolution microscopy resolves 3D cellular ultrastructure. Proc Natl Acad Sci USA (2009) 106(9):3125–30. doi:10.1073/pnas.0813131106.
45. Van Engelenburg SB, Shtengel G, Sengupta P, Waki K, Jarnik M, Ablan SD, et al. Distribution of ESCRT machinery at HIV assembly sites reveals virus scaffolding of ESCRT subunits. Science (2014) 343(6171):653–6. doi:10.1126/science.1247786.
46. Buttler CA, Pezeshkian N, Fernandez MV, Aaron J, Norman S, Freed EO, et al. Single molecule fate of HIV-1 envelope reveals late-stage viral lattice incorporation. Nat Commun (2018) 9(1):1861. doi:10.1038/s41467-018-04220-w.
47. Brown TA, Tkachuk AN, Shtengel G, Kopek BG, Bogenhagen DF, Hess HF, et al. Superresolution fluorescence imaging of mitochondrial nucleoids reveals their spatial range, limits, and membrane interaction. Mol Cell Biol (2011) 31(24):4994–5010. doi:10.1128/MCB.05694-11.
48. Aquino D, Schonle A, Geisler C, Middendorff CV, Wurm CA, Okamura Y, et al. Two-color nanoscopy of three-dimensional volumes by 4Pi detection of stochastically switched fluorophores. Nat Methods (2011) 8(4):353–9. doi:10.1038/nmeth.1583.
49. Huang F, Sirinakis G, Allgeyer ES, Schroeder LK, Duim WC, Kromann EB, et al. Ultra-high resolution 3D imaging of whole cells. Cell (2016) 166(4):1028–40. doi:10.1016/j.cell.2016.06.016.
50. Zhang Y, Lara-Tejero M, Bewersdorf J, Galan JE. Visualization and characterization of individual type III protein secretion machines in live bacteria. Proc Natl Acad Sci USA (2017) 114(23):6098–103. doi:10.1073/pnas.1705823114.
51. Zhang Y, Schroeder LK, Lessard MD, Kidd P, Chung J, Song Y, et al. Nanoscale subcellular architecture revealed by multicolor three-dimensional salvaged fluorescence imaging. Nat Methods (2020) 17(2):225–31. doi:10.1038/s41592-019-0676-4.
52. Greger K, Swoger J, Stelzer EHK. Basic building units and properties of a fluorescence single plane illumination microscope. Rev Sci Instrum (2007) 78(2):023705. doi:10.1063/1.2428277.
53. Keller PJ, Schmidt AD, Wittbrodt J, Stelzer EHK. Reconstruction of zebrafish early embryonic development by scanned light sheet microscopy. Science (2008) 322(5904):1065–9. doi:10.1126/science.1162493.
54. Huisken J, Swoger J, Del Bene F, Wittbrodt J, Stelzer EH. Optical sectioning deep inside live embryos by selective plane illumination microscopy. Science (2004) 305(5686):1007–9. doi:10.1126/science.1100035.
55. Wu Y, Ghitani A, Christensen R, Santella A, Du Z, Rondeau G, et al. Inverted selective plane illumination microscopy (iSPIM) enables coupled cell identity lineaging and neurodevelopmental imaging in Caenorhabditis elegans. Proc Natl Acad Sci USA (2011) 108(43):17708. doi:10.1073/pnas.1108494108.
56. McGorty R, Liu H, Kamiyama D, Dong Z, Guo S, Huang B. Open-top selective plane illumination microscope for conventionally mounted specimens. Optic Express (2015) 23(12):16142–53. doi:10.1364/OE.23.016142.
57. Theer P, Dragneva D, Knop M. πSPIM: high NA high resolution isotropic light-sheet imaging in cell culture dishes. Sci Rep (2016) 6(1):32880. doi:10.1038/srep32880.
58. Gebhardt JC, Suter DM, Roy R, Zhao ZW, Chapman AR, Basu S, et al. Single-molecule imaging of transcription factor binding to DNA in live mammalian cells. Nat Methods (2013) 10(5):421–6. doi:10.1038/nmeth.2411.
59. Zhao ZW, Roy R, Gebhardt JC, Suter DM, Chapman AR, Xie XS. Spatial organization of RNA polymerase II inside a mammalian cell nucleus revealed by reflected light-sheet superresolution microscopy. Proc Natl Acad Sci USA (2014) 111(2):681–6. doi:10.1073/pnas.1318496111.
60. Hu YS, Zhu Q, Elkins K, Tse K, Li Y, Fitzpatrick JAJ, et al. Light-sheet Bayesian microscopy enables deep-cell super-resolution imaging of heterochromatin in live human embryonic stem cells. Opt Nanoscopy (2013) 2(1):7. doi:10.1186/2192-2853-2-7.
61. Cella Zanacchi F, Lavagnino Z, Perrone Donnorso M, Del Bue A, Furia L, Faretta M, et al. Live-cell 3D super-resolution imaging in thick biological samples. Nat Methods (2011) 8(12):1047–9. doi:10.1038/nmeth.1744.
62. Chen BC, Legant WR, Wang K, Shao L, Milkie DE, Davidson MW, et al. Lattice light-sheet microscopy: imaging molecules to embryos at high spatiotemporal resolution. Science (2014) 346(6208):1257998. doi:10.1126/science.1257998.
63. Gao L, Shao L, Chen BC, Betzig E. 3D live fluorescence imaging of cellular dynamics using Bessel beam plane illumination microscopy. Nat Protoc (2014) 9(5):1083–101. doi:10.1038/nprot.2014.087.
64. Friedrich M, Gan Q, Ermolayev V, Harms GS. STED-SPIM: stimulated emission depletion improves sheet illumination microscopy resolution. Biophys J (2011) 100(8):L43–5. doi:10.1016/j.bpj.2010.12.3748.
65. Zong W, Zhao J, Chen X, Lin Y, Ren H, Zhang Y, et al. Large-field high-resolution two-photon digital scanned light-sheet microscopy. Cell Res (2015) 25(2):254–7. doi:10.1038/cr.2014.124.
66. Chen X, Zong W, Li R, Zeng Z, Zhao J, Xi P, et al. Two-photon light-sheet nanoscopy by fluorescence fluctuation correlation analysis. Nanoscale (2016) 8(19):9982. doi:10.1039/C6NR00324A.
67. Liu W, Toussaint KC, Okoro C, Zhu D, Chen Y, Kuang C, et al. Breaking the axial diffraction limit: a guide to axial super-resolution fluorescence microscopy. Laser Photon Rev (2018) 12(8):1700333. doi:10.1002/lpor.201700333.
68. Stelzer EHK, Lindek S. Fundamental reduction of the observation volume in far-field light microscopy by detection orthogonal to the illumination axis: confocal theta microscopy. Optic Commun (1994) 111(5-6):536–47. doi:10.1016/0030-4018(94)90533-9.
69. Stelzer EHK, Lindek S, Albrecht S, Pick R, Stricker R. A new tool for the observation of embryos and other large specimens: confocal theta fluorescence microscopy. J Microsc (1995) 179(1):1–10. doi:10.1111/j.1365-2818.1995.tb03608.x.
70. Bailey B, Farkas DL, Taylor DL, Lanni F. Enhancement of axial resolution in fluorescence microscopy by standing-wave excitation. Nature (1993) 366(6450):44–8. doi:10.1038/366044a0.
71. Mudry E, Le Moal E, Ferrand P, Chaumet PC, Sentenac A. Isotropic diffraction-limited focusing using a single objective lens. Phys Rev Lett (2010) 105(20):203903. doi:10.1103/PhysRevLett.105.203903.
72. Manton JD, Ströhl F, Fiolka R, Kaminski CF, Rees EJ. Concepts for structured illumination microscopy with extended axial resolution through mirrored illumination. Biomed Optic Express (2020) 11(4):2098–108. doi:10.1364/BOE.382398.
73. Yang X, Xie H, Alonas E, Liu Y, Chen X, Santangelo PJ, et al. Mirror-enhanced super-resolution microscopy. Light Sci Appl (2016) 5(6):e16134. doi:10.1038/lsa.2016.134.
74. Schnitzbauer J, McGorty R, Huang B. 4Pi fluorescence detection and 3D particle localization with a single objective. Optic Express (2013) 21(17):19701–8. doi:10.1364/OE.21.019701.
75. Galland R, Grenci G, Aravind A, Viasnoff V, Studer V, Sibarita J-B. 3D high- and super-resolution imaging using single-objective SPIM. Nat Methods (2015) 12(7):641–4. doi:10.1038/nmeth.3402.
76. Meddens MBM, Liu S, Finnegan PS, Edwards TL, James CD, Lidke KA. Single objective light-sheet microscopy for high-speed whole-cell 3D super-resolution. Biomed Optic Express (2016) 7(6):2219–36. doi:10.1364/BOE.7.002219.
77. Balzarotti F, Eilers Y, Gwosch KC, Gynna AH, Westphal V, Stefani FD, et al. Nanometer resolution imaging and tracking of fluorescent molecules with minimal photon fluxes. Science (2017) 355(6325):606–12. doi:10.1126/science.aak9913.
78. Gwosch KC, Pape JK, Balzarotti F, Hoess P, Ellenberg J, Ries J, et al. MINFLUX nanoscopy delivers 3D multicolor nanometer resolution in cells. Nat Methods (2020) 17(2):217–24. doi:10.1038/s41592-019-0688-0.
79.abberior-instruments. abberior-instruments.com (2018). Available from: https://www.abberior-instruments.com/products/minflux [Accessed October 30, 2020].
80. Xu K, Zhong G, Zhuang X. Actin, spectrin, and associated proteins form a periodic cytoskeletal structure in axons. Science (2013) 339(6118):452–6. doi:10.1126/science.1232251.
81. Zhanghao K, Chen X, Liu W, Li M, Liu Y, Wang Y, et al. Super-resolution imaging of fluorescent dipoles via polarized structured illumination microscopy. Nat Commun (2019) 10(1):4694. doi:10.1038/s41467-019-12681-w.
82. Ertürk A, Becker K, Jährling N, Mauch CP, Hojer CD, Egen JG, et al. Three-dimensional imaging of solvent-cleared organs using 3DISCO. Nat Protoc (2012) 7(11):1983–95. doi:10.1038/nprot.2012.119.
Keywords: three-dimensional imaging, dual lens, axial resolution, light-sheet illumination, super-resolution, fluorescence microscopy
Citation: Li X, Han Y, Liu W, Kuang C, Liu X and Hao X (2020) A Review on Dual-Lens Fluorescence Microscopy for Three-Dimensional Imaging. Front. Phys. 8:606217. doi: 10.3389/fphy.2020.606217
Received: 14 September 2020; Accepted: 05 November 2020;
Published: 07 December 2020.
Edited by:
Ming Lei, Xi’an Jiaotong University, ChinaReviewed by:
Xiangping Li, Jinan University, ChinaJianming Wen, Kennesaw State University, United States
Copyright © 2020 Li, Han, Liu, Kuang, Liu and Hao. This is an open-access article distributed under the terms of the Creative Commons Attribution License (CC BY). The use, distribution or reproduction in other forums is permitted, provided the original author(s) and the copyright owner(s) are credited and that the original publication in this journal is cited, in accordance with accepted academic practice. No use, distribution or reproduction is permitted which does not comply with these terms.
*Correspondence: Yubing Han, aGFueXViaW5nQHpqdS5lZHUuY24=; Xiang Hao, aGFveEB6anUuZWR1LmNu