 Hanrui Yang
 Yichang Guo1
 Shibo Xu
- 1School of Automation Engineering, Northeast Electric Power University, Jilin, China
- 2Department of Fiber Sensors, No. 16 Institution of Aerospace & Technology Corporation, Xi’an, China
The additional deformation of the quartz crystal under the vibration stress disturbance greatly affects the measurement accuracy of the fiber optic voltage sensor. In this paper, the influence of different vibration directions on quartz crystal deformation is analyzed by the finite element method based on the analysis and derivation of the system error mathematical model of the quasi-reciprocal reflected fiber optic voltage sensor. Furthermore, the effect of additional quartz crystal deformation on the output precision of the system is calculated. The results show that the vibration stress along the axial direction mainly causes the quartz crystal to deform in height, and the vibration stress along the radial direction mainly causes the quartz crystal to deform the circumference. Among them, the deformation of the crystal radial circumference is the main reason to influence the system output accuracy. In addition, the size and deformation parameters of the quartz crystal are related to the output error of the sensor system. This paper provides the parameter optimization and design guidance for improving the anti-mechanical vibration performance of the sensor head of the fiber optic voltage sensor and provides a theoretical basis for the suppression method of the system error.
Introduction
The voltage sensors play an extremely important role in fields of power measurement and relay protection. With the continuous improvement of voltage levels, traditional electromagnetic transformers have gradually revealed their drawbacks in terms of measurement range, insulation protection, and application range [1, 2]. The optical voltage sensor (OVS), with its outstanding advantages such as high safety performance, excellent insulation performance, no magnetic saturation, large dynamic range, and so on, is gradually replacing traditional voltage transformer [3, 4]. At present, OVS research mostly included the electro-optic crystal OVS based on the Pockels effect and the all-fiber OVS based on the converse piezoelectric effect [5–7]. Compared with the electro-optic crystal OVS based on the Pockels effect, the all-fiber OVS based on the converse piezoelectric effect has a simple optical system structure. It does not require optical lens system (lens, polarizer, analyzer, wave plate) and optical collimation. Optical fiber is used for signal transmission and detection. In addition to the quartz crystal, the system no longer needs other discrete optical components, which has advantages in improving the stability and reliability of the long-term operation of the system [8].
Asea Brown Boveri (ABB) company proposed a reflective fiber optic voltage sensor (RFOVS) by using the non-reciprocity principle of Faraday rotator [9]. In this structure, a compensation fiber of equal length is spliced at
In this paper, the non-reciprocal error mathematical model of RFOVS system was established. Then, the influence of deformation of quartz crystal under the vibration stress on the output performance of RFOVS system was analyzed. Furthermore, the influence of different quartz crystal physical parameters on the system output error was investigated and the quantitative relationship between the system output error and the physical parameters of the quartz crystal under vibration stress disturbance was obtained. This study provides a theoretical basis for the suppression method of vibration error of RFOVS system and has a certain guiding significance for the optimization of RFOVS sensor head. It also provides a reference for the complex environment application of OVS.
Sensor Configuration and Operation
The configuration of RFOVS based on the converse piezoelectric effect is shown in Figure 1 [9]. The light wave from an amplified spontaneous emission (ASE, center wavelength
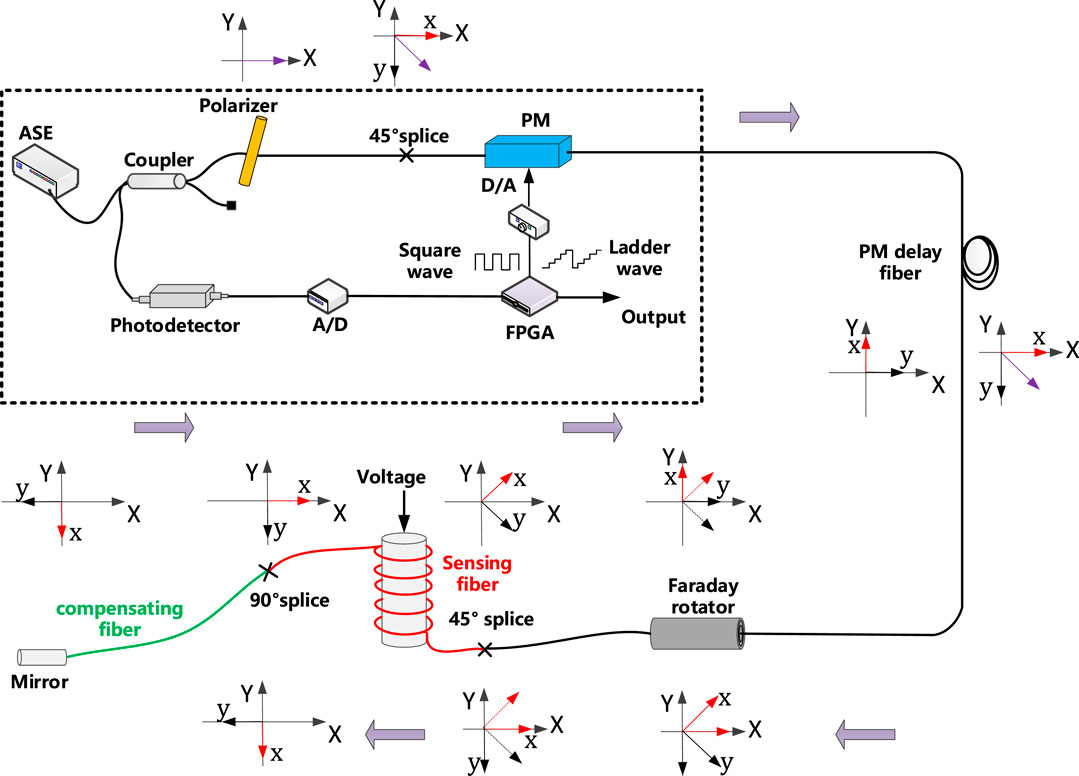
FIGURE 1. Reflective fiber optic voltage sensor configuration.
Quartz crystal is the core component of the sensor unit. It generates elastic deformation due to the converse piezoelectric effect under the electric field, which results in the length change and refractive index change of the sensing fiber wound on it. Therefore, the two orthogonal linear polarization modes transmitted along the fast and slow axis of the sensing fiber produce a phase difference related to the voltage. The voltage to be measured can be obtained by detecting the phase difference.
The phase difference caused by the change in length (
where,
Firstly, the variation of fiber length is the main reason for the phase difference of light wave. The optical fiber is evenly and tightly wound on the quartz crystal. The change in the length of the optical fiber directly reflects the deformation of the quartz crystal [8]. The relationship between deformation of quartz crystal and the voltage to be measured is given by Eq. 2:
where,
Secondly, the phase difference caused by the elastic optical effect of the optical fiber [18] is expressed by the following formula:
where
Combined with formulas 1–3, the phase difference caused by the converse piezoelectric effect of quartz crystal can be deduced:
It can be seen from the formula 4 that there is a linear relationship between the voltage to be measured and the phase difference. The phase difference depends on the voltage to be measured, the refractive index of optical fiber, the radius and height of quartz crystal and the number of winding turns. However, in practical applications, quartz crystal is deformed not only by the converse piezoelectric effect, but also by the vibration stress. The deformation of quartz crystal due to vibration stress is perceived by the optic fiber wound on quartz crystal, which affects the measurement accuracy of RFOVS. Therefore, it is necessary to analyze the influence of the additional deformation of the quartz crystal caused by the vibration stress on the output accuracy of the system.
Theoretical Modeling and Simulation
Mathematical Modeling of the System
To model the RFOVS, we apply Jones matrix [19, 20] analysis to the system of Figure 1. In this paper, we make the following assumptions. (1) The amplitude extinction coefficient of the polarizer is
Sensing Fiber
where
Compensating Fiber
where,
If the impact of vibration stress on the quartz crystal is not considered, then
where,
If the influence of vibration stress on the quartz crystal is considered, then
It can be seen from formula 10 that the main source of the error is the variation of fiber length. Since the deformation of each point of the quartz crystal is different, it is necessary to calculate the length change of one turn of the fiber through the method of integration. Therefore, the error phase caused by vibration stress is given by the following formula:
where,
By combining Eqs 7 and 9, the system output error expression can be obtained:
It can be seen from formula 9 that the fiber length change caused by vibration stress of quartz crystal and the fiber length change caused by converse piezoelectric effect of quartz crystal are mixed together, and the system cannot distinguish this error phase. In practical application, the output accuracy and stability of RFOVS system is affected by external vibration disturbance. Therefore, it is significant to analyze the error phase shifts caused by the vibration stress on the output accuracy of the system.
Vibration characteristics of the quartz crystal
The geometrical model of quartz crystal was established by finite element method. The geometry and mesh division of the quartz crystal are shown in Figure 2. Quartz crystal simulation parameters are given in Table 1 [21]. As shown in Figure 3, it is the calculation result of the first 4 characteristic frequency of quartz crystal. The first 4 characteristic frequencies are 3302.2, 3302.5, 11166.8, 15648.8 Hz, respectively. Characteristic frequency means that when an object vibrates freely, its displacement changes with time according to the sine or cosine law. The vibration frequency has nothing to do with the initial conditions, but only related to the inherent characteristics of the system (such as quality, shape, material, etc.) The study of the characteristic frequency helps ensure product stability. It can be seen from the results that the first-order characteristic frequency of quartz crystal is very high, which is advantageous to avoid the influence of low-order resonance.
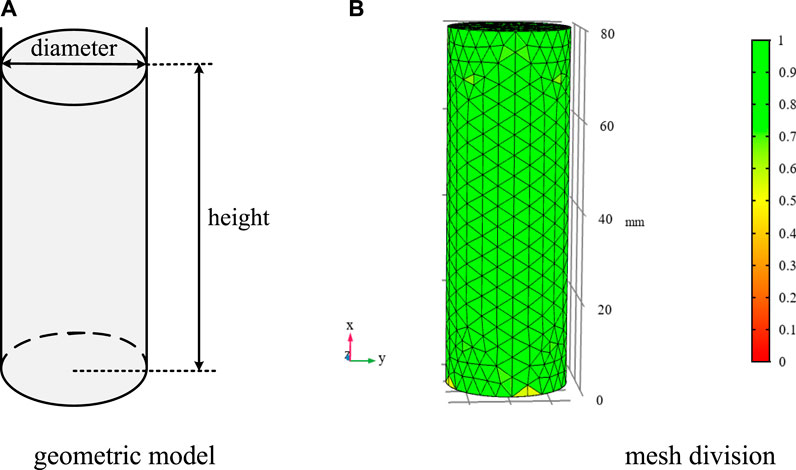
FIGURE 2. The geometry and mesh division of the quartz crystal. (A) Geometric model. (B) Mesh division.
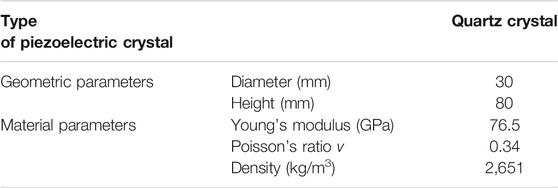
TABLE 1. Relevant parameter settings used in simulations.
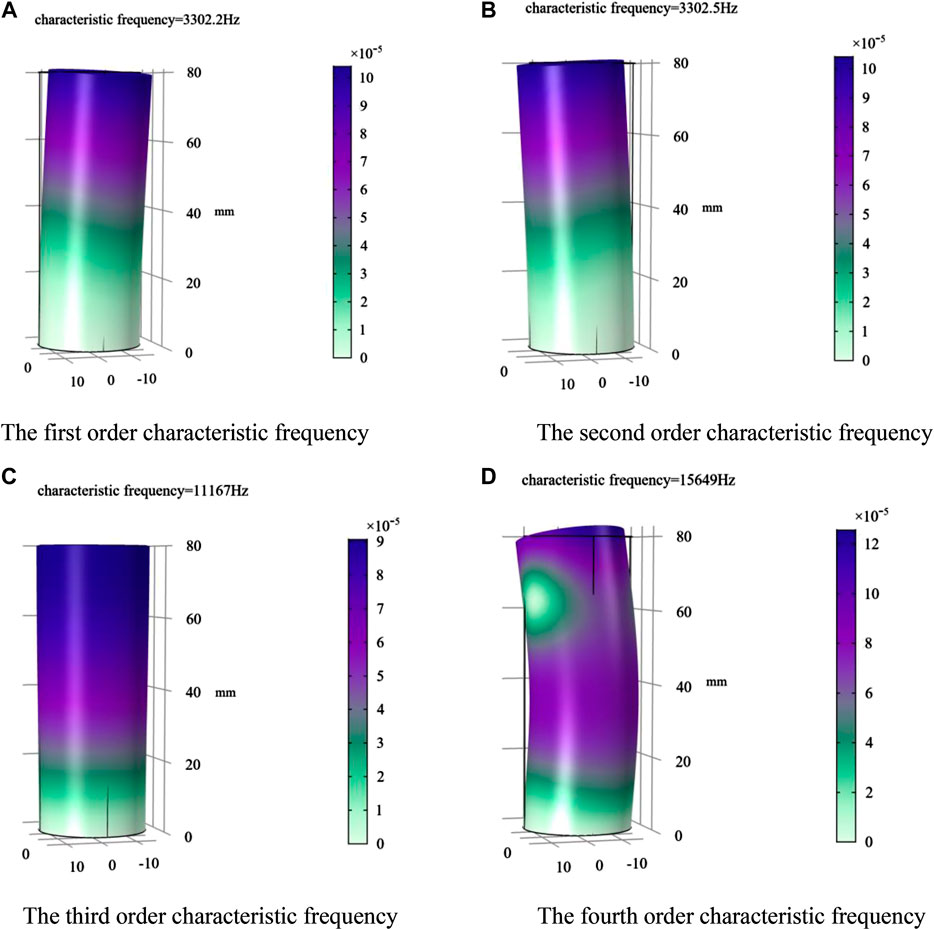
FIGURE 3. The characteristic frequency of quartz crystal. (A) The first order characteristic frequency. (B) The second order characteristic frequency. (C) The third order characteristic frequency. (D) The fourth order characteristic frequency.
When the external vibration frequency is near the characteristic frequency, the quartz crystal is most likely to resonate, and the deformation is the largest, which has the most serious impact on the accuracy of the RFOVS system. Therefore, the analysis and control of the first 4 order frequencies are particularly important. As mentioned in previous paper [22, 23], in the practical application process of the RFOVS, the external vibration frequency is difficult to reach 3,000 Hz. Therefore, the quartz crystal is not easily affected by resonance. Based on the practical application of the RFOVS, this paper firstly applies sinusoidal excitation to quartz crystal in different directions to analyze its deformation law. Then the influence of vibration factors on the output accuracy of the system was analyzed. The vibration load curve is shown in Figure 4.
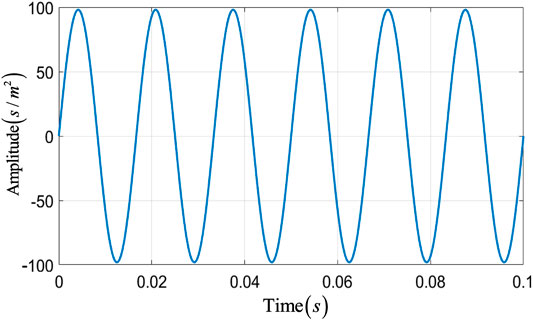
FIGURE 4. Vibration load curve (10 g 60 Hz).
First, sinusoidal loading was applied to the x direction of the quartz crystal. The quartz crystal is fixed at one (bottom). The deformation result is shown in Figure 5. It can be seen from the simulation result that the deformation component in the x direction (
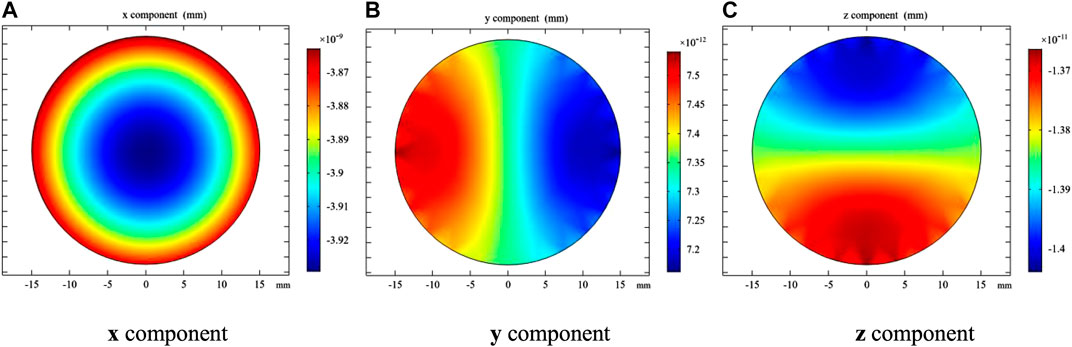
FIGURE 5. The height deformation of a quartz crystal. (A) x component. (B) y component. (C) z component.
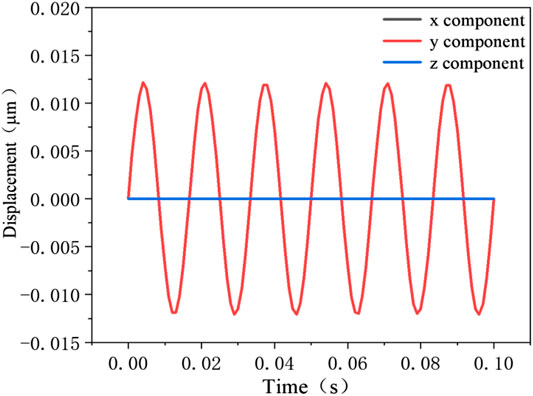
FIGURE 6. The circumference deformation of quartz crystal.
Results and Discussion
The Relationship Between Vibration Amplitude and System Output Error
In the previous part, the influence of vibration load in different directions on quartz crystal deformation has been clarified. Firstly, the analysis of system vibration error under different amplitudes in the x direction was carried out. Quartz crystal height changes mainly due to x axis vibration. Therefore, the system output error can be calculated by combining Eqs 4 and 12. In this simulation calculation, quartz crystal height is 80 mm, radius is 15 mm, acceleration range is 2–10 g, frequency is 60 Hz and the voltage to be measured is 110 kV. As shown in Figure 7A, the vibration amplitude is almost linearly related to the system output error. However, because the quartz crystal height variation is very small, the quartz crystal height variation caused by vibration stress along the x axis has little influence on the system output accuracy. The system output can meet the accuracy level of 0.2 S. On the other hand, sinusoidal vibration load was applied along the y axis, and the system output error is shown in Figure 7B. It can be seen from the result that the vibration amplitude has a great influence on the output error of the system. In addition, compared with the height variation of quartz crystal, the vibration along the y axis mainly caused the circumference change of quartz crystal, which results in the length change of the fibre wound on quartz crystal. Therefore, the vibration has a serious impact on the output accuracy of the system. The system failed to meet the accuracy requirements of 0.2 S.
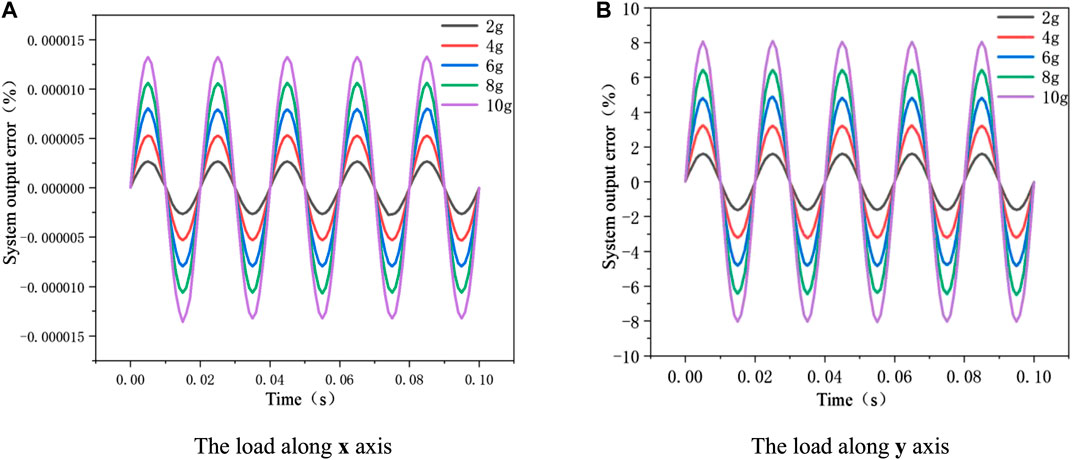
FIGURE 7. The relationship between vibration amplitude and system output error. The relationship between quartz crystal size and system output error. (A) The load along x axis. (B) The load along y axis.
In the last part, the effects of different vibration amplitudes along the x axis and the y axis on the system output were analyzed, respectively. The results show that the system output error has a linear relationship with the vibration amplitude. In addition, compared with the quartz crystal height variation, the circumference variation is the main factor caused the system output error. Therefore, in this part, the law between different quartz crystal size (radius and height) and system output error under certain amplitude was investigated. In this simulation calculation, quartz crystal height range of 70–100 mm, step length of 10 mm, radius range of 10–25 mm, step length of 5 mm, acceleration of 10 g, frequency of 60 Hz, and voltage to be measured of 110 kV are selected. The system output error of quartz crystal vibrating along x axis and y axis with different height and radius are studied, respectively.
The calculation results are shown in Figure 8. As can be seen from Figure 8A, the system output error caused by the height change of quartz crystal is still very small, and the difference of output error under different heights is also very small. However, it can be seen from Figure 8B that the radial circumference change of quartz crystal still has a great influence on the system output error. Moreover, different quartz crystal height also has a certain influence on the system output error. The higher the height, the more serious the system output error. This is mainly because increasing the height of quartz crystal reduced its stability under vibration force, resulting in larger output error of the system.
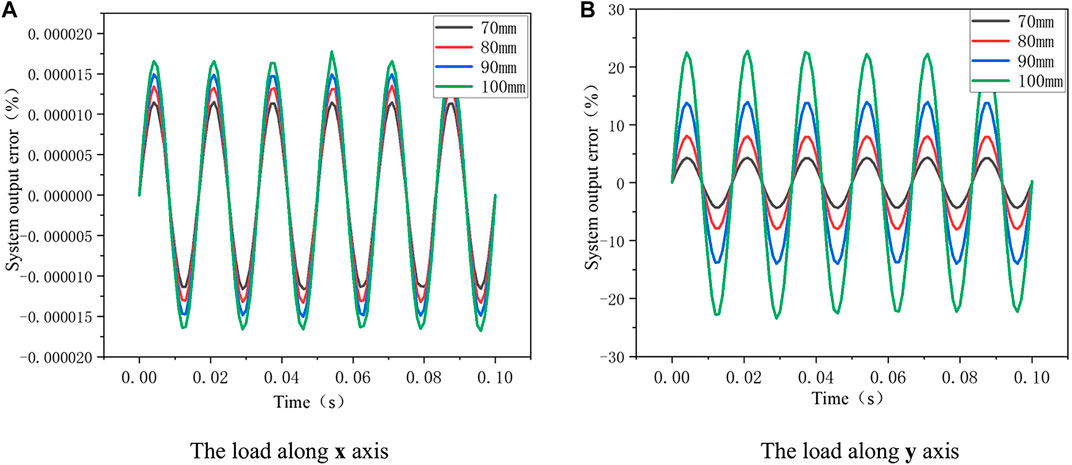
FIGURE 8. The relationship between different quartz crystal height and system Output error. (A) The load along x axis. (B) The load along y axis.
In the previous part, the results show that the quartz crystal height change has little influence on the system output error. So only the crystal height change is calculated. As can be seen from Figure 9A, the height variation is very small. The maximum height variation only around 0.0125 μm, and different quartz crystal radius have little effect on the height variation. It is known from the previous analysis that the main reason caused the system output error is the circumference change of quartz crystal. It can be seen from Figure 9B that the different quartz crystal radius has a significant impact on the system output error. The larger the crystal radius is, the smaller the output error of the system will be. This is mainly because increasing the radius can improve the stability of quartz crystal under vibration force and reduce the deformation of crystal circumference. This result is consistent with the previous analysis about quartz crystal height. It also provides guidance and basis for the optimization of sensor head.
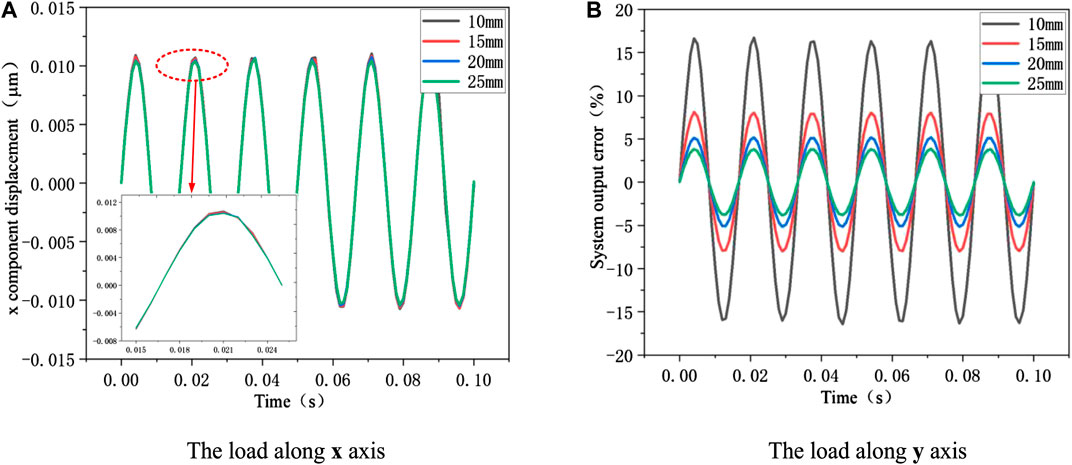
FIGURE 9. The relationship between different quartz crystal radius and system Output error. (A) The load along x axis. (B) The load along y axis.
Conclusion
In summary, the aim of the present research was to explore the relationship of output error versus vibration stress. The most obvious findings to emerge from this study are that the model of output error was established, and the relationship between system output error and vibration stress was investigated, respectively. This study indicates that the system output error is mainly caused by the deformation of radial circumference of quartz crystal. Furthermore, the relationship between the system output error and vibration stress was linear. Meanwhile, different quartz crystal size also has a certain effect on the system output error. Reasonable selection of quartz crystal radius and height can suppress the output error of the RFOVS system. The finding of this investigation complements those of earlier studies and provides a theoretical basis for error suppression. More broadly, further research will need to be done to explore error compensation algorithm to achieve the purpose of improving the accuracy of the system.
Data Availability Statement
The raw data supporting the conclusions of this article will be made available by the authors, without undue reservation.
Author Contributions
HY: Conceptualization, Methodology, Resources, Writing-Review & Editing, Supervision, Project administration and Funding acquisition. YG: Conceptualization, Software, Formal analysis, Data Curation, Writing-Original Draft and Visualization. CD, SX, LX and WH: Software and Validation. SJ: Writing-Review & Editing, Supervision and Investigation. All authors participated in data evaluation, discussion, and interpretation.
Funding
This work was supported by the Youth Science Found Project of National Natural Science Foundation of China (NSFC) (61703090) and the Qian Xuesen Youth Innovation Fund.
Conflict of Interest
WH was employed by the company No. 16 Institution of Aerospace & Technology Corporation. The remaining authors declare that the research was conducted in the absence of any commercial or financial relationships that could be construed as a potential conflict of interest.
References
1 Klaus B, Andreas F, Georg MM, Lin Y, Miklos L. Fiber optic current and voltage sensors for electric power transmission systems. Fiber Optic Sensors Appl XV (2018) 10654:1065402. doi:10.1117/12.2303945
2 Sadik K, George GK. Experimental comparison of conventional and optical VTs, and circuit model for optical VT. IEEE Trans Power Deliv (2011) 26:1571–8. doi:10.1109/TPWRD.2010.2100831
3 Marceli NG, Marcelo MW. A temperature-independent optical voltage transformer based on FBG-PZT for 13.8 kV distribution lines. Measurement (2019) 147:106891. doi:10.1016/j.measurement.2019.106891
4 Li CS. Optical voltage sensors: principle, problem and research proposal. Opt Commun, Opt Fiber Sens, Opt Mem Big Data Storage (2016) 10158:101581N. doi:10.1117/12.2248375
5 Klaus B, Jadran K, Pascal P. Fiber optic voltage sensor for 420 kV electric. Opt Eng (2000) 39:3060–7. doi:10.1117/1.1315023
6. Feng P, Xia X, Yan X, Ren SY. An optical AC voltage sensor based on the transverse Pockels effect. Sensors (2011) 11:6593–602. doi:10.3390/s110706593
7. Akiko K, Kunihiko H. Directly high-voltage measuring system based on Pockels effect. IEEE Trans Power Deliv (2013) 28:1306–13. doi:10.1109/TPWRD.2013.2250315
8 Bohnert KM, Nehring J. Fiber-optic sensing of electric field components. Appl Optic (1988) 27:4814–8. doi:10.1364/AO.27.004814
9 Bohnert K, Wildermuth S, Frank A, Brändle H. Fiber-optic voltage sensor using fiber gyro technology. Proc Eng (2010) 5:1091–4. doi:10.1016/j.proeng.2010.09.300
10 Yang HR, Guo YC, Jiao SX, Hong W, Xu SB, Zhang YJ. Analysis and suppression of nonreciprocal phase shift error of the optical voltage sensor based on the converse piezoelectric effect. Opt Fiber Technol (2020) 55:102142. doi:10.1016/j.yofte.2020.102142
11 Alex D, Rodrigo MB, Anderson WS, Elnatan CF, José ASD. A temperature-independent interrogation technique for FBG sensors using monolithic multilayer piezoelectric actuators. IEEE Trans Instrument Measur (2016) 65:2476–84. doi:10.1109/TIM.2016.2594021
12 Xiao X, Xu Y, Dong Z. Thermodynamic modeling and analysis of an optical electric-field sensor. Sensors (2015) 15:7125–35. doi:10.3390/s150407125
13. Olivier S, Sergio VM, Joris P, Klaus B. Signal processing for electro-optic voltage sensor. Sensors, IEEE (2013). doi:10.1109/ICSENS.2013.6688615
14 Deng W, Li H, Zhang C, Wang P. Optimization of detection accuracy of closed-loop optical voltage sensors based on Pockels effect. Sensors (2017) 17:1723. doi:10.3390/s17081723
15 Li H, Cui LY, Lin ZL, Li LJ, Wang R, Zhang CX. Signal detection for optical AC and DC voltage sensors based on Pockels effect. IEEE Sensor J (2013) 13:2245–52. doi:10.1109/JSEN.2013.2249581
16 Li L, Zhang W, Li H, Pan R (2013). Linear birefringence-free optical voltage sensor based on dual-crystal structure. Appl Optic. 52:8706–13. doi:10.1364/AO.52.008706
17 Müller GM, Quan W, Lenner M, Yang L, Frank A, Bohnert K (2016). Fiber-optic current sensor with self-compensation of source wavelength changes. Opt Lett 41:2867–70. doi:10.1364/OL.41.002867
18 Ulrich R, Rashleigh SC, Eickhoff W (1980). Bending-induced birefringence in single-mode fibers. Opt Lett 5:273–5. doi:10.1364/OL.5.000273
19 Short SX, De Arruda JU, Tselikov AA, Blake JN. Elimination of birefringence induced scale factor errors in the in-line sagnac interferometer current sensor. J Lightwave Technol (1998) 16:1844–50. doi:10.1109/50.721071
20 Short SX, De Arruda JU, Tselikov AA, Blake JN. Imperfect quarter-waveplate compensation in sagnac interferometer-type current sensors. J Lightwave Technol (1998) 16:1212–9. doi:10.1109/50.701399
21 Kagawa Y, Yamabuchi T. Finite element simulation of a composite piezoelectric ultrasonic transduce. IEEE Trans Son Ultrason (1979) 26:81–8. doi:10.1109/T-SU.1979.31071
22 Bohnert K, Gabus P, Nehring J, Brändle H. Temperature and vibration insensitive fiber-optic current sensor. J Lightwave Technol (2002) 20:267–76. doi:10.1109/50.983241
Keywords: quartz crystal, fiber optic voltage sensor, vibration performance, converse piezoelectric effect, error analysis
Citation: Yang H, Guo Y, Xu S, Xia L, Hong W, Dong C and Jiao S (2020) Vibration Characteristics of Quartz Crystal and Analysis of System Error in Fiber Optic Voltage Sensor. Front. Phys. 8:607724. doi: 10.3389/fphy.2020.607724
Received: 18 September 2020; Accepted: 16 November 2020;
Published: 16 December 2020.
Edited by:
Ya-nan Zhang, Northeastern University, ChinaReviewed by:
Xuyou Li, Harbin Engineering University, ChinaKaiming Zhou, Aston University, United Kingdom
Lihui Wang, China Conservatory, China
Copyright © 2020 Yang, Guo, Xu, Xia, Hong, Dong and Jiao. This is an open-access article distributed under the terms of the Creative Commons Attribution License (CC BY). The use, distribution or reproduction in other forums is permitted, provided the original author(s) and the copyright owner(s) are credited and that the original publication in this journal is cited, in accordance with accepted academic practice. No use, distribution or reproduction is permitted which does not comply with these terms.
*Correspondence: Shengxi Jiao, MjAxNDI1NDdAbmVlcHUuZWR1LmNu