 Rongli Guo
 Itay Barnea
 Natan T. Shaked
- Department of Biomedical Engineering, Faculty of Engineering, Tel Aviv University, Tel Aviv, Israel
We present a wide-field interferometric imaging module for biomedical and metrological measurements, employing shearing interferometry with constant off-axis angle (SICA) that can work, for the first time, with a low-coherence light source. In the SICA module, the shearing distance between the interfering beams can be fully controlled without a direct relation with the off-axis angle. In contrast to our previous SICA module, here we use a low-coherence illumination source, providing quantitative phase profiles with significantly lower spatial coherent noise. Although a low-coherence source is used, we obtain off-axis interference on the entire camera sensor, where the optical path difference between the two beams is compensated by using a glass window positioned in the confocal plane. This highly stable, common-path, low-coherence, single-shot interferometric module can be used as an add-on unit to a conventional bright-field microscope illuminated by a low-coherence source. We demonstrate the advantages of using the module by quantitative phase imaging of a polymer bead, fluctuations in a human white blood cell, and dynamics of human sperm cells.
Introduction
Wide-field interferometric phase microscopy (IPM), also called digital holographic microscopy, is a method that can render quantitative phase images of micro-scale samples by recording their complex fields [1–6]. Since it does not require exogenous labeling or special sample preparation for imaging transparent biological samples, IPM has shown to be a potent tool for studying cell biology [7–11], pathophysiology of cells [12–14] and in some other biomedical applications. [15, 16].
Off-axis IPM can reconstruct a quantitative phase image from a single interferogram or hologram, which is captured in a single shot. Thus, it is capable of monitoring dynamic changes of biological cells at the same frame rate of the digital camera used. There are different optical systems to implement IPM, and all of them generate a reference beam that does not contain the sample spatial modulation, to be interfere with the sample beam. The conventional Mach–Zehnder and Michelson interferometers split the beam at the exit of the laser to sample and reference beams, whereas self-referencing interferometers [17–33] typically create the reference beam externally, at the exit of the imaging system. Self-referencing interferometry includes, for example, τ interferometry [23, 33], flipping interferometry [24, 25], diffraction phase microscopy [27], shearing interferometry [28, 29], the quantitative phase imaging unit [30], quadriwave shearing interferometry [31]. All of these interferometers have a nearly common-path interferometric geometry, and hence inherently have a higher temporal phase sensitivity than the conventional Michelson and Mach–Zehnder interferometers [23–33]. In order to decrease the amount of spatial coherent noise and parasitic interferences, low-coherence light sources can be used, which requires meticulous beam-path matching to obtain interference on the camera, so that the path difference between the sample and reference beams is smaller than the coherence length of the source. However, across the off-axis hologram obtained with a low-coherence source, the fringe visibility might be low in certain regions on the camera, decreasing the signal to noise ratio in the final quantitative phase profile, and thus limiting the interferometric imaging field of view. To overcome this limitation, white-light diffraction phase microscopy [34, 35] can be used. However, to generate a clean reference beam, this technique requires performing low-pass spatial filtering by a pinhole, which requires a precise alignment. In addition, white-light diffraction phase microscopy also demonstrated impairing halo effect [35].
Shearing interferometry, on the other hand, can create the reference beam externally by simply assuming the sample is sparse enough. Then, we can interfere two sheared copies of the same beam, and hopefully there is no overlap between sample details. Biological cells from the sheared beam appear as ghost images with negative phase values, and thus should be avoided. However, since in regular shearing interferometry the off-axis angle and the shearing distance between the beams are coupled, it is hard to avoid these ghost images. To solve this problem, we have lately introduced the shearing interferometry with constant off axis angle (SICA) module, as a simple add-on imaging unit to an existing imaging system illuminated with a highly coherent light [36]. The module employs the principle of shearing interferometry by generating two laterally shifted sample beams. The magnified image at the exit of the imaging system is split using a diffracting grating. In contrast to regular shearing interferometers, in SICA we can fully control the shearing distance by the axial position of the grating, whereas the off-axis angle is determined by the grating period, independently. This way, we can easily avoid overlaps with ghost images. Due to its off-axis nature and common-path configuration, the SICA module has benefits of real-time measurement capability and high temporal stability. However, it still suffers from spatial coherent noise due to the fact that it requires highly coherent illumination, to allow high-visibility off-axis interference on the entire field of view.
In the current paper, we introduce a low-coherence SICA (LC-SICA) module that allows single-shot quantitative phase imaging with both high spatial and temporal phase sensitivities, with high-visibility off-axis interference over the whole field of view. The new setup is an important modification to the previous SICA module, but at the same time, it inherited all its advantages i.e., easy alignment, simplicity, and an off-axis interference angle that can be controlled independently of the shearing distance.
Experimental Setup
Figure 1 shows an inverted microscope, where the proposed LC-SICA module is connected to its output, and is indicated by the dashed rectangle. The module consists of diffraction grating G, two achromatic lenses L1 and L2, and optical path difference (OPD) compensator C (a glass plate). The two lenses are positioned in a 4f imaging configuration. The module is designed as an add-on unit, and is located at the output image from a conventional microscope. To generate two laterally shifted sample beams, grating G is placed behind IP at an axial distance z. The diffracted beams are Fourier transformed to get their spatial spectra in the back focal plane of lens L1. The zeroth and first diffraction orders are selected by mask M at the Fourier plane, whereas the other diffraction orders are blocked. The two orders are then projected by lens L2, so that the two laterally shifted sample beams overlap on the sensor plane at the selected off-axis angle, which is controlled by the grating period d, independently of the shearing distance, controlled by the grating axial location z [36].
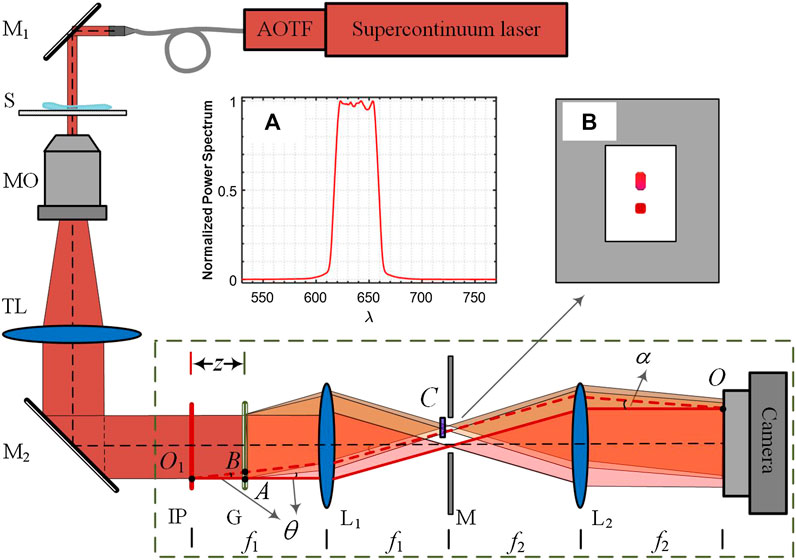
FIGURE 1. An inverted microscope with the LC-SICA module (marked by dashed rectangle), connected to its output. M1, M2, mirrors; S, sample; MO, microscope objective; TL, tube lens; IP, image plane; G, diffraction grating (100 lines/mm); L1, L2, lenses with focal lengths of f1 = 150 mm and f2 = 300 mm; z, distance of IP to G; M, mask that selects only two diffraction orders; C, compensating plate; α, interference angle; θ, diffraction angle of the grating. Inset (A) normalized power spectrum of the light source with central wavelength of 638 nm and bandwidth of 44 nm. Inset (B) schematic of the filtered Fourier spectrum distribution in the focal plane.
In contrast to the previous design, presented in Ref. [36], here we use a low-coherence illumination and an OPD compensator. The low-coherence illumination is implemented by using a supercontinuum laser (SuperK EXTREME, NKT), followed by a computer-controlled acousto-optical tunable filter (AOTF, SuperK SELECT, NKT). The emitted light is at a central wavelength of 638 nm and a full-width-at-half-maximum bandwidth of 44 nm (as measured by a spectrometer, USB4000-VISNIR, Ocean Optics). As the spectrum has a nearly rectangle shape, the coherence length is calculated by lc = λ2/Δλ = 9.2 μm. For ensuring a full-field interference, the OPD between two beams should be smaller than the coherence length of the source, across the entire camera sensor. Let us consider the OPD at point O on the image plane, where the two beams meet at an angle α. The conjugate point of point O at IP is point O1; hence, the two beams, denoted by solid red line (zeroth-order beam) and dashed red line (first-order beam), have the same optical path length. However, the two interfering beams are originally emitted from points A and B, where the two red lines intercept with grating G. Hence, the OPD at point O is determined by:
where θ = λ/d is the diffraction angle of the first-order beam, which is determined by the grating period d and the wavelength λ. Usually, an OPD compensator should be inserted to minimize the mismatch of optical paths between two beams. In our experiment, as an OPD compensator we used a glass plate, placed in the first order beam path, at the Fourier plane. Although the interference angle is wavelength-dependent: α = λf1/f2d, the period of the fringes at different wavelengths is independent of wavelength and equals f2d/f1. Thus, it is an achromatic interferometer.
In our experiment, as shown in Figure 1, the light is steered into an inverted microscope (Olympus, IX83) to illuminate the sample S. The beam transmitted through the sample is magnified by microscope objective MO and projected by tube lens TL on IP. The intermediate image is further magnified by a factor of 2 in the module as f2/f1 = 2, and finally recorded by a CMOS camera (Thorlabs, DCC1545M). The period of the grating is d = 10 μm, which is smaller than the microscopic diffraction spot magnified on IP. By choosing the grating axial distance z, the shearing distance between two beams can be tuned so that no overlap with ghost images occurs. The thickness of the compensating glass plate is dependent on distance z. We used a cover slip (n = 1.52) with thickness of h = 0.17-mm as the OPD compensator. The OPD induced by the coverslip is (n − 1) × h = 88.4 μm. Substituting this value into Eq. 1 results in a grating optimal position of z = 43 mm. Note that working with a significantly wider spectral bandwidth results in OPDs that differ greatly, so that we cannot compensate for all of them using a constant thickness coverslip. Thus, realistically, LC-SICA is limited to using a spectral bandwidth of several tens of nanometers, which still allows a significant improvement in the spatial noise, compared with the coherent illumination scenario.
Results
First, experiments were carried out to demonstrate the speckle noise suppressing capability with the proposed LC-SICA module. We measured a 5-μm polymer bead with a 100× objective under highly coherent illumination (He–Ne laser) and under low-coherence illumination (as described above). The bead (n = 1.59) is immersed in oil (n = 1.52) and sandwiched between two cover slips. The shearing distance between the interfering beams is controlled by the axial distance of the diffraction grating, and is set to be large enough so that no overlap occurs with ghost images containing negative phase values. Therefore, the full quantitative phase profile of the sample is obtained, rather than its gradient in the shearing direction. The off-axis angle is determined by the diffraction grating period, affecting the fringe spatial frequency of the hologram obtained on the digital camera. This captured off-axis hologram is processed using the Fourier transform method [20]. This includes a digital Fourier transform, cropping one of the cross-correlation terms, and an inverse Fourier transform, resulting in the complex wavefront of the sample. Then, we apply a phase unwrapping algorithm on the angle argument of the complex wavefront to solve 2π ambiguities. Figures 2A,B show two holograms obtained under coherent illumination and low-coherence illumination, respectively, demonstrating that although the LC-SICA module uses a low-coherence source, there is no loss in the fringe visibility along the entire field of view in comparison to using high coherent illumination.
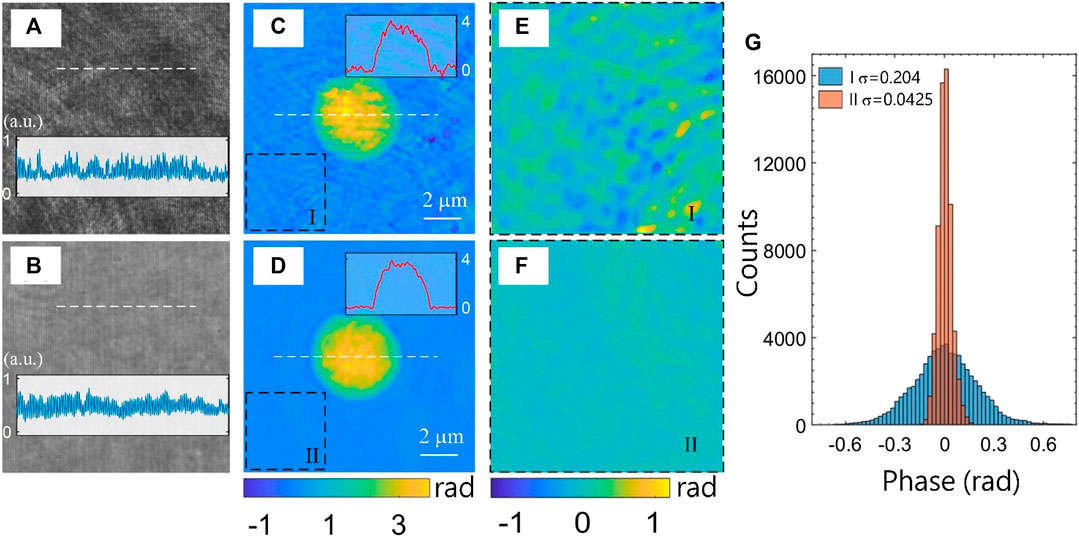
FIGURE 2. Comparing the SICA and LC-SICA modules by quantitative phase imaging of a polymer bead. (A, C) Hologram and quantitative phase map from the SICA module, with highly coherent illumination (He–Ne, 633 nm). (B, D) Hologram and quantitative phase map from the LC-SICA module, with low-coherence illumination (638 ± 22 nm). The same 5-μm polystyrene bead immersed in index-matching oil was imaged in both cases. The two background regions, marked as I and II in (C) and (D) at the same location, are magnified in (E) and (F), respectively. (G) Histogram of the phase values of the two background regions I and II, demonstrating a significantly lower spatial noise in the LC-SICA module in comparison to the regular SICA module. σ denotes spatial standard deviation of the quantitative phase values.
The resulting quantitative phase images are shown in Figures 2C,D, respectively. It can be seen that the phase profile in Figure 2C is much nosier, as speckle noise ripples and abrupt fluctuations are obvious over the whole field. In contrast, these spatial noises are significantly suppressed when low-coherence illumination is used, as shown in Figure 2D. To further compare the spatial phase noises in both images, the two little marked regions I and II are enlarged, and shown in Figures 2E,F, respectively. This background phase profile is almost uniform in Figure 2F, whereas it has noticeable undulation in Figure 2E, even in the base-plane background region, due to the use of highly coherent illumination. To quantify the spatial phase noise levels, the phase distribution histograms of regions I and II are shown in Figure 2G. The standard deviation of the phase values in these regions are 0.204 and 0.0425 rad, respectively, which means that the phase noise level in the LC-SICA module is only approximatively a fifth of that of the SICA module. Under coherent illumination, the noise may come from scattering of dust particles or scratches on the optics surfaces, from parasitic fringes due to multiple reflections between coverslips, as well as from inherent laser noise. However, such noise can be greatly reduced when using low-coherence illumination, so that the proposed LC-SICA module can render quantitative phase images with higher spatial phase sensitivity.
Second, to show our high temporal stability and real-time imaging capability, we acquired 150 holograms over 10 s in presence of no samples, representing the case of a stationary sample. The holograms were processed to get coinciding phase profiles by subtraction the phase profile obtained from a pre-recorded hologram. The average standard deviation of 10,000 randomly selected pixels across the stack of these phase profiles, representing the temporal stability of the system, is 8.3 mrad, which indicates the high temporal stability of the setup.
We then measured the fluctuations of a human white blood cell. Human blood was provided by the Israeli blood bank (Magen David Adom) after obtaining an ethical approval from Tel Aviv University’s institutional review board. Peripheral blood mononuclear cells (PBMCs), a type of white blood cells, were isolated from the whole blood using Ficoll-Paque Premium isolation kit (GE17-5442-02 Sigma-Aldrich), according to the manufacturer instructions. After centrifugation, PBMCs were collected from the buffy coat, and cleaned by centrifugation at 1250 RPM for 5 min in phosphate buffered saline (PBS) solutions supplemented with 1 mM EDTA. The supernatant was discarded, and the pellet was resuspended in 1 ml PBS-EDTA. A live PBMC was imaged for 10 s at a frame rate of 15 Hz. Figure 3A presents the quantitative phase image of the cell at t = 0. Figure 3B shows the temporal standard deviations of 150 phase images, which indicates the fluctuations over the cell. We also examined the phase fluctuations at the three marked points during this period, and the results are presented in Figure 3C. As indicated in Figures 3A,B, the three selected points are at the background, at the border of the cell, and at the interior region. The phase values of the point at the border has the largest fluctuations and the standard deviation was calculated to be 78.5 mrad. The point at interior area of the cell exhibits mild fluctuations and has a standard deviation value of 43.7 mrad. The background point has flat phase values with standard deviation of 8.9 mrad. This low background standard deviation value is due to using a common-path configuration in our add-on module, and is comparable with that of a white-light illuminated quantitative phase imaging unit [37]. However, the later unit is not suitable for measuring the highly dynamic phenomena, as it implements temporal phase-shifting interferometry to record multiple holograms for obtaining a single quantitative phase image.
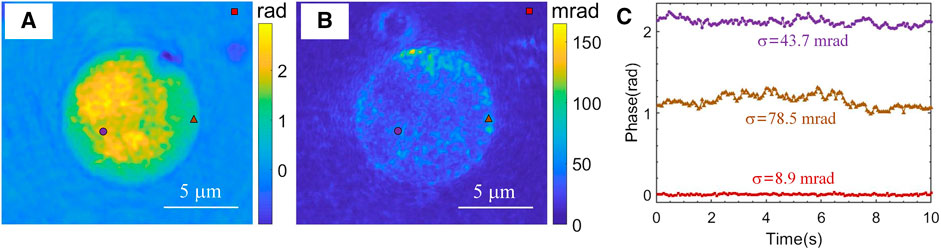
FIGURE 3. Dynamic quantitative phase imaging of a human white blood cell at frame rate of 15 Hz, as acquired with the LC-SICA module. (A) Quantitative phase profile. (B) Quantitative phase temporal standard deviation profile over 150 frames (fluctuation map). (C) Quantitative phase values at the three different points marked in (B). σ denotes the temporal standard deviations of the quantitative phase values at those points.
At last, to demonstrate the flexibility of controlling the shearing distance without affecting the off-axis angle, to avoid ghost images in dynamic samples, we measured swimming sperm cells at two different shearing distances. Here, a 60× objective (Plan, N.A. 1.3, Olympus) was used for imaging. After obtaining an ethical approval from Tel Aviv University’s institutional review board, the semen sample from a human donor was left in room temperature for 30 min to liquefy, and then the spermatozoa were separated through density gradient-based centrifugation by using a PureCeption bilayer kit (ART-2024 ORIGIO, Malov, Denmark), according to the manufacturer instructions. After centrifugation, the pellet was placed in a new tube and washed with HTF medium (#90125, Irvine Scientific, CA, United States). In the first case, 5 µl of the cell solution was placed between two cover slips. A small shearing of 5.5 mm is employed along the horizontal direction, as calculated with formula λzf2/f1d [36], where the grating is placed at z = 43 mm. Figure 4A shows one of the off-axis holograms from the dynamic sequence, and Figure 4B shows the reconstructed phase image (see full dynamic swimming in Supplementary Video S1). From Figure 4B, two inverse-contrast quantitative phase images of the same cell can be observed, due to the small shearing distance, which are marked by two arrows. As the sperm cells swim freely, the positive phase image of one cell may overlap with a negative phase image of another cell, as shown in Supplementary Video S1. In this case, the cells cannot be correctly reconstructed. To solve this, a large shearing can be applied, while a blank region containing no sample, located outside the field of view, is used to generate a reference beam. In this second case, the grating G was placed at a distance of z = 130 mm. Thus, the shearing distance was 16.5 mm, three times of that of the previous one and much longer than the lateral dimension of the sensor (6.6 mm). Three pieces of stacked coverslips were used as an OPD compensator. Figure 4C shows one hologram from this sequence, and Figure 4D shows the reconstructed phase image. In Figure 4D, there are only positive phase images over the entire field of view, and the dynamic swimming of the cells can be precisely monitored. It should be noted that although the shearing distance was changed in both cases, the off-axis angle was constant, and thus the interference fringe period was constant as well, as shown in the enlarged insets in Figures 4A, C. The adjustable shearing distance with a constant interference angle between two beams is an obvious advantage of the LC-SICA module, which benefits from convenience in choosing a clean part of the beam to act as the reference beam, according to the density of samples in a shearing interferometric setup. While in most other shearing interferometry setups [24–26, 28–30], the shearing distance is fixed, i.e., they can only image scenarios in which either the sample are sparse, or half of the field of view need to be empty [24–26], the proposed LC-SICA module can fully control the shearing distance based on the sparsity of the sample. This is even more beneficial when imaging dynamic movements of cells, as the samples may move randomly around the whole field of view, or the concentrations of cells may change over time.
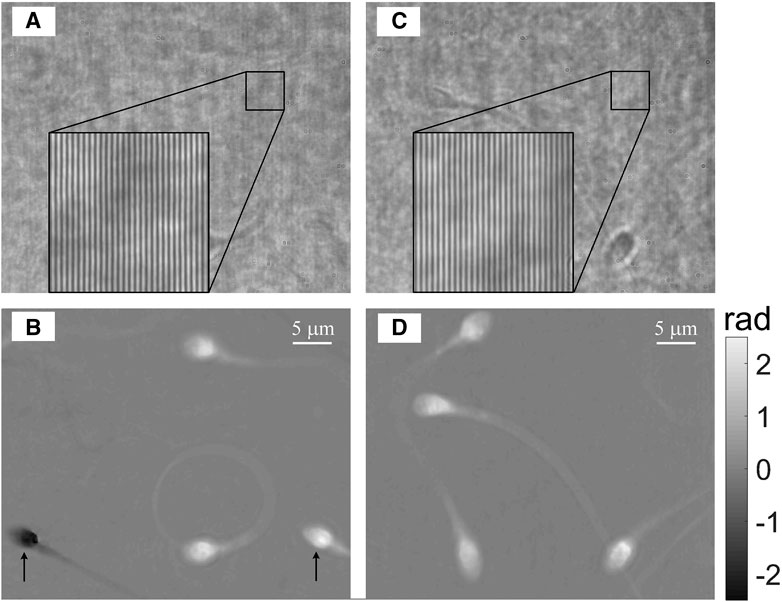
FIGURE 4. Dynamic quantitative phase imaging of human sperm cells swimming in 80% PureCeption medium. (A, B) Off-axis hologram (A) and quantitative phase profile (B) with a small lateral shearing distance, as acquired by the LC-SICA module. See dynamic quantitative phase profile in Supplementary Video S1. (C, D) Off-axis hologram (C) and quantitative phase profile (D) with a large lateral shearing distance, acquired by the LC-SICA module. See dynamic quantitative phase profile in Supplementary Video S2. The black arrows in (B) indicate two conjugate images of the same cell: one image has positive phase values while the other image has negative values (ghost image), which might overlap with the positive-value cells, as demonstrated in Supplementary Video S1. This unwanted effect can be avoided if the shearing distance is fully controlled without direct relation to the off-axis angle. This off-axis angle is chosen to be optimal and constant, as can be seen in both holograms (A) and (C), both having the same spatial frequency of the interference fringes, in spite of the fact that the shearing distance is different.
Conclusion
We presented the LC-SICA module for dynamic phase imaging with high temporal and spatial phase sensitivities. This portable common-path module is made of simple off-the-shelf components: a diffraction grating, two lenses and a glass compensator, and has the advantages of simplicity and easy usage. The grating is used to generate two shifted sample beams on the camera sensor. Each of the two beams is the reference beam to the other beam, as in all shearing interferometer. However, in our case, the off-axis interference angle is uncoupled from the shearing distance, as opposite to other shearing interferometers. A low-coherence source is used to minimize spatial phase noise. The OPD between the two beams as a function of grating position is analyzed based on ray optics, and it is compensated with a glass plate. Thus, the full-field off-axis holograms can be obtained easily with a low-coherence light source, with no decrease in the fringe visibility. The comparative measurements of a polymer bead indicated that the spatial phase noise level was reduced significantly when compared to the results obtained with the coherently illuminated module. Measurement of a human white blood cell demonstrated the high temporal phase sensitivity imaging capability of the module. Experiments of different shearing distances were carried out, demonstrating that ghost-free imaging of swimming sperm cells can be achieved, by selecting a proper shearing distance based on sample density, as controlled by the grating axial location, and without changing the interference fringe frequency. The LC-SICA module is expected to be a useful tool empowering conventional microscopy in low-noise quantitative phase imaging.
Data Availability Statement
The raw data supporting the conclusions of this article will be made available by the authors, without undue reservation.
Author Contributions
RG and NS conceived the project. IB prepared the biological samples, and RG performed the experiments. RG and NS wrote the manuscript.
Funding
H2020 European Research Council (ERC) 678316.
Conflict of Interest
The authors declare that the research was conducted in the absence of any commercial or financial relationships that could be construed as a potential conflict of interest.
Supplementary Material
The Supplementary Material for this article can be found online at: https://www.frontiersin.org/articles/10.3389/fphy.2020.611679/full#supplementary-material
References
1. Shaked NT, Satterwhite LL, Bursac N, Wax A. Whole-cell analysis of live cardio myocytes using wide-field interferometric phase microscopy. Biomed Opt Express. (2010). 1:706–19. doi:10.1364/BOE.1.000706
2. Shaked NT, Zhu Y, Badie N, Bursac N, Wax A. Reflective interferometric chamber for quantitative phase imaging of biological sample dynamics. J Biomed Opt. (2010). 15:030503. doi:10.1117/1.3420179
3. Kemper B, von Bally G. Digital holographic microscopy for live cell applications and technical inspection. Appl Opt. (2008). 47:A52–61. doi:10.1364/AO.47.000A52
4. Popescu G, Park Y, Lue N, Best-Popescu C, Deflores L, Dasari RR, et al. Optical imaging of cell mass and growth dynamics. Am J Physiol. (2008). 295:C538–44. doi:10.1152/ajpcell.00121.2008
5. Micó V, Zheng J, Garcia J, Zalevsky Z, Gao P. Resolution enhancement in quantitative phase microscopy. Adv Opt Photon. (2019). 11:135–214. doi:10.1364/AOP.11.000135
6. Picazo-Bueno JA, Trusiak M, García J, Patorski K, Micó V. Hilbert-Huang single-shot spatially multiplexed interferometric microscopy. Opt Lett. (2018). 43:1007–10. doi:10.1364/OL.43.001007
7. Memmolo P, Miccio L, Merola F, Gennari O, Netti PA, Ferraro P. 3D morphometry of red blood cells by digital holography. Cytometry A (2014). 85:1030–6. doi:10.1002/cyto.a.22570
8. Park Y, Best CA, Auth T, Gov NS, Safran SA, Popescu G, et al. Metabolic remodeling of the human red blood cell membrane. Proc Natl Acad Sci USA. (2010). 107:1289–94. doi:10.1073/pnas.0910785107
9. Jacob Eravuchira P, Mirsky SK, Barnea I, Levi M, Balberg M, Shaked NT. Individual sperm selection by microfluidics integrated with interferometric phase microscopy. Methods (2018). 136:152–9. doi:10.1016/j.ymeth.2017.09.009
10. Min J, Yao B, Ketelhut S, Engwer C, Greve B, Kemper B. Simple and fast spectral domain algorithm for quantitative phase imaging of living cells with digital holographic microscopy. Opt Lett. (2017). 42:227–30. doi:10.1364/OL.42.000227
11. Eldridge WJ, Sheinfeld A, Rinehart MT, Wax A. Imaging deformation of adherent cells due to shear stress using quantitative phase imaging. Opt Lett. (2016). 41:352–5. doi:10.1364/OL.41.000352
12. Park H, Hong SH, Kim K, Cho SH, Lee WJ, Kim Y, et al. Characterizations of individual mouse red blood cells parasitized by Babesia microti using 3-D holographic microscopy. Sci Rep. (2015). 5:10827. doi:10.1038/srep10827
13. Shaked NT, Satterwhite LL, Telen MJ, Truskey GA, Wax A. Quantitative microscopy and nanoscopy of sickle red blood cells performed by wide field digital interferometry. J Biomed Opt. (2011). 16:030506. doi:10.1117/1.3556717
14. Hu C, Santi M, Adelaja O, Kajdacsy-Balla A, Popescu G, Kobak W. Imaging collagen properties in the uterosacral ligaments of women with pelvic organ prolapse using spatial light interference microscopy (SLIM). Front Physiol. (2019). 7:72. doi:10.3389/fphy.2019.00072
15. Haifler M, Girshovitz P, Band G, Dardikman G, Madjar I, Shaked NT. Interferometric phase microscopy for label-free morphological evaluation of sperm cells. Fertil Steril. (2015). 104:43–7. doi:10.1016/j.fertnstert.2015.04.013
16. Pavillon N, Kühn J, Moratal C, Jourdain P, Depeursinge C, Magistretti PJ, et al. Early cell death detection with digital holographic microscopy. PLoS ONE. (2012). 7:e30912. doi:10.1371/journal.pone.0030912
17. Guo RL, Wang F. Compact and stable real-time dual-wavelength digital holographic microscopy with a long-working distance objective. Optic Express. (2017). 25:24512–20. doi:10.1364/OE.25.024512
18. Bai H, Zhong Z, Shan M, Liu L, Guo L, Zhang Y. Interferometric phase microscopy using slightly-off axis reflective point diffraction interferometer. Optic Laser Eng. (2017). 90:155–60. doi:10.1016/j.optlaseng.2016.10.011
19. Chowdhury S, Eldridge WJ, Wax A, Izatt JA. Structured illumination multimodal 3D-resolved quantitative phase and fluorescence sub-diffraction microscopy. Biomed Optic Express. (2017). 8:2496–518. doi:10.1364/BOE.8.002496
20. Guo RL, Wang F, Hu X, Yang W. Off-axis low coherence digital holographic interferometry for quantitative phase imaging with an LED. J Optic. (2017). 19:115702. doi:10.1088/2040-8986/aa8887
21. Hosseini P, Zhou R, Kim YH, Peres C, Diaspro A, Kuang C, et al. Pushing phase and amplitude sensitivity limits in interferometric microscopy. Optic Lett. (2016). 41:1656–9. doi:10.1364/OL.41.001656
22. Gao P, Pedrini G, Osten W. Structured illumination for resolution enhancement and autofocusing in digital holographic microscopy. Optic Lett. (2013). 38:1328–30. doi:10.1364/OL.38.001328
23. Shaked NT. Quantitative phase microscopy of biological samples using a portable interferometer. Optic Lett. (2012). 37:2016–8. doi:10.1364/OL.37.002016
24. Roitshtain D, Turko NA, Javidi B, Shaked NT. Flipping interferometry and its application for quantitative phase microscopy in a micro-channel. Optic Lett. (2016). 41:2354–7. doi:10.1364/OL.41.002354
25. Rotman-Nativ N, Turko NA, Shaked NT. Flipping interferometry with doubled imaging area. Optic Lett. (2018). 43:5543–6. doi:10.1364/OL.43.005543
26. Kemper B, Vollmer A, Rommel CE, Schnekenburger J, von Bally G. Simplified approach for quantitative digital holographic phase contrast imaging of living cells. J Biomed Optic. (2011). 16:026014. doi:10.1117/1.3540674
27. Popescu G, Ikeda T, Dasari RR, Feld MS. Diffraction phase microscopy for quantifying cell structure and dynamics. Opt Lett. (2006). 31:775–7. doi:10.1364/OL.31.000775
28. Ma C, Li Y, Zhang J, Li P, Xi T, Di J, et al. Lateral shearing common-path digital holographic microscopy based on a slightly trapezoid Sagnac interferometer. Optic Express. (2017). 25:13659–67. doi:10.1364/OE.25.013659
29. Singh AS, Anand A, Leitgeb RA, Javidi B. Lateral shearing digital holographic imaging of small biological specimens. Optic Express. (2012). 20:23617–22. doi:10.1364/OE.20.023617
30. Lee K, Park Y. Quantitative phase imaging unit. Optic Lett. (2014). 39:3630–3. doi:10.1364/OL.39.003630
31. Bon P, Maucort G, Wattellier B, Monneret S. Quadriwave lateral shearing interferometry for quantitative phase microscopy of living cells. Optic Express. (2009). 17:13080–94. doi:10.1364/OE.17.013080
32. Majeed H, Ma L, Lee YJ, Kandel M, Min E, Jung W, et al. Magnified Image Spatial Spectrum (MISS) microscopy for nanometer and millisecond scale label-free imaging. Optic Express. (2018). 26:5423–40. doi:10.1364/OE.26.005423
33. Girshovitz P, Shaked NT. Compact and portable low-coherence interferometer with off-axis geometry for quantitative phase microscopy and nanoscopy. Optic Express. (2013). 21:5701–14. doi:10.1364/OE.21.005701
34. Bhaduri B, Pham H, Mir M, Popescu G. Diffraction phase microscopy with white light. Optic Lett. (2012). 37:1094–6. doi:10.1364/OL.37.001094
35. Edwards C, Bhaduri B, Nguyen T, Griffin BG, Pham H, Kim T, et al. Effects of spatial coherence in diffraction phase microscopy. Optic Express. (2014). 22:5133–46. doi:10.1364/OE.22.005133
36. Guo RL, Mirsky SK, Barnea I, Dudaie M, Shaked NT. Quantitative phase imaging by wide-field interferometry with variable shearing distance uncoupled from the off-axis angle. Optic Express. (2020). 28:5617–28. doi:10.1364/OE.385437
Keywords: quantitative phase imaging, low-coherence interferometry, shearing interferometry, microscopic imaging, digital holography
Citation: Guo R, Barnea I and Shaked NT (2021) Low-Coherence Shearing Interferometry With Constant Off-Axis Angle. Front. Phys. 8:611679. doi: 10.3389/fphy.2020.611679
Received: 29 September 2020; Accepted: 23 October 2020;
Published: 18 February 2021.
Edited by:
Peng Gao, Xidian University, ChinaReviewed by:
Junwei Min, Xian Institute of Optics and Precision Mechanics (CAS), ChinaYongKeun Park, Korea Advanced Institute of Science and Technology, South Korea
Copyright © 2021 Guo, Barnea and Shaked. This is an open-access article distributed under the terms of the Creative Commons Attribution License (CC BY). The use, distribution or reproduction in other forums is permitted, provided the original author(s) and the copyright owner(s) are credited and that the original publication in this journal is cited, in accordance with accepted academic practice. No use, distribution or reproduction is permitted which does not comply with these terms.
*Correspondence: Rongli Guo, Z3VvbGVlOTQ2QGdtYWlsLmNvbQ==