 Franciele Carlesso
 Luis E. A. Vieira
 Luiz A. Berni
 Graziela da S. Savonov
- National Institute for Space Research (INPE), São José dos Campos, Brazil
Absolute radiometers are based on electrical substitution radiometers, which compare optical and electrical power. The same physical principle applies to standard reference detectors operating at cryogenic temperatures and room temperature radiometers for total solar irradiance (TSI) measurements. Both types rely on the cavity with an internal low-reflectance coating to absorb incident radiation similar to a black body. The cavity shape design requires an analysis of the coating reflection properties. Like many materials, ultra-black Ni-P exhibits a mixture of diffuse and specular reflection that depends on the angle of incidence of light in the pores. We employed ray-tracing software to study the impact of the geometry on the absorptivity and distribution of the scattered rays. We describe the scattering model of the black coating in terms of the bidirectional reflectance distribution function. Also, we examined the difficulties of Ni-P electroless deposition and blackening inside the cavity. The measured absorptance of the cavity showed some discrepancies of the simulated absorptance mostly probably due to Ni-P non-uniformity coating.
Introduction
Earth’s climatic variability can be attributed to both forcing causes: anthropogenic and natural. Climate change includes a wide range of parameters resulting in a highly complex system. Total Solar Irradiance (TSI) represents all incoming solar radiation per unit area. Despite the improvement of accurate measurements provided by the instruments, the relationship between the Sun and the TSI variability over long time scales remains unknown. Although there is no evidence on the influence of the short time TSI variability on the Earth’s climate, the variability from minutes to a solar cycle responds to solar features as sunspots, faculae, flares, conventions, and oscillation.
The direct quantification of electromagnetic radiation in terms of power depends on absolute radiometers. These radiometers are commonly called Electrical Substitution Radiometer (ESR) because they compare the optical power absorbed and the electrical Joule heating generated by the passage of current in a known electrical resistance. Estimating the sources of uncertainties requires precision in the calibration of components, subsystems, and the entire instrument. Analysis of uncertainties sources plays a key role in achieving high levels of accuracy. Ground calibrations are accomplished on the components such as the aperture area, applied radiometer power, and cavity/radiometer absorption [1]. The final calibration of the radiometers to monitor the TSI is essential to ensure the continuity and accuracy of the data. Since 2007, a TSI Radiometer Facility allows end-to-end irradiance calibrations of TSI instruments by comparing them directly against a cryogenic radiometer before launch [2]. Cryogenic radiometers are a particular type of ESR that operating at liquid helium temperatures allows demonstrating the exact equivalence of electric and radiant heating [3].
This paper is part of a program to understand the effects of the magnetic structure of the Sun and its impact on Earth’s atmosphere. Our research consists of the development of an active cavity model. The model is based on ray-tracing software. And we considered three intended designs for the TSI radiometer. We built one of the geometries and compared the simulated absorptances with the calculated from reflectance maps.
Electrical Substitution Radiometer
Thermal detectors exploit the heating of a body due to the absorption of electromagnetic radiation. The key components of a radiometer are an optical absorber, electrical heater, temperature-sensitive element, a thermal link, and heat sink (Figure 1). Detectors are designed to maximize the absorption of incident radiation by using materials with high absorption coefficients and cavities with specific geometries.
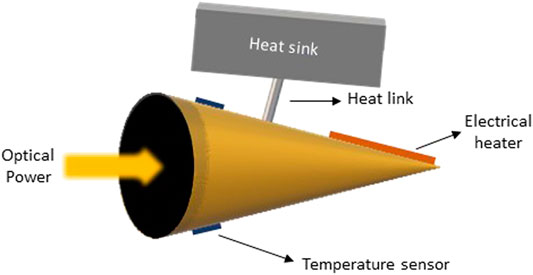
FIGURE 1. Schematic of an electrical substitution radiometer (ESR).
Instruments usually perform TSI measurements in pairs maintained thermally balanced [1]. While one of the sensors is kept in dark as a reference the other sensor is exposed to solar radiation (Φ). Most of the optical radiation will be absorbed and lead to a temperature gradient between the cavity and the heat sink. These temperature changes are quantified by temperature-dependent mechanisms, such as thermoelectric voltage, resistance, or pyroelectric voltage [4, 5]. The heat flow created by the temperature change in the cavity depends on a poor heat conductor linked to the heat sink kept at a constant temperature. Once the system is the vacuum environment, temperature changes due to radiation absorption are equivalent to electric Joule heating, so the optical power can then be measured. The differences between the electric and radiant heating regions result in a non-equivalence effect. Determining uncertainties and errors due to non-equivalence is a critical issue for measuring TSI.
Cavity Optical System
The design of the geometry and size of the cavity need to take into account the minimization of reflectance (ρ) and the time for thermal equilibrium to be established. The combination of the use of black low-reflectance internal coatings and the shape of the cavity increases the element's absorptance (α = 1 − ρ). Many cavities have the interior coated with black specular or diffuse paints as MAP–PU1 [6] and Aeroglaze Z302 [7]. Etched nickel-phosphorus (Ni-P) was applied in cryogenic radiometers [8] and on the space environment by the Total Irradiance Monitor (TIM) instrument [1]. Ultra-black Ni–P is capable of absorbing 99.7% of light due to surface morphology consisting of high pore density. However, absorption depends on both the incident and reflected directions as demonstrated by the characterization of bidirectional reflectance distribution function (BRDF) [9]. The impact of the light scattering coming out of the cavity and how much it relies on the geometry were evaluated employing ray tracing software Zemax OpticStudio 16.
The cavities designed in this paper are based on the conical shape and size compatible with the mechanical structure of the radiometer described by [10]. Figure 2 shows the configuration of the model in the non-sequential mode of the ray path. An 8 mm diameter incident beam that matches exactly the area of precision aperture illuminates the cavity. The power is ≈ 68 mW corresponding to the radiation allowed by the precision aperture for TSI = 1,360.8 ± 0.5 W m−2 [11].
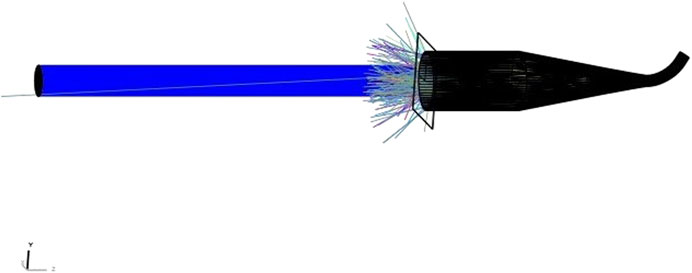
FIGURE 2. Schematic overview of NSC 3D-Layout simulated in Zemax OpticStudio.
We use two rectangular virtual detectors (size: 20 × 20 mm and pixels: 100 × 100), one to collect rays that reach the entrance of the cavity and the other to collect rays that leave the cavity. Moreover, parameters as the total power launched and the number of rays from the source influence the accuracy of the results observed in the detector. The rays leaving the source were defined by the Sobol sampling method. Figure 3 shows the total power converging for the analyzes with a rays number greater than 2 × 10⁷ and the standard deviation decreases above this number of rays. A high Signal-to-Noize Ratio (SNR) depends on factors as pixel number, source uniformity, and sampling method.
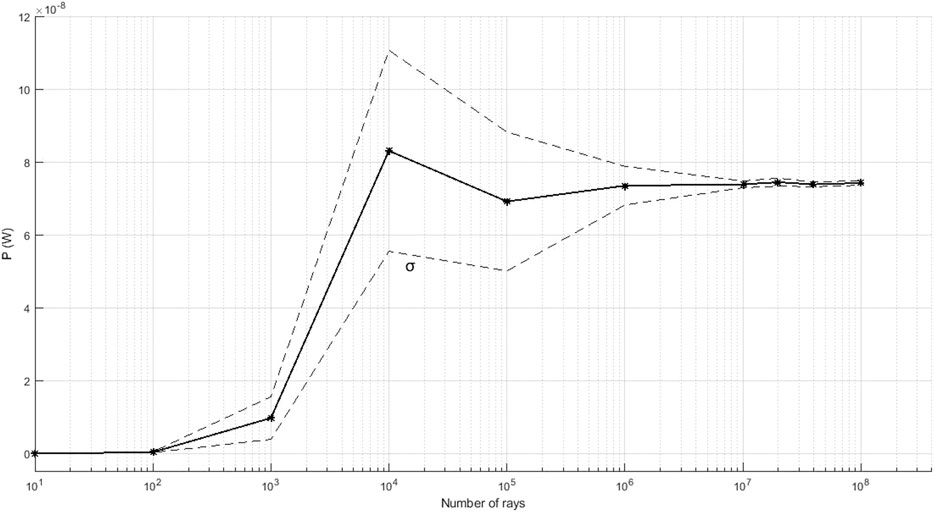
FIGURE 3. Relationship between the number of rays and the total reflected power in the detector. The dotted line represents the standard deviation.
The black material of the internal surface influences the effect of the cavity scattering properties. We adopted ultra-black Ni-P as black material due to the high absorptance and electroless deposition being relatively uniform in complex geometries. A dense array of pores to the surface confine the perpendicular incident light resulting in reflectance of 2,253 ppm at 532 nm. However, at highest incident angles may have part colliding with the lateral wall of the pores, resulting in a reflectance increase. Therefore, ultra-black Ni–P exhibits a dependence on the light incidence angle, then we employed the bidirectional reflectance distribution function (BRDF) for more realistically defining properties of a surface.
Figure 4 shows the three simulated cavities and Figure 5 presents the results of the reflected rays on the rectangular detectors in front of the cavities. The incoherent irradiance scale was adjusted on each panel relative to the peak of irradiance to highlight the features of the outgoing rays. From Figure 5, it can be seen that the reflected flux out of the cavity is non-uniform. And the irradiance distribution is influenced by the change in cavity geometry. It is noticeable the flux concentrated near the bord for conical geometry (C1). We infer this region due to component specular observed on the coating depending on the angle of incidence of the light in the pores, although the predominantly diffuse reflectance [9]. On the other hand, adding a cylinder (geometry C2 and C3), the distribution flux seems like a “salt-and-pepper” appearance. Indicating the specular component has been mostly absorbed in this new segment. And the cavities (C2 and C3) resulted in a higher flux density at the center region. These patterns occur due to the result of the geometric relationship between cavity geometry and the incident angle of the beam in the perpendicular pores to the cavity surface.
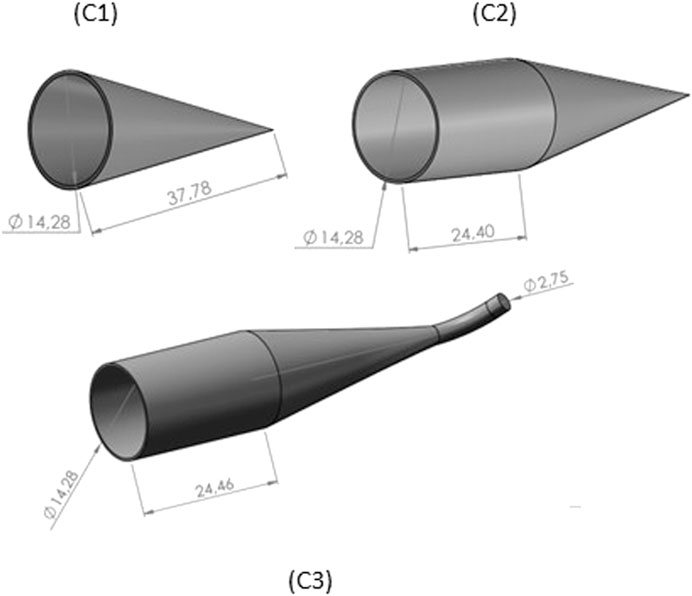
FIGURE 4. The three geometry shapes of cavity: cone (C1) cylinder/cone (C2) and cylinder/cone with a tube at the apex (C3).
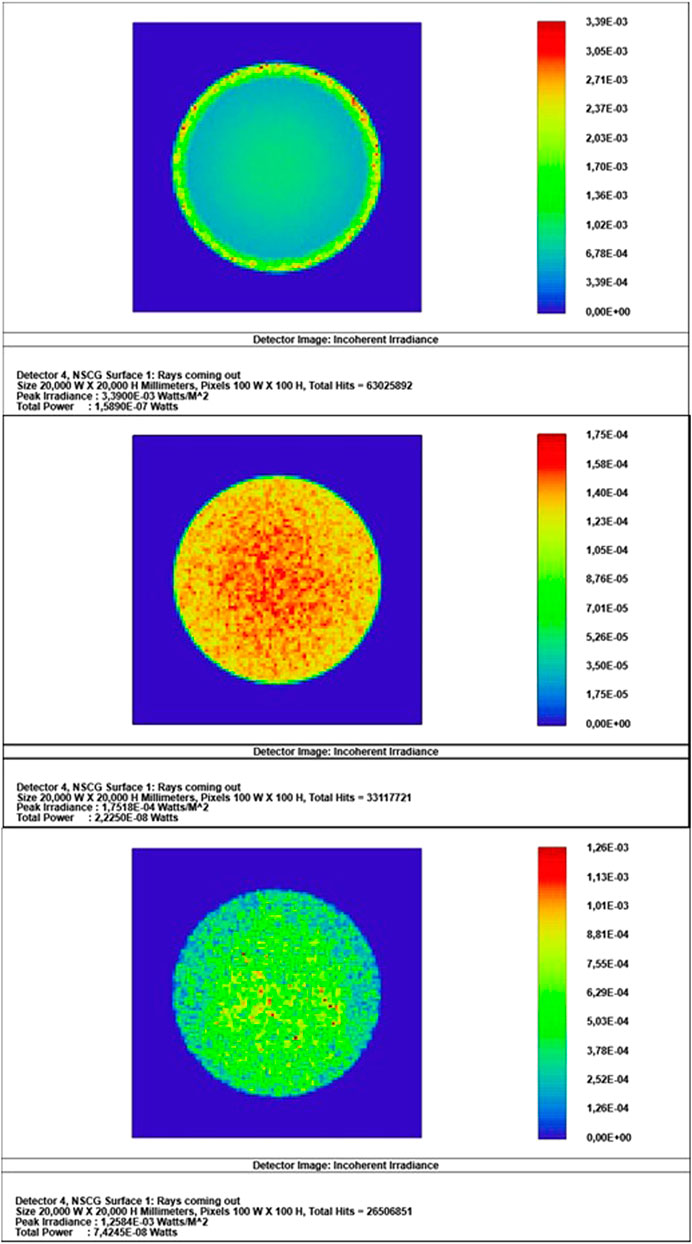
FIGURE 5. Simulation results of incoherent irradiance distribution of the cavities C1 (top), C2 (middle) and C3 (bottom).
The cavities absorptance (α), in Table 1, was calculated by the ratio between the total input power (Pinput), 68 mW, and total reflected power (Preflected) given by:
In order to perfectly fit the electrically heated region and the radiant power, we added two virtual detectors to the cylinder and cone surface. Figure 6 shows that most of the incident light is absorbed in the rear conic region mainly due to the high Ni-P absorptance. The incoherent irradiance profile rapidly increases approximately 38 cm for C2 and 40 cm for C3 from the entry edge. While a smaller number of scattered rays are absorbed in other regions. This result allows the electric heater positioning in the place as close as possible to that heated by the radiant power. However, diffuse scattering in other parts contributes to the uncertainties of the equivalence between radiant and electric heating.
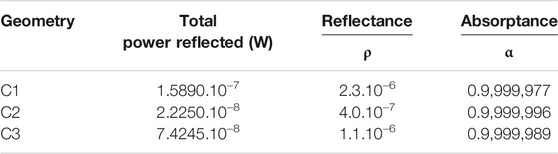
TABLE 1. Simulated absorptance for three cavities.
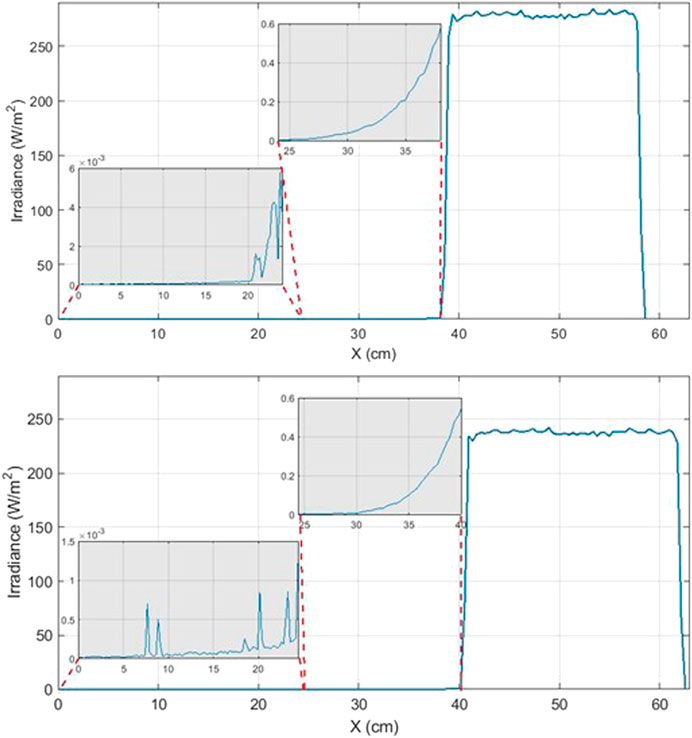
FIGURE 6. Incoherent irradiance along the cavity of cross-sectional detector for geometries: cylinder/cone geometry (top) and cylinder/cone with a tube at the apex (bottom). X = 24, 4 cm marks the junction of the cone and cylinder.
Cavity Fabrication
The cavities were made by silver electrodeposited on the aluminum die which was subsequently etched by an alkaline solution of sodium hydroxide. Electroless Ni-P plating is an auto-catalytic process and the deposition on non-catalytic substrates requires specific surface preparation. The clean silver surface was activated by an instantaneous cathodic current in the electroless nickel bath. The current has been interrupted and the electroless deposition continues as previously described in detail [9]. The Ni-P surface inside the silver cavity was etched with an oxidizing acid (HNO3, 9M) to produce ultra-black Ni–P. It has been observed difficulty in obtaining a deep black layer at the tip end of the cone (geometry C2) due to the vigorous blackening reaction. The interior of complex geometric shapes is very difficult to coat, then we designed the curved tube with a small hole in the cone apex, which was later closed. This hole allowed both the release of the hydrogen bubbles generated on the electrode in the electroless deposition and the flow of acid in the etching process. This useful solution allowed us to produce a visually uniform black surface inside the cavity, as seen in Figure 7.
FIGURE 7. Silver cavity with tube at the apex of the cone (A) and cross-section coated with ultra-black Ni-P (B).
Reflectance Measurements
The spatial reflectance device mapped the sample over a circle with a diameter of 8 mm which corresponds to the illuminated area in the cavity. The measurement setup consists of laser (375, 532, or 633 nm) as the light source and associated optics features as chopper, lens, iris, integrating sphere, and a silicon-diode detector [12]. The integrating sphere was mounted on a platform to move on two axes to scan line by line with a line/point step of 0.3 mm. The reflected light was measured relative to a diffuse NIST-traceable standard (Labsphere Inc., SRS-02).
Figure 8 shows the measured reflectance maps for two conical cavities with a curved tube at the apogee. It is noticeable that the reflected flux out of the cavity is non-uniform and different for both cavities. The results showed a maximum reflectance at the center next to the apex region for cavity C3-A. On the contrary, the center of the cavity C3-B is the lowest reflectance region. We propose that the high reflectance spots in C3 cavity in the center and lower right are due to possible anomalies of the layer resulting in the mostly specular reflection at these points. The reflectance of 220 ppm is the average of the amount scattered light out of the cavity calculated from the data maps. However, the simulated reflectance is 1.1 ppm for this geometry (Table 1).
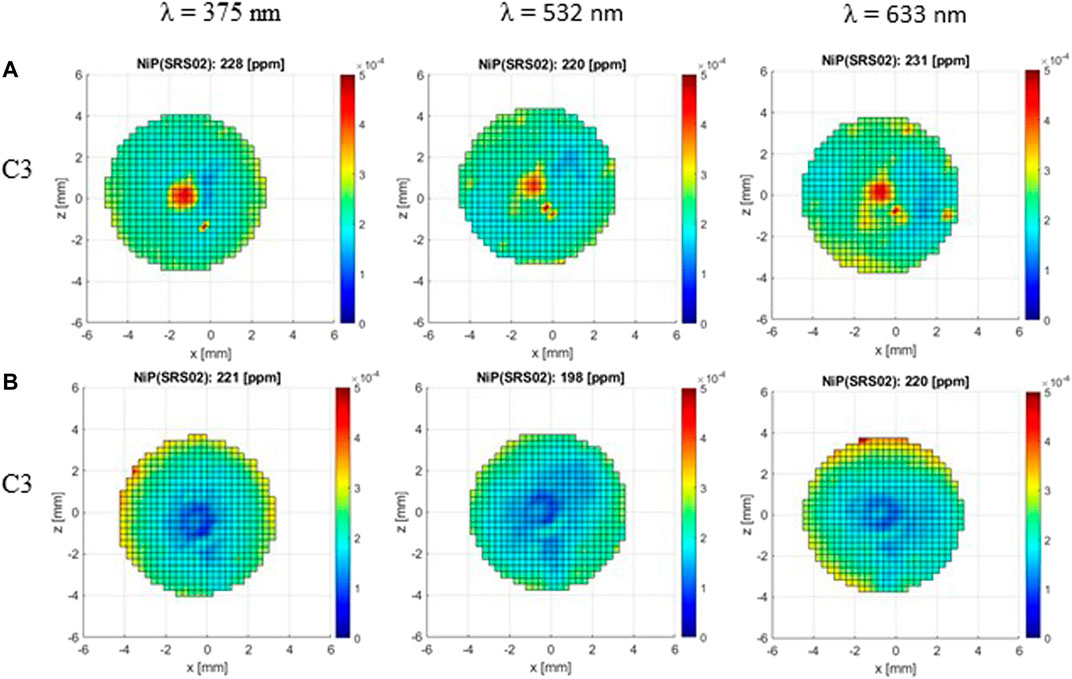
FIGURE 8. Reflectance map of two cavities (C3 (A)/top and C3 (B)/bottom) with a curved tube at the apogee for the wavelengths: 375, 532, and 633 nm. The upper value of each panel represents the average reflectance in ppm calculated from maps.
The distinction between simulated and measured reflectance can be expected due to the morphological characteristics of ultra-black Ni-P. Even in a flat sample, the Ni-P reflectance is non-uniform, and there are higher reflectance points due to the impact of the size and depth of the pores. These pores act as light traps for wavelengths smaller than their diameters. In addition to the inherent variability in both the Ni-P electroless deposition and etched, additional difficulties in the manufacture of the cavity have been founded as a unique part that was solved by the curved tube at the apex of the cone.
Application Design Considerations
The ESR configuration takes account of the effects due to the wave nature of solar radiation. Radiometers’ geometric layout of the aperture and cavity are placed to reduce the effects of scattering and diffraction to almost negligible levels. Shirley, 2005 [13] describes two radiometers for TSI measurements as an example. PMO6 has a non-limiting aperture in front of the instrument and a defining aperture next to the cavity. TIM positioned three non-limiting apertures between the cavity and a smaller diameter limiting aperture in front of the instrument. Non-limiting apertures are large enough to permit the passage of rays defined by the precision aperture. This layout using a smaller diameter precision aperture in front of the radiometer prevents rays off-axis from reaching the cavity performing well in a real configuration. In the PMO6 configuration, a small fraction of excess radiation led to the diffraction correction of 1.001280, whereas TIM has flux loss and correction of 0.999582 [14].
We simulated a simple design with essential elements limiting aperture in front of the radiometer and three non-limiting apertures based on TIM dimensions (Figure 9). We used a point source, and the rays emerge with a small divergence angle. In Figure 10, the pattern of the “salt-and-pepper” appearance of C3 cavity rays out remains. The comparison between total power reflected (W) on the detector is 1.38.10–8 W smaller than for the collimated light rays simulated. Although, the small solar radiation divergence, the collimated beam in the experimental investigation and simulations describe properly the reflectance features of the cavities.
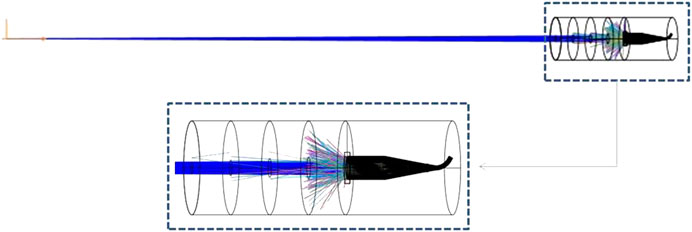
FIGURE 9. Schematic overview of NSC source, aperture and detector layout simulated in Zemax OpticStudio.
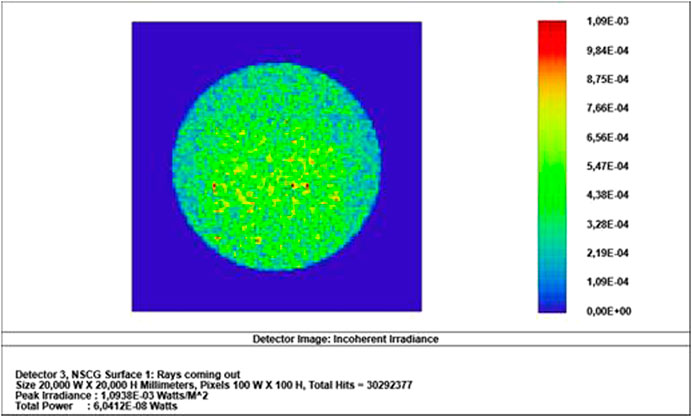
FIGURE 10. Simulation results of incoherent irradiance distribution of the cavity C3 in a simplified ESR layout for TSI measurement.
Concluding Remarks and Future Directions
This paper has discussed a way to design cavities for absolute radiometers. The layout allowed the visualization of the geometry effect on the rays spread out of the cavity. Three geometric designs have been considered in the simulation: cone, cylinder plus cone, and cylinder plus cone with a tube at the apex. Although the high absorptance performance of cylinder plus cone geometry, the non-uniformity of the black coating on the bottom made the method for this cavity size unfeasible. The geometry with a tube at the apex of the cone simulated exhibited an absorption reduction of 7.10–7. However, the visual inspection indicated uniform black coating inside of the manufactured cavity. Even with careful control of the electroless deposition and etch parameters, the inherent variability of these processes added to the extra difficulty of the geometry resulted in reflectance map measurements with different behavior. From the reflectance maps measurements, absorptance was 0.9997998 ± 0.0000196 at 532 nm.
The results showed most of the incident radiation is absorbed in the bottom of the cavity; another part is absorbed by multiples internal reflections along the entire cavity. And eventually, some rays are spread out. In supplementary studies, the non-equivalence factor between optical and electric heating must be calculated considering the radiative power profile absorbed by the cavity to trace changes in temperature distribution.
In general, the increase of the cavity size for a specified diameter results in absorption enhancement. But the larger cavity increases the time constant that is determined by the thermal resistance and thermal capacity. Larger absorbing cavities usually are used in cryogenic radiometers that work at a temperature of approximately 4 K to decrease the specific heat. Therefore, optimize the absorptivity cavity and the time constant is crucial for room-temperature ESR radiometers to improve the instrument sensitivity.
The performance of the ultra-black Ni-P coated cavity is suitable for application radiometers in ESRs. Electroless Ni–P deposition has important advantages as simplicity of equipment, uncomplicated deposition procedure, low cost, and does not require high-melting-point substrates. The future work aims to improve the model including information of the different morphological finishes on the surface cavity, other black materials as carbon nanotubes, and implement other beam parameters.
Data Availability Statement
Publicly available datasets were analyzed in this study. This data can be found here: Annex A.2 - BRDF data used in the simulation/Anexo A.2-Dados de BRDF utilizados no Zemax (Page 181-189): http://mtc-m21b.sid.inpe.br/col/sid.inpe.br/mtc-m21b/2018/02.04.23.10/doc/publicacao.pdf.
Author Contributions
FC and LV contributed to the conception of the paper. FC, LV, LB and GS: methodology and discussion results. All authors contributed to the review and approval of the paper for publication.
Funding
This work was supported by Programa de Capacitação Institucional (PCI/CNPq/n.300046/2020-0, 300976/2020-8 and 300253/2021-4) at the National Institute for Space Research (INPE). LV thanks the Brazilian Space Agency (AEB) for the funding (TED n. 004/2020-AEB; PO 20VB.0009).
Conflict of Interest
The authors declare that the research was conducted in the absence of any commercial or financial relationships that could be construed as a potential conflict of interest.
Acknowledgments
The authors want to thank the Physikalisch-Meteorologische Observatorium Davos/World Radiation Center/Switzerland (PMOD/WRC) for hosting FC and supporting the reflectance maps measurements. Thanks to the Plasma Physics Group at University of São Paulo (USP) for OpticStudio.
References
1. Kopp G, Lawrence G. The total irradiance monitor (TIM): instrument design. Sol Radiat Clim Exp Mission Descr Early Results (2005) 230:91–109. doi:10.1007/0-387-37625-9_6
2. Kopp G, Heuerman K, Harber D, Drake G. The TSI radiometer facility - absolute calibrations for total solar irradiance instruments. Proc SPIE (2007) 6677:667709. doi:10.1117/12.734553
3. Martin JE, Fox NP, Key PJ. A cryogenic radiometer for absolute radiometric measurements. Metrologia (1985) 21:147–55. doi:10.1088/0026-1394/21/3/007
4. Fox N, Rice J. Absolute radiometers. In: AC Parr, RU Datla, and JL Gardner. editors. Experimental methods in the physical sciences, (Amsterdam, The Netherlands: Elsevier) (1986). 35–96. doi:10.1016/S1079-4042(05)41002-4
5. Rogalski A. Comparison of photon and thermal detector performance, In: M Henini, and IDT Razeghi, editors. Handbook of infra-red detection technologies, (Amsterdam, The Netherlands: Elsevier Science), (2002). 5–81. doi:10.1016/B978-185617388-9/50002-2
6. Walter B, Levesque P-L, Kopp G, Andersen B, Beck I, Finsterle W, et al. The CLARA/NORSAT-1 solar absolute radiometer: instrument design, characterization and calibration. Metrologia (2017) 54:674–82. doi:10.1088/1681-7575/aa7a63
7. Rice JP, Lorentz SR, Datla RU, Vale LR, Rudman DA, Sing MLC, et al. Active cavity absolute radiometer based on high - T c superconductors. Metrologia (1998) 35:289–93. doi:10.1088/0026-1394/35/4/13
8. Winkler R. Cryogenic solar absolute radiometer-a potential SI standard for solar irradiance. Doctoral thesis, London, United Kingdom: UCL (University College London) (2013).
9. Carlesso F, Vieira LEA, Berni LA, Savonov GS, Remesal Oliva A, Finsterle W, et al. Physical and optical properties of ultra-black nickel–phosphorus for a total solar irradiance measurement. Astrophys J Suppl Ser (2020) 248:4. doi:10.3847/1538-4365/ab7af8
10. Berni LA, Vieira LEA, Savonov GS, Lago AD, Mendes O, Silva MR, et al. Preliminary design of the Brazilian’s national Institute for space research broadband radiometer for solar observations. Proc Int Astron Union (2016) 12:224–6. doi:10.1017/S1743921317003866
11. Kopp G, Lean JL. A new, lower value of total solar irradiance: evidence and climate significance. Geophys Res Lett (2011) 38:1–7. doi:10.1029/2010GL045777
12. Suter M. Advances in solar radiometry. Zurich, Switzerland: University of Zurich, Faculty of Science (2014).
13. Butler JJ, Johnson BC, Rice JP, Shirley EL, Barnes RA. Sources of differences in on-orbital total solar irradiance measurements and description of a proposed laboratory intercomparison. J Res Natl Inst Stand Technol (2008) 113(4):187–203. doi:10.6028/jres.113.014
Keywords: total solar irradiance, electrical substitution radiometers, reflectance map, bidirectional reflectance distribution function, ultra-black Ni-P, ray-tracing
Citation: Carlesso F, Vieira LEA, Berni LA and Savonov GdS (2021) Design, Implementation and Characterization of Cavity for Absolute Radiometer. Front. Phys. 9:598490. doi: 10.3389/fphy.2021.598490
Received: 24 August 2020; Accepted: 20 January 2021;
Published: 16 March 2021.
Edited by:
Scott William McIntosh, National Center for Atmospheric Research (UCAR), United StatesReviewed by:
Yupeng Wang, Changchun Institute of Optics, Fine Mechanics and Physics (CAS), ChinaMartin Snow, University of Colorado Boulder, United States
Copyright © 2021 Carlesso, Vieira, Berni and Savonov. This is an open-access article distributed under the terms of the Creative Commons Attribution License (CC BY). The use, distribution or reproduction in other forums is permitted, provided the original author(s) and the copyright owner(s) are credited and that the original publication in this journal is cited, in accordance with accepted academic practice. No use, distribution or reproduction is permitted which does not comply with these terms.
*Correspondence: Franciele Carlesso, ZmNjYXJsZXNzb0BnbWFpbC5jb20=