 Carina da Costa Castanheira
 Andreas Persch
 Christian Ott
 Thomas Pfeifer
- Max Planck Institute for Nuclear Physics, Heidelberg, Germany
We show that absorption spectra of aluminum chloride phthalocyanine (AlClPc) in the liquid phase can be dynamically modified through the time-resolved interaction with a second laser pulse during a time window on the order of 100 fs. The observed effects can be explained by laser-induced coherent coupling dynamics between the ground state and a bath of excited states as reproduced by a few-level toy model. The presented results help to understand how intense laser fields interact with complex molecules in solution, but in their laser-controlled response still much alike isolated atoms in the gas phase. This understanding can, in the future, be used to modify and control the dynamics in complex systems.
1 Introduction
Coherent laser-control concepts are widely used to efficiently control matter [1–3]. In the gaseous phase the optical response of atomic and molecular targets can be controlled by XUV-NIR multi-pulse experiments which have been understood through laser-induced couplings between isolated electronic states [4–7], and also including vibrational couplings [8–12]. This approach also includes the possibility to selectively modify and control the dipole response with intense fields [13–15]. For more complex systems of molecules dissolved in the liquid phase, the intricacy of coherent light-matter interaction increases, where typically the coupling to a bath leads to rather rapid decoherence effects [16–20]. Nevertheless, coherent control concepts have been realized in these systems [21–23] and can also be understood through atom-like modeling [24, 25]. Based on existing dynamic coherent-control concepts which have been already established in the XUV-NIR spectral region on gas phase targets [14, 26, 27] it is the goal of this work to expand the dynamic control of absorption spectra to the liquid phase using time-resolved absorption spectroscopy in the visible (VIS) to near-infrared (NIR) regime.
The conceptual idea of measuring and controlling the optical dipole response of the system is presented in Figure 1. A weak excitation pulse induces a freely decaying dipole moment at time
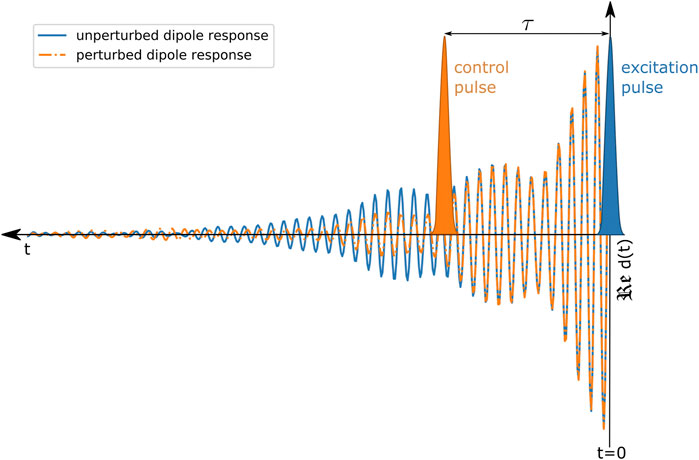
FIGURE 1. Schematic illustration of controlling the optical dipole response. The excitation pulse (depicted in blue) initiates the system’s dipole response
With this understanding laser-induced coupling dynamics can be extracted across isolated atomic [6, 13, 31], molecular [9, 10] and also more complex resonances [25]. Here, we apply these laser-control concepts of absorption spectra and the dipole response to a larger system of an organo-metallic complex in the liquid phase to explore new possibilities to dynamically control the system’s absorption properties. Therefore we experimentally and computationally explore the impact of a laser field on a molecular coherence, which is encoded in the weak-field excitation-only absorption spectrum, by applying the concept of the induced dipole moment and its manipulation. We further confirm this approach by reproducing the measured coherent effects of the dynamically modified dipole response by using a numerical atom-like few-level toy model.
In this work our target of interest are aluminum phthalocyanine chloride (AlClPc) complexes dissolved in ethanol. Due to their outstanding electronic and optical properties phthalocyanines in general enjoy a variety of industrial and medical applications such as solar cells [32, 33] and photodynamic therapy (PDT) of tumors [34–36]. Phthalocyanines are thermally and chemically stable and can therefore sustain also slightly more intense electromagnetic radiation, which makes them adequate candidates for the interaction with intense laser fields in the liquid phase. Their absorption is mostly governed by a
2 Materials and Methods
To exert laser-induced control of the optical response of AlClPc in the liquid phase we use a transient-absorption measurement scheme “in reverse”: A weak (excitation) pulse to excite the system, and a second stronger pulse—referred to as control pulse—arriving later. Both pulses are in the visible spectral range.
The measurement concept is depicted in Figure 2. The preceding weak pulse induces in the sample a freely decaying dipole moment (blue) which can be understood as the coupling between the ground state GS and the excited states of the Q-band. The interference of the induced dipole response in time with the weak pulse itself—both are in a fixed phase relationship—leads to an (unperturbed) absorption spectrum which is dispersed by a grating and measured as a function of energy (see the corresponding blue spectrum). If the control pulse arrives in time before the coherent dipole response has decayed completely, it is able to disturb the system by modifying the dipole response, leading to changes in the measured weak-field absorption spectrum (depicted in red color).
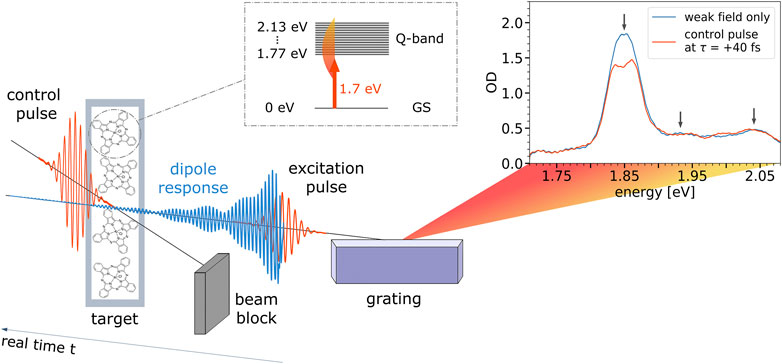
FIGURE 2. Measurement concept. Pulses propagate from left to right, so, if considered temporally, real time increases from right to left. Therefore, the depicted pulse arrangement shows a configuration for positive delay times, where the delayed control pulse modifies the excitation-pulse-induced dipole moment (depicted in blue). Exemplary absorption spectra are shown for the case of very late control delays in blue (effectively “weak field only”) where the control pulse does not change the dipole response anymore, as well as for the time delay τ = +40 fs, where the control pulse significantly perturbs the induced dipole moment. Black arrows denote the position of the Q3-, Q2-, and Q1-band. The inset shows an atom-like level scheme which is used for our toy model.
For the case of control-pulse first, that pulse does induce a dipole moment with which the later arriving weak pulse can interact. This effect is not seen in our measurements, since the control pulse (and therefore the co-propagating control-induced dipole moment) is spatially blocked after the sample. This is the reason why in our case we are only sensitive to the weak-field induced dipole moment. The difference in our experiment is thus rooted in the slightly non-collinear geometry where in the far field (after the sample) the pulses are detected spatially separate. Please note, due to the non-collinear geometry, measuring the excitation pulse together with its dipole response perturbed by the control pulse, any higher-order coherent effects induced by the control pulse itself, including stimulated emission induced by the control pulse [39], are not observed in the measurement direction of the excitation pulse.
To generate broadband ultrashort laser pulses in the visible spectral range we use a commercially available Ti:Sapphire multi-pass amplifier laser system (Femtolasers FEMTOPOWER™ HE/HR CEP4) with a 3 kHz repetition rate, approximately 3 mJ pulse energy and a pulse duration of 20 fs full-width at half maximum (FWHM). After nonlinear propagation in a hollow-core fiber, a supercontinuum is generated which approximately covers the spectral range from 500 to 1000 nm. Subsequently the pulses are compressed with chirped mirrors. For this measurement we use chirped supercontinuum pulses of 32.7 ± 0.8 fs (FWHM), determined by fitting the instrumental response function on the lineout of the ground-state bleach of the Q3-band over the time delay, as can be seen in Figure 3. This helps to attenuate the peak intensities of the laser pulses to avoid permanent damage of the sample. As a fit function we used a convolution between a Gaussian, a Heaviside and an exponential function:
with c and b being constants representing the depth and the total offset of the step, while A and B are constants for the amplitude of the instrumental response function (IRF) and the exponential decay, respectively, and σ denotes the width of the IRF and τ the exponential relaxation time. We apply this fit in the gray shaded pulse overlap area (Figure 3) near temporal overlap, i.e. before the onset of more complex molecular dynamics at later times.
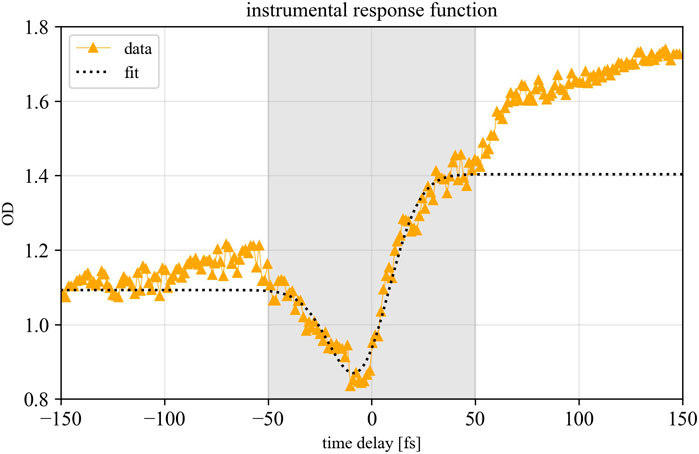
FIGURE 3. Fit of the instrumental response function on the mean lineout of the Q3-band as a function of the time delay. The fit function (1) was applied in the grey shaded pulse-overlap area.
The experimental response-control setup is depicted in detail in Figure 4. The collimated beam is divided into phase-synchronized excitation and control beams by a custom-built array of two iris apertures. The iris parameters are adjusted for the control beam to obtain a bigger focus diameter than the excitation beam. This ensures that the excitation-pulse-induced dipole response can be globally modified by the control beam, fully illuminating the excited sample volume. The preceding variable metallic neutral-density (ND) filters allow for an independent adjustment of the intensity of the beams. The time delay between both beams is introduced by a two-component mirror consisting of two mirrors separately mounted on piezo micrometer delay stages (PIHera Piezo Linearstage P-622.1CD, Physik Instrumente) which are hit by the laser beams under close-to normal angle of incidence, allowing to access time delays up to ±1.7 ps. Shortly after the focusing mirror (with a focal length of 50 cm), both beams pass a broadband beamsplitter (Layertech 110105) which reflects 80
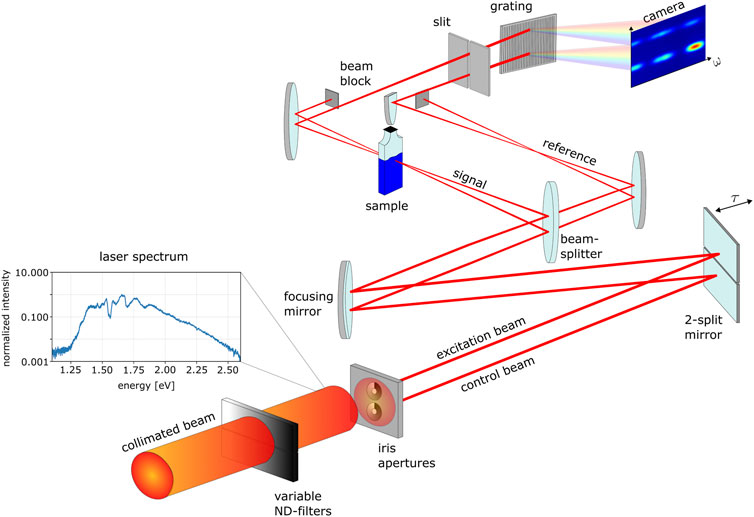
FIGURE 4. Experimental response-control setup. See text for details.—Note: The 2-split mirror, as well as the focusing mirror are experimentally hit under close-to-normal angle of incidence. Increased angles are depicted in the illustration for a better schematic overview of the experimental setup.
As a sample container, cyclic olefin copolymer cuvettes (SpecVette™ manufactured by Aline Inc.) with 0.5 mm path length and 25 μl volume were used. The solution of AlClPc was prepared by dissolving 0.0042 g of AlClPc (purchased from Sigma Aldrich) in 0.01 ml of 99.9% ethanol (Uvasol® by Sigma Aldrich) and was further diluted with distilled water with a ratio of 3:1 which results in a solution with a concentration of 55 nmol/ml.
3 Results
3.1 Experimental Results
For the measurements the excitation-beam average power was set to 0.28 mW and the control average power to 4.0 mW which correspond to on-target peak intensities of
with the signal and reference spectral intensity
The static absorption of AlClPc’s Q-band is depicted in blue in Figure 2 and spans the spectral range between 1.80 and 2.08 eV. The highest contribution to the ground-state absorption is attributed to the Q3-band centered at 1.85 eV. The Q1-band is centered at 2.04 eV, while the Q2-band at 1.93 eV is only faintly visible. The measured time-delay-dependent absorption
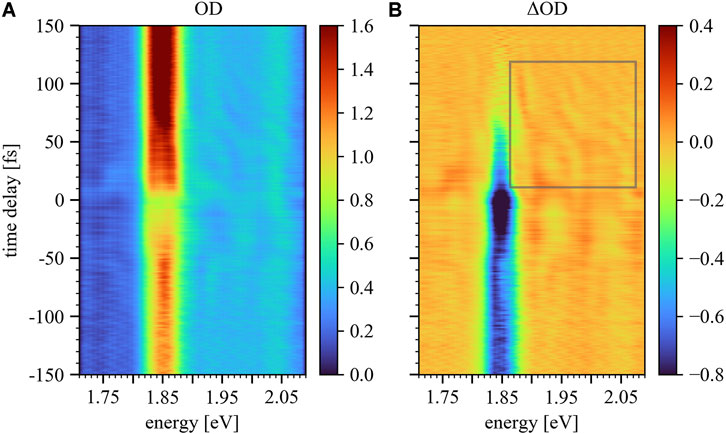
FIGURE 5. Time-delay trace
To verify the origin of the observed effects a Fourier transform along the time-delay axis for positive and negative times of the
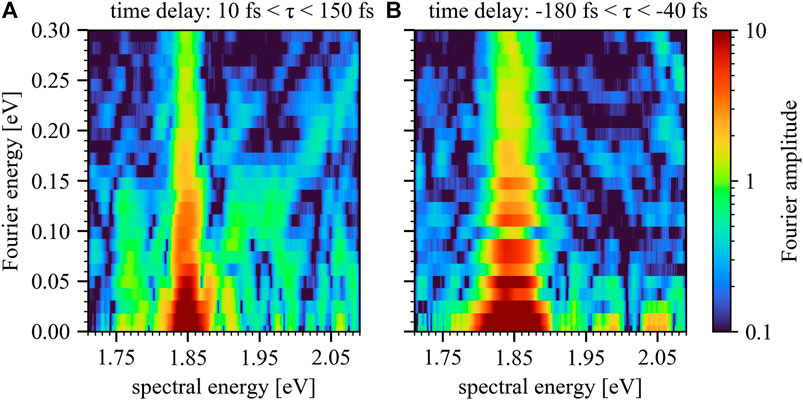
FIGURE 6. Fourier plot for positive (A) and negative (B) time delays of the
The significant qualitative difference between both Fourier plots confirms that the observed diagonal features are associated with laser-driven excited-state dipoles: for positive time delays the control field is able to modify the freely evolving dipole response of the excitation pulse. This qualitative difference between Figure 6A,B therefore strongly suggests that the previously introduced mechanism (Figure 1, 2) plays a significant role. Further confirmation of the underlying origin of the observed effects will be discussed in the following section by employing an atom-like multi-level model calculation.
3.2 Atom-Like Multi-Level Toy Model
We implement a numerical toy model through the propagation of the time-dependent Schrödinger equation in a multi-level system. Hereby we approximate the Q-bands through an ensemble of
with
a split-step algorithm [42] has been used. Under the assumption that the Hamiltonian
where
where
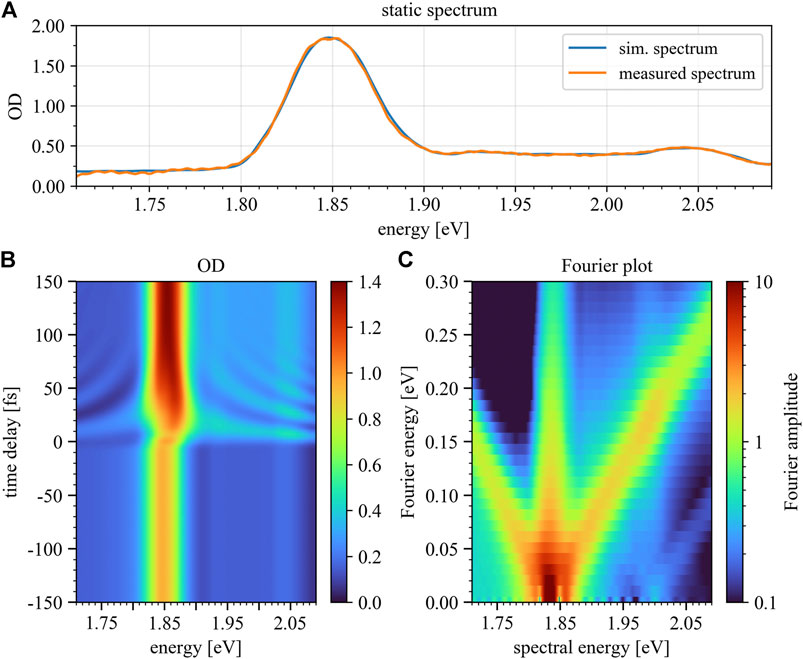
FIGURE 7. Simulated static absorption spectrum (A), time-delay trace (B) and Fourier plot (C) for positive time delays only. Panel 7B depicts the modeled optical density over a time-delay range of 300 fs, where the color bar marks the magnitude of OD. The Fourier plot (Panel 7C) reveals diagonals with slope ±1 in a similar fashion as seen in the experimental data. Negative time delays refer to control-pulse first, positive to excitation-pulse first.
The dipole spectrum
which reflects the interference of the excitation-pulse induced dipole response with the excitation pulse itself, and their propagation through the medium according to Maxwell’s equations. The OD is in turn proportional to the absorption cross section via
where
To mimic the non-collinear experimental setup, an additional wave-front averaging { Refs. [43, 44]} is performed by calculating the absorption spectra with different carrier-envelope-phase (CEP) values for the control pulse, while keeping the CEP of the excitation pulse fixed, and subsequently taking the average of the resulting absorption spectra. Using this procedure the optical interference (heterodyne effect) between both optical pulses is suppressed in the toy model. Experimentally this optical interference is suppressed by the intersection angle of 1.72 degree which corresponds, together with the focal size of 150 μm, to a spread in delay of approximately seven full cycles of the wavelength. Finally, the simulated time-delay trace was convoluted with the instrumental response function, to account for the finite temporal and spectral resolution of the experiment. The resulting time-delay trace, as well as the corresponding Fourier plot (see discussion of Figure 5 above) are depicted in Figures 7B,C.
To show the impact of the control-pulse intensity on the manipulation of the excitation-pulse induced dipole response the numerical toy model was additionally conducted for two more intensities, half (Figure 8) and double (Figure 9) of the case shown in Figure 7. Hereby the results shown in Figure 7 reproduce the experimental results best.
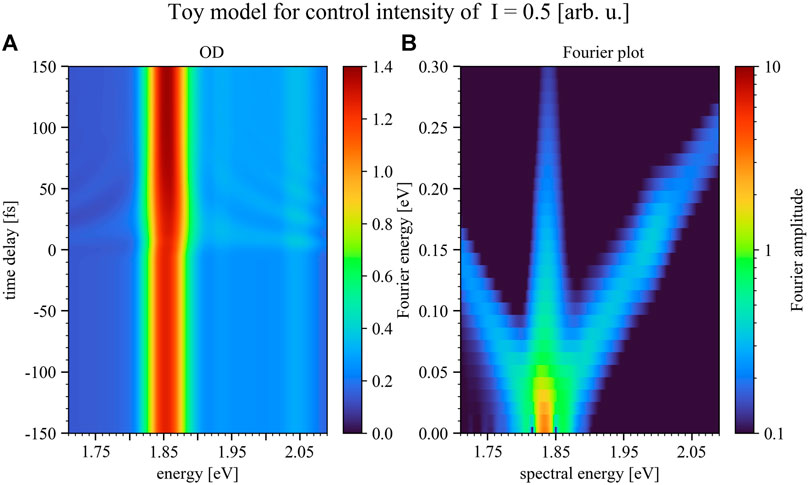
FIGURE 8. Simulated time delay trace (A) and Fourier plot (B) for positive time delays only, but for the case of half the control-pulse intensity compared to Figure 7. Panel 8A depicts the modeled optical density over a time-delay range of 300 fs, where the color bar marks the magnitude of the OD. The Fourier plot (Panel 8B) reveals less pronounced diagonals with slope ±1 compared to the experimental data. As can be seen by lowering the intensity of the control pulse the structures upon the absorption decrease. Negative time delays refer to control-pulse first, positive to excitation-pulse first.
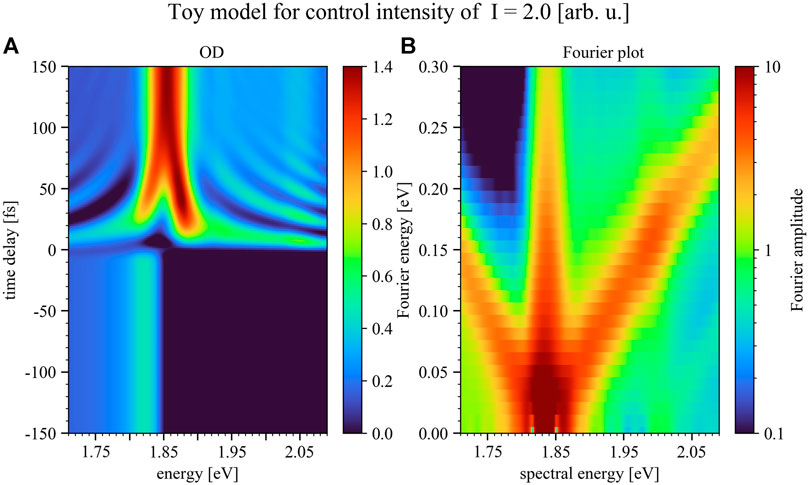
FIGURE 9. Simulated time delay trace (A) and Fourier plot (B) for positive time delays only, but for the case of double the control-pulse intensity of Figure 7. Panel 9A depicts the modeled optical density over a time-delay range of 300 fs, where the color bar marks the magnitude of the OD. The Fourier plot (Panel 9B) reveals diagonals with slope ±1 in a more pronounced fashion compared to the experimental data. The Rabi-/Autler-Townes splitting for small time delays near resonance can be observed to set in and grow with increasing control pulse intensity. Negative time delays refer to control-pulse first, positive to excitation-pulse first.
As can be seen in Figure 8 by lowering the intensity of the control pulse the structures upon the absorption decrease, while for increasing the control-pulse intensity one enters the strong-coupling limit. In this intensity region the control pulse is able to strongly modify the excitation-pulse induced dipole moment, leading to the splitting of the Q3-band which can already be seen in Figure 7B and increases toward higher control-pulse intensity (Figure 9). This band splitting is a Rabi-/Autler-Townes splitting involving light-induced level shifts of strongly coupled states, which can be observed to set in and grow with increasing control-pulse intensity.
In our toy model we only consider states up to a total excitation energy of 2.21 eV. Excitation of higher-lying states might also take place in our measurement but were neglected in the toy model due to lower relative population and thus have only a minor effect on the strong coupling of the lower-lying states. A prominent representative of such energetically higher-lying states is the Soret-band, which could imprint coupling signatures induced by the strong control pulse, which one could also try to identify by measuring its subsequently decay to the Q-band by fluorescence emission [40, 45]. Additional influence due to the coupling to higher excited states, like the Soret-band, may give rise to additional fine structures of the observed time-delay dependent interference.
4 Discussion
Comparing the measured time-delay-dependent absorbance (Figure 5A) with the simulated trace (Figure 7B), a good qualitative agreement can be observed for energies
To summarize, we have observed time-dependent coherent modifications of the ground-state absorption spectrum attributed to the Q-band of AlClPc complexes in the liquid phase. By comparing our measurements with an atom-like multi-level toy model, we were able to qualitatively reproduce and identify the spectro-temporal structures in the optical density as a laser-induced coupling between the ground state and a bath of excited states. Thus, by controlling the dipole response with a time-delayed laser pulse it is possible to understand the coherent ultrafast dynamics of complex systems in solution under the influence of intense light fields.
Data Availability Statement
The raw data supporting the conclusion of this article will be made available by the authors, without undue reservation.
Author Contributions
CC and AP conducted the experiment and evaluated the experimental data together. CC wrote the paper manuscript, while AP conducted the numerical simulation using a part of the code provided from PB. CO and TP supervised the research project and gave input to the manuscript.
Conflict of Interest
The authors declare that the research was conducted in the absence of any commercial or financial relationships that could be construed as a potential conflict of interest.
References
1. Shapiro M, Brumer P. Coherent Control of Atomic, Molecular, and Electronic Processes. Adv At Mol Opt Phys (2000) 42:287–345. doi:10.1016/S1049-250X(08)60189-5
2. Dantus M. Coherent Nonlinear Spectroscopy: From Femtosecond Dynamics to Control. Annu Rev Phys Chem (2001) 52:639–79. doi:10.1146/annurev.physchem.52.1.639
3. Ohmori K. Wave-packet and Coherent Control Dynamics. Annu Rev Phys Chem (2009) 60:487–511. doi:10.1146/annurev.physchem.59.032607.093818
4. Wang H, Chini M, Chen S, Zhang CH, He F, Cheng Y, et al. Attosecond Time-Resolved Autoionization of Argon. Phys Rev Lett (2010) 105:143002. doi:10.1103/PhysRevLett.105.143002
5. Chen S, Bell MJ, Beck AR, Mashiko H, Wu M, Pfeiffer AN, et al. Light-induced States in Attosecond Transient Absorption Spectra of Laser-Dressed Helium. Phys Rev A (2012) 86:063408. doi:10.1103/PhysRevA.86.063408
6. Kaldun A, Ott C, Blättermann A, Laux M, Meyer K, Ding T, et al. Extracting Phase and Amplitude Modifications of Laser-Coupled Fano Resonances. Phys Rev Lett (2014) 112:103001. doi:10.1103/PhysRevLett.112.103001
7. Wu M, Chen S, Camp S, Schafer KJ, Gaarde MB. Theory of Strong-Field Attosecond Transient Absorption. J Phys B: At Mol Opt Phys (2016) 49:062003. doi:10.1088/0953-4075/49/6/062003
8. Reduzzi M, Chu WC, Feng C, Dubrouil A, Hummert J, Calegari F, et al. Observation of Autoionization Dynamics and Sub-cycle Quantum Beating in Electronic Molecular Wave Packets. J Phys B: At Mol Opt Phys (2016) 49:065102. doi:10.1088/0953-4075/49/6/065102
9. Warrick ER, Cao W, Neumark DM, Leone SR. Probing the Dynamics of Rydberg and Valence States of Molecular Nitrogen with Attosecond Transient Absorption Spectroscopy. J Phys Chem A (2016) 120:3165. doi:10.1021/acs.jpca.5b11570
10. Cheng Y, Chini M, Wang X, González-Castrillo A, Palacios A, Argenti L, et al. Reconstruction of an Excited-State Molecular Wave Packet with Attosecond Transient Absorption Spectroscopy. Phys Rev A (2016) 94:23403. doi:10.1103/PhysRevA.94.023403
11. Warrick ER, Fidler AP, Cao W, Bloch E, Neumark DM, Leone SR. Multiple Pulse Coherent Dynamics and Wave Packet Control of the Dark State by Attosecond Four-Wave Mixing. Faraday Discuss (2018) 212:157–74. doi:10.1039/C8FD00074C
12. Drescher L, Reitsma G, Witting T, Patchkovskii S, Mikosch J, Vrakking MJJ. State-resolved Probing of Attosecond Timescale Molecular Dipoles. J Phys Chem Lett (2019) 10:265–9. doi:10.1021/acs.jpclett.8b02878
13. Ott C, Kaldun A, Raith P, Meyer K, Laux M, Evers J, et al. Lorentz Meets Fano in Spectral Line Shapes: A Universal Phase and its Laser Control. Science (2013) 340:716–20. doi:10.1126/science.1234407
14. Blättermann A, Ott C, Kaldun A, Ding T, Pfeifer T. Two-dimensional Spectral Interpretation of Time-dependent Absorption Near Laser-Coupled Resonances. J Phys B: At Mol Opt Phys (2014) 47:124008. doi:10.1088/0953-4075/47/12/124008
15. Stooß V, Cavaletto S, Donsa S, Blättermann A, Birk P, Keitel C, et al. Real-Time Reconstruction of the Strong-Field-Driven Dipole Response. Phys Rev Lett (2018) 121:173005. doi:10.1103/PhysRevLett.121.173005
16. Nuernberger P, Ruetzel S, Brixner T. Multidimensional Electronic Spectroscopy of Photochemical Reactions. Angew Chem Int Edition (2015) 54:11368–86. doi:10.1002/anie.201502974
17. Nairat M, Webb M, Esch MP, Lozovoy VV, Levine BG, Dantus M. Time-resolved Signatures across the Intramolecular Response in Substituted Cyanine Dyes. Phys Chem Chem Phys (2017) 19:14085–95. doi:10.1039/C7CP00119C
18. Kumpulainen T, Lang B, Rosspeintner A, Vauthey E. Ultrafast Elementary Photochemical Processes of Organic Molecules in Liquid Solution. Chem Rev (2017) 117:10826–939. doi:10.1021/acs.chemrev.6b00491
19. Oliver TAA. Recent Advances in Multidimensional Ultrafast Spectroscopy. R Soc Open Sci (2018) 5:171425. doi:10.1098/rsos.171425
21. Brixner T, Damrauer NH, Niklaus P, Gerber G. Photoselective Adaptive Femtosecond Quantum Control in the Liquid Phase. Nature (2001) 414:57–60. doi:10.1038/35102037
22. Pearson BJ, White JL, Weinacht TC, Bucksbaum PH. Coherent Control Using Adaptive Learning Algorithms. Phys Rev A (2001) 63:063412. doi:10.1103/PhysRevA.63.063412
23. Herek JL, Wohlleben W, Cogdell RJ, Zeidler D, Motzkus M. Quantum Control of Energy Flow in Light Harvesting. Nature (2002) 417:533–5. doi:10.1038/417533a
24. Schneider J, Wollenhaupt M, Winzenburg A, Bayer T, Köhler J, Faust R, et al. Efficient and Robust Strong-Field Control of Population Transfer in Sensitizer Dyes with Designed Femtosecond Laser Pulses. Phys Chem Chem Phys (2011) 13:8733–46. doi:10.1039/C0CP02723E
25. Meyer K, Liu Z, Müller N, Mewes JM, Dreuw A, Buckup T, et al. Signatures and Control of Strong-Field Dynamics in a Complex System. Proc Natl Acad Sci (2015) 112:15613–8. doi:10.1073/pnas.1509201112
26. Chini M, Wang X, Cheng Y, Wu Y, Zhao D, Telnov DA, et al. Sub-cycle Oscillations in Virtual States Brought to Light. Scientific Rep (2013) 3:1105.
27. Ott C, Kaldun A, Argenti L, Raith P, Meyer K, Laux M, et al. Reconstruction and Control of a Time-dependent Two-Electron Wave Packet. Nature (2014) 516:374–8. doi:10.1038/nature14026
28. Brito Cruz CH, Gordon JP, Becker PC, Fork RL, Shank CV. Dynamics of Spectral Hole Burning. IEEE J Quan Electron (1988) 24:261–9. doi:10.1109/3.122
29. Sasaki F, Kobayashi S. Femtosecond Dynamics of Frenkel Excitons in Pseudoisocyanine J Aggregates. Jpn J Appl Phys (1995) 34:188. doi:10.7567/jjaps.34s1.188
30. Bengtsson S, Larsen EW, Kroon D, Camp S, Miranda M, Arnold CL, et al. Space–time Control of Free Induction Decay in the Extreme Ultraviolet. Nat Photon (2017) 11:252–8. doi:10.1038/nphoton.2017.30
31. Ding T, Ott C, Kaldun A, Blättermann A, Meyer K, Stooss V, et al. Time-resolved Four-Wave-Mixing Spectroscopy for Inner-Valence Transitions. Opt Lett (2016) 41:709–12. doi:10.1364/OL.41.000709
32. de la Torre G, Claessens CG, Torres T. Phthalocyanines: Old Dyes, New Materials. Putting Color in Nanotechnology. Chem Commun (2007) 2000–15. doi:10.1039/B614234F
33. Walter MG, Rudine AB, Wamser CC. Porphyrins and Phthalocyanines in Solar Photovoltaic Cells. J Porphyrins Phthalocyanines (2010) 14:759–92. doi:10.1142/S1088424610002689
34. Bonnett R. Photosensitizers of the Porphyrin and Phthalocyanine Series for Photodynamic Therapy. Chem Soc Rev (1995) 24:19–33. doi:10.1039/CS9952400019
35. Py-Daniel KR, Namban JS, de Andrade LR, de Souza PEN, Paterno LG, Azevedo RB, et al. Highly Efficient Photodynamic Therapy Colloidal System Based on Chloroaluminum Phthalocyanine/pluronic Micelles. Eur J Pharm Biopharm (2016) 103:23–31. doi:10.1016/j.ejpb.2016.03.028
36. Jayme CC, Calori IR, Tedesco AC. Spectroscopic Analysis of Aluminum Chloride Phthalocyanine in Binary Water/ethanol Systems for the Design of a New Drug Delivery System for Photodynamic Therapy Cancer Treatment. Spectrochimica Acta A: Mol Biomol Spectrosc (2016) 153:178–83. doi:10.1016/j.saa.2015.08.027
37. Edwards L, Gouterman M. Porphyrins: XV. Vapor Absorption Spectra and Stability: Phthalocyanines. J Mol Spectrosc (1970) 33:292–310. doi:10.1016/0022-2852(70)90040-8
38. Vilsinski B, Gerola A, Lemos É, Magalhães Barbosa P, Katieli C, Cesar G, et al. Spectroscopic Study of Aluminum Phthalocyanine Chloride (AlPcCl) in Homogeneous and Micro-heterogeneous Media Consisting of P-123 and F-127 Polymeric Micelles. Química Nova (2015) 38:631–9. doi:10.5935/0100-4042.20150056
39. Konar A, Shah JD, Lozovoy VV, Dantus M. Optical Response of Fluorescent Molecules Studied by Synthetic Femtosecond Laser Pulses. J Phys Chem Lett (2012) 3:1329–35. doi:10.1021/jz300363t
40. Gan Q, Li S, Morlet-Savary F, Wang S, Shen S, Xu H, et al. Photophysical Properties and Optical Limiting Property of a Soluble Chloroaluminum-Phthalocyanine. Opt Express (2005) 13:5424–33. doi:10.1364/OPEX.13.005424
41. Melnikov MY. Aluminum Phthalocyanine on Silica Nanoparticles: Aggregation and Excited States. Macroheterocycles (2015) 8:279–83. doi:10.6060/mhc150459l
42. Feit MD, Fleck JA. Solution of the Schrödinger Equation by a Spectral Method II: Vibrational Energy Levels of Triatomic Molecules. J Chem Phys (1983) 78:301–8. doi:10.1063/1.444501
43. Liu Z, Cavaletto SM, Ott C, Meyer K, Mi Y, Harman Z, et al. Phase Reconstruction of Strong-Field Excited Systems by Transient-Absorption Spectroscopy. Phys Rev Lett (2015) 115:033003. doi:10.1103/PhysRevLett.115.033003
44. Becquet V, Cavaletto SM. Transient-absorption Phases with Strong Probe and Pump Pulses. J Phys B: At Mol Opt Phys (2018) 51:035501. doi:10.1088/1361-6455/aa8e6a
Keywords: transient absorption spectroscopy, coherence in the liquid phase, atom-like multi-level simulation, laser-induced control of the optical response, aluminum phthalocyanine chloride
Citation: da Costa Castanheira C, Persch A, Birk P, Ott C and Pfeifer T (2021) Laser-Induced Control of the Optical Response of Aluminum Phthalocyanine Chloride Complexes Dissolved in Ethanol. Front. Phys. 9:627826. doi: 10.3389/fphy.2021.627826
Received: 10 November 2020; Accepted: 04 May 2021;
Published: 31 May 2021.
Edited by:
Philip Bucksbaum, Stanford University, United StatesReviewed by:
Arkaprabha Konar, Kent State University, United StatesMarcos Dantus, Michigan State University, United States
Copyright © 2021 da Costa Castanheira, Persch, Birk, Ott and Pfeifer. This is an open-access article distributed under the terms of the Creative Commons Attribution License (CC BY). The use, distribution or reproduction in other forums is permitted, provided the original author(s) and the copyright owner(s) are credited and that the original publication in this journal is cited, in accordance with accepted academic practice. No use, distribution or reproduction is permitted which does not comply with these terms.
*Correspondence: Carina da Costa Castanheira, ZGFjb3N0YUBtcGktaGQubXBnLmRl; Christian Ott, Y2hyaXN0aWFuLm90dEBtcGktaGQubXBnLmRl; Thomas Pfeifer, dGhvbWFzLnBmZWlmZXJAbXBpLWhkLm1wZy5kZQ==