 Esther Ciarrocchi1,2*
 Sara Saponaro1Francesco Bartoli3Angela Gabriella Cataldi3Sara Vitali3,4Paola Anna Erba3,5Nicola Belcari1,2
- 1Department of Physics, University of Pisa, Pisa, Italy
- 2Section of Pisa, National Institute of Nuclear Physics, Pisa, Italy
- 3Department of Translational Research on New Technologies in Medicine and Surgery, University of Pisa, Pisa, Italy
- 4Azienda Unitaria Sanitaria Locale (AUSL) of Piacenza, Piacenza, Italy
- 5Nuclear Medicine Unit, University Hospital of Pisa (Azienda Ospedaliero-Universitaria Pisana-AOUP), Pisa, Italy
Cerenkov luminescence imaging (CLI) has been recently proposed as a method to visualize surgical margins in the operating theater, immediately after resection, to allow refining surgery in a single procedure. Our group is preparing a pilot clinical study to evaluate the impact of CLI during hepatic metastasectomy, using 18F-FDG and 68Ga-DOTATOC. Currently, we are optimizing the clinical protocol in terms of patient inclusion criteria, activity to inject, maximum allowed delay for imaging, and radiation monitoring. This paper describes a preliminary study we have performed to define the clinical protocol. The study is composed of two branches: 1) an in-vitro study to predict the typical signals and optical attenuation in the liver with 18F and 68Ga, 2) an analysis of clinical PET/CT data to determine typical values of relevant parameters, such as uptake and lesion dimension. The combined information by these two branches gives us an indication of the feasibility of CLI for margin assessment in liver metastasectomy. For 68Ga, we obtained detection limits ranging from 0.55 to 3.5 kBq/cc, to be compared with minimum and mean clinical uptakes of 1.6 and 7 kBq/cc, respectively. For 18F, the detection limits ranged from 12 to 145 kBq/cc, and the minimum and mean clinical uptakes were 5 and 11 kBq/cc, respectively. From these values, we expect CLI with 68Ga to be able to detect surgical margins in most patients, while with 18F the activities to inject for sufficient signal-to-noise ratio should be larger than standards, or the time delay between injection and imaging largely reduced. The results reported here can be useful also more in general, for studies dedicated to other CLI applications in the liver.
Introduction
Surgery is one of the most effective cancer treatments, but the correct determination of surgical margins is crucial for a successful outcome. In fact positive surgical margins (PSM), defined as the presence of cancer cells at the edges of the resected specimen, can result in high local tumor recurrence rates, thus reducing the efficacy of the treatment. Cerenkov luminescence imaging (CLI) is optical imaging of activity distributions performed by exploiting the emission of Cerenkov photons by charged particles in media with refractive index n > 1, as in the case of imaging agents for positron emission tomography (PET) in biological tissues (n∼1.4) [1]. Recently, CLI has been proposed as an intraoperative adjunct to aid in real-time tumor margin identification [2]. If before surgery the patient has received an intravenous injection of a PET radiopharmaceutical with high uptake in the tumor, CLI of the resected specimen, by providing bidimensional images of the Cerenkov photons at the tissue surface, can tell if surgical margins are negative (absence of signal in the image) or positive (presence of signal). A few clinical studies have already demonstrated the feasibility of CLI for intraoperative specimen analysis, in neurosurgery [3], in breast conserving surgery [4] and in radical prostatectomy [5, 6].
We have identified hepatic metastasectomy as another clinical application where intra-operative CLI could have a potentially high impact in reducing PSM occurrence, which can occurr in up to 20% of the procedures, expecially if performed laparoscopically [7]. Therefore, we are preparing a pilot clinical study to compare the CLI performance in margin assessment with the standard postoperative histopathology. For the study, we will use a dedicated imaging device. Up to date, two research groups have evaluated the performance of this system in two specific cases. The first one measured a minimum detectable 18F-FDG concentration of 8 kBq/ml at 2-mm depth in a slab of raw beef tissue, confining the activity in solid agar-based phantoms [8]. The second one reported an increase by a factor-22 in sensitivity when using 68Ga instead of 18F [9], but in this case measurements were performed with the radioactivity in Eppendorf tubes, either in air or under 1 mm of raw chicken breast fillet.
This paper describes a preliminary study we have performed to define the clinical protocol for the pilot study on CLI of liver metastasis. The first goal of this work is to provide a set of values of the minimum detectable activity concentration, hereafter called detection limit (DL), for CLI of both 18F and 68Ga, in air and at various clinically relevant depths in liver (e.g., a few mm). Given the complexity of the interactions of optical radiation with biological matter, the DL is not a unique fixed value, but it depends on the following factors: 1) the radionuclide, because different β energy spectra result in a different fraction of particles above the threshold for Cerenkov emission and in a different range, thus changing the amount of emitted light and its spread around the radioactivity distribution, respectively; 2) the geometry used to spatially confine the activity distribution, because different density, atomic number and optical properties of the materials used for confinement affect the β particle interactions and the production and transmission of the Cerenkov light; 3) the depth in tissue of the activity distribution, because of the optical attenuation by tissue. For these reasons, we tested three geometries for activity confinement and measured the DL at various fixed depths. We faced the technical difficulty of preparing uniform and thin tissue slabs to obtain DL values at thicknesses below 2–3 mm. To overcome this, we used a new method using tissue wedges to measure the average liver attenuation coefficient and extrapolate the DL at other depths. To try discriminating between a dim shallow activity distribution and an intense deep one, we evaluated the feasibility of using the spectral separation of the detected light.
The second goal of this work is to determine typical clinical values of 18F-FDG and 68Ga-DOTATOC uptake and lesion dimensions in human liver metastasis to expect in the future clinical study. We collected these values by analyzing PET/CT data, and we compared these numbers with the measured imaging system performance to understand if CLI can be sensitive enough to clinically reasonable activity levels, and what is the maximum allowed time delay between radiopharmaceutical injection and CLI of the resected specimen.
Materials and Methods
In-vitro Study
Experimental Set-Up
A detailed description of the imaging system used in this study (LightPath, Lightpoint Medical Inc.) can be found in Refs. [2, 8]. The imaging system acquires a reference white-light picture of the specimen and overlays on it a false color CLI image of the intensity of the Cerenkov signal. Typically, an image is acquired as the accumulation of at least three frames, which are then automatically median and Gaussian filtered to remove hot pixels and other noise sources. In addition, the number of pixels in the CLI image is artificially increased to match its resolution to that of the reference image. Images at all steps in the processing are available to the user for quantitative analysis. In this study, the system performance was determined on the final processed images, because these will potentially be used for margin assessment in the clinical practice. Following the previous studies with the same imaging system, a binning factor of 8 was generally used, corresponding to 0.937 mm/pixel, exposure times were varied based on the signal intensity but always upper-limited at 300 s to be compatible with clinical use, and three frames were summed for each image.
Tested Geometries and Conversion Factors
Looking for a solid geometry to confine the radioactivity and place it contact with the tissue, we tested three options: 1) 1.5 ml plastic Eppendorf tubes 2) 35-mm diameter black Petri dishes sealed with a 130 μm-thick transparent paraffin lid, 3) 2%-agar based solid phantoms. Pictures of the three geometries are shown in Figures 1A–C, together with the corresponding activity profiles (D-F) and CLI images (G-I), commented later. Eppendorf tubes and Petri dishes were partially filled with either 18F-FDG or 68Ga-HCl diluted in distilled water. The empty portion of the Eppendorf tubes was covered with black tape. The activity was uniformly distributed in the solid agar phantoms during their preparation. Initial activities were measured in vial geometry in a dose calibrator with 1% uncertainty.
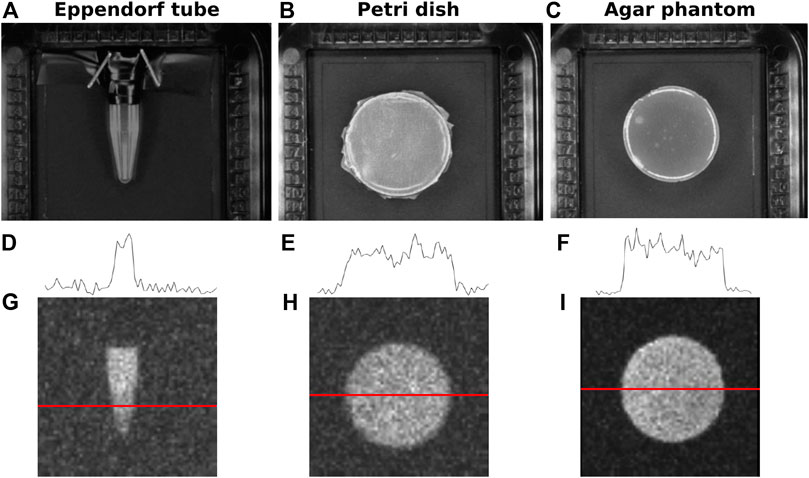
FIGURE 1. Geometries tested for activity confinement: (A) 1.5 ml Eppendorf tubes, (B) black Petri dishes sealed with a transparent paraffin lid, (C) agar based solid phantoms. Corresponding profiles (D–F) and CLI images (G–I) are shown below.
Detection Limits
The DLs were determined for 18F and 68Ga, for the three geometries, and for the source in air and at various depths in bovine liver. Tissue samples were kept sealed and refrigerated until the time of the measurement, and they were discarded and replaced as soon as they appeared dehydrated.
The DL was defined as the activity concentration giving a background-subtracted signal equal to twice the image background noise (SNR = 2), in agreement with a visual inspection of the images. The signal was determined as the mean level in a region of interest (ROI) in the known source area subtracted of the mean image background
ROIs of equal size were always used (200 × 200 pixels, corresponding to 12 × 12 mm2 in the object space). This dimension was chosen as a compromise between maximization of the number of pixels to reduce the error on the mean and available fraction of the field-of-view for the background measurements. We could use such large ROIs because the source was uniform in these measurements. In the clinical study, we plan to adapt the ROI dimension to the dimension and shape of the hot spots and lesions. As mentioned before, in the imaging system the final CLI image displayed in the screen has been interpolated to be superimposed on the reference photo, acquired with a higher resolution. In particular, for binning 8, the 64 × 64 pixel image is transformed into a 992 × 992 pixel image. For this reason, the true standard deviation of the images was calculated from the 64 × 64 pixel image, after median and Gaussian filtering, but prior to pixel interpolation.
As foreseen, the values of the DLs are different for the two radionuclides and for the source geometries, mainly as a combined result of differences between the materials, on one side in the refractive index and optical attenuation, and on the other, in the density and β-particle attenuation. To verify the consistency of the various detection limits, we used a subset of data to determine conversion factors for radionuclide and geometry, and we applied these conversion factors to independent sets of DLs to test their efficacy. The conversion factors F for the signals of the two radionuclides
Liver Attenuation
The main difficulty of this study was to obtain slabs of tissue that were both uniform over the entire source dimension and thinner than 2–3 mm to measure the DL at small depths in tissue. Therefore, we prepared tissue wedges with monotonically increasing thickness to place above the sources to study the signal attenuation and to predict the DL values at several depths. This approach has the advantage of measuring several depths simultaneously in a single image, thus reducing the uncertainties due to variations among images, and it easily allows to check if the tissue thickness is actually monotonic by drawing profiles in the image. An example of a vertical liver wedge is shown in Figure 2A). The vertical profile in Figure 2B) suggests an exponential attenuation of the signal. The tissue thickness h was measured in two reference points and linearly interpolated in between the two. In the example, the slab thickness increased from 2.5 to 7 mm moving down along the vertical line (the final portion of tissue where the thickness reduces again was discarded). For wedge images, the 64 × 64 images (prior to the final rebinning) where used. Ten vertical profiles as the one shown in Figure 2B were averaged. The number of profiles to average was chosen by studying the horizontal profiles as the one in Figure 2C). The average attenuation coefficient
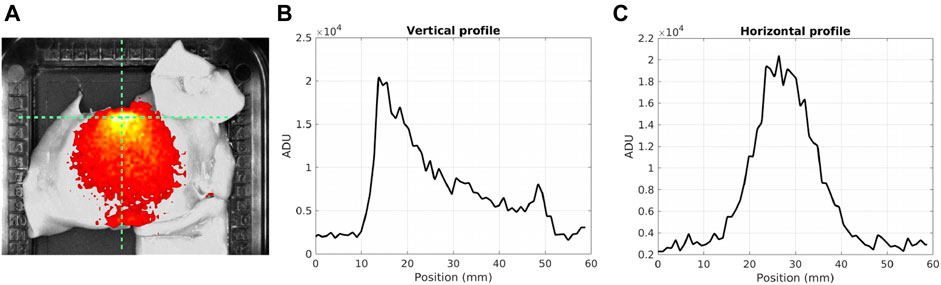
FIGURE 2. (A) Example image of a wedge of liver tissue over a Petri dish filled with 370 kBq of 68Ga in 4 ml of water. The slab thickness increases vertically from 2.5 to 7 mm. (B–C) Vertical and horizontal profiles corresponding to the dashed lines in the image.
Source Depth Measurement
The possibility of discriminating a superficial weak signal from a deep intense one was tested by using the 550-nm and 800-nm short-pass filters provided in the imaging system. In fact, the
Analysis of Clinical PET/CT Data
PET/CT data obtained with 18F-FDG in hepatic metastases and with 68Ga-DOTATOC in neuroendocrine tumors (NETs) were selected to determine typical injected activities, lesion volumes, uptakes and time delays between injection and imaging. Fifteen patients were considered in each group. The reason for using NET data for 68Ga-DOTATOC was that at the time of the study 68Ga-DOTATOC PET of the liver was not yet part of the clinical practice in our hospital. However, 68Ga-DOTATOC for imaging NET liver metastasis seems promising because it has been demonstrated that often NETs cause metastases at several locations, among which liver is one of the main targets [10, 11] and that 68Ga-based radiopharmaceuticals allows to image them with high sensitivity. For example, it has been shown that 68Ga-DOTATATE PET/CT is a valid diagnostic tool to determine the primary site of liver metastases of NETs [12], and that 68Ga-DOTATOC PET/CT provides much better diagnostic sensitivity with respect to 111In-Pentetreotide SPECT/CT in detecting additional lesions in NET patients [13]. PET/CT scans were performed with the Discovery PET/CT 710 system (GE Healthcare, Little Chalfont, Buckinghamshire, United Kingdom), approximately 1 h after injection. PET images were analyzed with the proprietary software of the imaging system, and segmented with a standard threshold of 40% the maximum uptake to measure the lesion volume, expressed as the total lesion glycolysis (TLG), and the total activity, from which the uptake was determined.
Results
In-vitro Study
Tested Geometries and Conversion Factors
Example profiles and images for the three sources are shown in Figures 1D–I. The activity concentrations at the time of imaging were 3.7, 37, and 130 kBq/cc, respectively. For Eppendorf tubes and Petri dishes, the source preparation is simple, controllable and reproducible, while the volume of the agar phantoms is less easy to control due to evaporation during the solidification phase. Agar phantoms have the advantage of placing the activity distribution right in contact with the tissue, and thus seem more representative of the actual clinical situation, whereas Eppendorf tubes and Petri dishes introduce additional discontinuities of the refractive index. In addition, the method used to measure the DL values required a fairly uniform activity distribution inside the source, thus making the Eppendorf tubes less suitable due to their conic shape. For these reasons, we focused mainly on Petri dishes and agar phantoms, and used the Eppendorf tubes only for comparison with a preexisting study.
The possible presence of photoluminescence was tested after flash-light exposure with 5 min acquisitions, acquiring images of the three geometries with no activity. No signal was visible in the images in correspondence of the materials, and a quantitative comparison of the count rates with the background images confirmed the absence of photoluminescence. If this were not the case, a photoluminescent background correction would have been required for accurate quantification, as done in Ref. [14]. In all the measurements with the Petri geometry, it was also verified that the signal increase due to the paraffin lid was constant with respect to the uncovered Petri dishes (equal to +3% for 68Ga). If this signal increase were not constant, this factor could have affected the robustness of the measurements.
Figure 3 shows the count rate
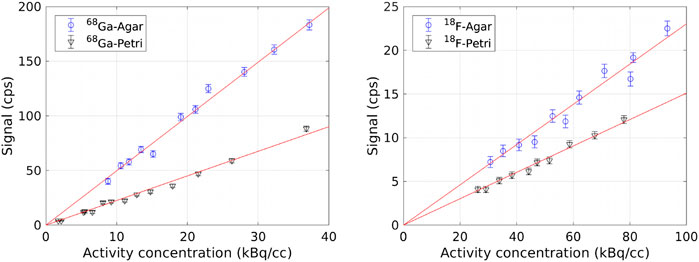
FIGURE 3. Count rate
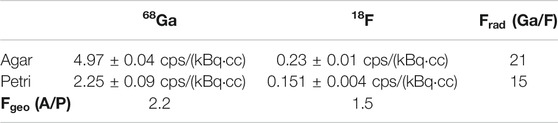
TABLE 1. Parameters m of the linear fit
Detection Limits
The detection limits for 68Ga and for 18F in air and at 2.5 mm depth in the liver are reported in Table 2. As expected, the minimum detectable activity concentration for 18F is much higher than for 68Ga in both geometries. For both radionuclides, a lower activity level can be measured in Agar with respect to Petri dishes because of the higher light production in the first one. In addition, the values in air are consistent within each other if compared by means of the conversion factors in Table 1. Conversely, the values at 2.5 mm depth in the liver are not related among each other by these conversion factors. We believe this to be mainly due to the difficulty in the preparing uniform tissue slabs and on the uncertainty on the measurements of the slab thickness, and it is one the reasons that led us to test the use of tissue wedges.
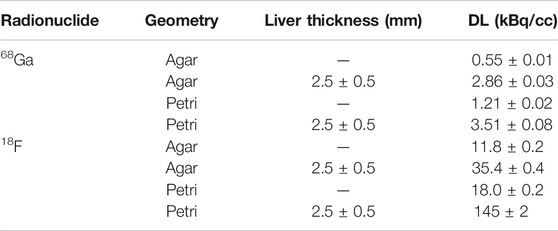
TABLE 2. Detection limits (SNR = 2) for 68Ga and for 18F in air and at 2.5 mm depth in the liver.
In a previous work [8], we obtained a DL of 8 kBq/cc for 18F in an agar phantom at 2 mm depth in a slice of raw beef tissue, using SNR = 1 as a criterion. In this paper, with SNR = 1 we would get a DL of ∼18 kBq/cc at a depth of 2.5 mm, which is acceptable in comparison to our previous result considering the different tissue used in the two cases and the different thickness. We also reproduced the measurements for the DL mentioned in Ref. [9], using the Eppendorf tube geometry and 68Ga, obtaining a value of 0.23 kBq/cc, close enough to the value of 0.14 kBq/cc reported there, if we account for the different shape and transparency of the Eppendorf tubes used.
Liver Attenuation
The plots of the signal attenuation with depth in the liver obtained from wedge images for 68Ga are shown in Figure 4, in the Petri geometry on the left and in an agar phantom on the right. The exponential fit is also shown (solid red line). For the Petri geometry, the average attenuation coefficient for Cerenkov light in animal liver is
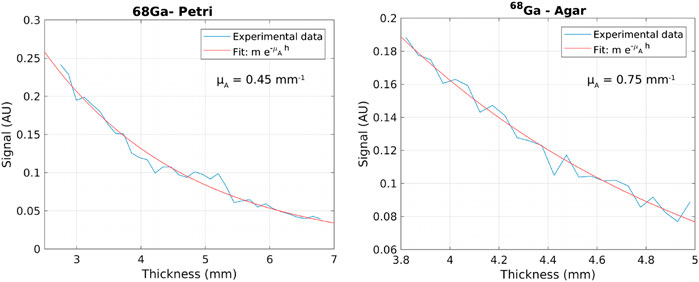
FIGURE 4. Example graph of the signal attenuation with depth in the liver obtained from a wedge image for 68Ga in a Petri dish (left) and in an agar phantom (right). The exponential fit is also shown in red.
Source Depth Measurement
An example plot used to determine the depth in liver corresponding to the 800-nm and 550-nm short-pass filters is shown in Figure 5. The full-spectrum signal (blue), the 800-nm filtered (black) and the 550 nm-filtered signal (red) are shown as a function of the depth in liver for 68Ga in a Petri dish. Twice the background noise is also reported for the three images (dashed lines). The thickness corresponding to the intersection of the signal and twice the background noise gives the depth in liver selected with the two filters. From these measurements, the depth selected by the 550-nm filter seems approximately 3 mm, while the 800 nm filter is still above detection limit at almost 7 mm depth.
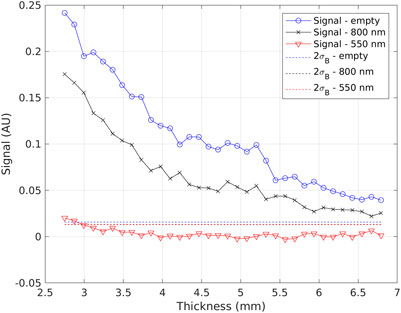
FIGURE 5. Example graph used to determine the depth in liver corresponding to the 550-nm and 800-nm short-pass filters. The full-spectrum signal (blue), the 800 nm-filtered signal (black), and the 550 nm-filtered signal (red) are shown as a function of the depth in liver. The dashed lines represent twice the background noise, chosen as detection limit (black and red lines can’t be distinguished).
Analysis of Clinical PET/CT Data
The injected activity, tumor volume (TLG) and diameter, total activity in the tumor at the time of PET/CT imaging and uptake are reported in Table 3, for liver metastases imaged with 18F-FDG and for NETs imaged with 68Ga-DOTATOC. Along with the average value among the 15 considered patients in each group, we report also the median, minimum and maximum values to highlight the large variability observed in the clinical scenario. The dimensions of field of view of the imaging system (60 × 60 × 6 mm) are compatible with typical dimensions of hepatic metastases. The last column of the Table reports the expected uptake at the time of intra-operative CLI, obtained by decay-correcting the uptake in the PET images, acquired 1 h post injection, and considering for our pilot study a delay between injection and CLI of 4 h. From the minimum values, to consider the worst case scenario, we observe that CLI should be sensitive to at least 5 kBq/cc of 18F and 1.6 kBq/cc of 68Ga.
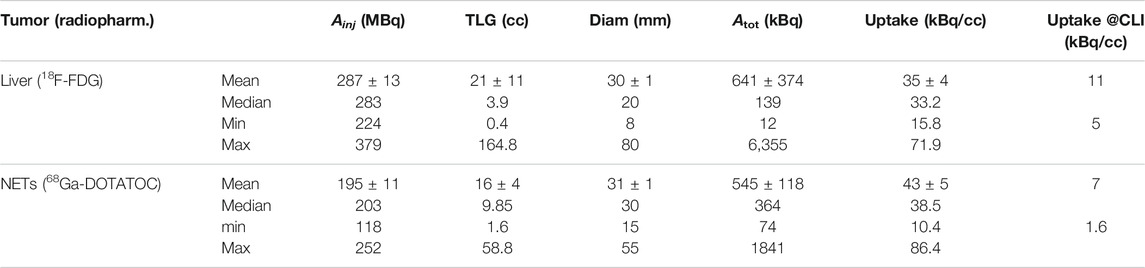
TABLE 3. Summary of the injected activity (
Discussion and Conclusion
In this paper we studied the sensitivity of CLI with 68Ga and 18F in the liver. Our goals were to understand if CLI can be sensitive enough for intra-operative imaging during hepatic metastasectomy, and what would be the maximum time delay allowed between radiopharmaceutical injection and CLI to still guarantee enough activity at the time of imaging.
By comparing first the detection limits in air in Table 2 with the mean and minimum clinical uptakes in Table 3 (last column), we see that for 68Ga the minimum clinical uptake value is (1.6 kBq/cc)/(1.21 kBq/cc) = 1.3× above the detection limit in the Petri, and the mean uptake is roughly 6× above the DL. Therefore, we can expect for 68Ga to provide enough sensitivity in most clinical cases. The ratios increase to 3× and 13×, respectively, if we assume the DL in agar to be more representative of the clinical situation, thus suggesting even better performance. On the contrary, with 18F the minimum clinical uptake is 5 kBq/cc, thus below the DL in air which is 12 and 18 kBq/cc for the two geometries, and the mean uptake of 11 kBq/cc is close to these DL values. Therefore, with 18F we can expect more false negatives in CLI, and this suggests us as an exclusion criteria for patients candidate to the use of 18F-FDG and showing low uptake in the pre-operative PET/CT scan.
If we then consider the DL values in tissue instead of air, at a depth of 2.5 mm, we see that 68Ga sensitivity is ∼2.9–3.5 kBq/cc, larger than the minimum clinical uptake but still 2–2.5× smaller than the typical value. Therefore, 68Ga should still provide enough sensitivity in most of the patients. For 18F-FDG, the amount of activity to inject should be at least 3 times the clinical standards to have enough signal at CLI. These results also suggest us that surgery and CLI should not be performed much later than 4 h after injection, in order for CLI to able to detect surgical margins. Another possible complication is light emission by soft tissues due to the laser excision of the specimen [15]. This phenomenon has been observed both in the breast and in the prostate, thus we expect a similar behavior also for the liver. Its result is the presence in the CLI images of diathermy artifacts, which appear as hot regions, much like positive surgical margins, thus complicating the image interpretation. Regarding the tissue background, it could also be argued that, to consider the worst case scenario, the background mean and standard deviation should not be taken in the specimen tray but in the neighboring tissue, because this is the dominant source of spurious background in the images, and it could be difficult in the clinical images to discriminate the hotspot from it. However, this background varies much with the proximity to the activity distribution, with the tissue thickness and with the tissue composition (e.g. presence of fat, gristle or holes), and this is even more important in clinical specimens, which have a variable radiopharmaceutical uptake. We chose to analyze and report the DL values with respect to the background outside the tissue because we wanted to find a quantitative and reproducible parameter to measure the DL values, and because in the clinical study what will determine if a hot spot is visible or not is the absolute signal coming from the hot spot, rather than its relative intensity with respect to the surrounding tissue.
In conclusion, the results of this study suggest that CLI with 68Ga should be able to detect surgical margins in most patients, while with18F the activities to inject in order to have enough signal-to-noise ratio should be larger than standards, or the time delay between injection and imaging largely reduced, resulting in a significant modification of the clinical protocol. The calculated attenuation coefficients for 68Ga, 0.45 mm−1 for the Petri geometry and 0.75 mm−1 for the agar phantom, allow to estimate the detection limits at various depths in the liver. The spectral measurements suggest that the 550-nm filter selects light coming from the first 3 mm, while the 800 nm filter collects light from depths as large as 7 mm. The results reported here have allowed us to optimize the protocol for the use of CLI for margin assessment of liver metastasis. The results of the pilot study will lead to a further refinement of this protocol. In the meanwhile, we believe that the results of this paper could be useful also to investigate other potential applications of CLI in the liver.
Data Availability Statement
The raw data supporting the conclusion of this article will be made available by the authors, without undue reservation.
Ethics Statement
Ethical review and approval was not required for the study on human participants in accordance with the local legislation and institutional requirements. The patients/participants provided their written informed consent to participate in this study.
Author Contributions
EC, PE, and NB conceived the study. SS and EC performed the measurements and the analysis, FB and AC prepared the radiopharmaceuticals and helped in the phantoms preparation. SV collected and analyzed the PET/CT images. EC wrote the manuscript. All authors revised it.
Conflict of Interest
The authors declare that the research was conducted in the absence of any commercial or financial relationships that could be construed as a potential conflict of interest.
Acknowledgments
EC would like to acknowledge Kunal Vyas, Maarten Grootendorst and David Tuch of LightPoint Medical for their feedback on our study and for the helpful discussions.
References
1. Ciarrocchi E, Belcari N. Cerenkov luminescence imaging: physics principles and potential applications in biomedical sciences. EJNMMI Phys (2017) 4(1):1–31. doi:10.1186/s40658-017-0181-8
2. Grootendorst MR, Cariati M, Kothari A, Tuch DS, Purushotham A. Cerenkov luminescence imaging (CLI) for image-guided cancer surgery. Clin Transl imaging (2016) 4(5):353–66. doi:10.1007/s40336-016-0183-x
3. Spinelli AE, Schiariti MP, Grana CM, Ferrari M, Cremonesi M, Boschi F. Cerenkov and radioluminescence imaging of brain tumor specimens during neurosurgery. J Biomed Opt (2016) 21(5):050502. doi:10.1117/1.JBO.21.5.050502
4. Grootendorst MR, Cariati M, Pinder SE, Kothari A, Douek M, Kovacs T, et al. Intraoperative assessment of tumor resection margins in breast-conserving surgery using 18F-FDG Cerenkov luminescence imaging: a first-in-human feasibility study. J Nucl Med (2017) 58(6):891–8. doi:10.2967/jnumed.116.181032
5. Heuvel J, van der Poel HG, Bekers EM, Grootendorst MR, Vyas KN, Slump CH, et al. 68Ga-PSMA Cerenkov luminescence imaging in primary prostate cancer: first-in-man series. Eur J Nucl Med Mol Imaging (2020) 47(11):2624–32. doi:10.1007/s00259-020-04783-1
6. Darr C, Harke N, Radtke JP, Yirga L, Kesch C, Grootendorst M, et al. Intraoperative 68Gallium-PSMA Cerenkov Luminescence Imaging for surgical margins in radical prostatectomy–a feasibility study. J Nucl Med (2020) 119:1500–06. doi:10.2967/jnumed.119.240424
7. Martínez-Cecilia D, Da Wicherts F, Cipriani GB, Barkhatov L, Lainas P, D’Hondt M, et al. Impact of resection margins for colorectal liver metastases in laparoscopic and open liver resection: a propensity score analysis. Surg Endosc (2020) 35:1–10. doi:10.1007/s00464-020-07452-4
8. Ciarrocchi E, Vanhove C, Descamps B, De Lombaerde S, Vandenberghe S, Belcari N. Performance evaluation of the LightPath imaging system for intra-operative Cerenkov luminescence imaging. Phys Medica (2018) 52:122–8. doi:10.1016/j.ejmp.2018.07.005
9. Olde Heuvel J, de Wit-van der Veen BJ, Vyas KN, Tuch DS, Grootendorst MR, Stokkel MR, et al. Performance evaluation of Cerenkov luminescence imaging: a comparison of 68Ga with 18F. EJNMMI Phys (2019) 6(1):17. doi:10.1186/s40658-019-0255-x
10. Nigri G, Petrucciani N, Debs T, Mangogna LM, Crovetto A, Moschetta G, et al. Treatment options for PNET liver metastases: a systematic review. World J Surg Oncol (2018) 16(1):142. doi:10.1186/s12957-018-1446-y
11. De Dosso S, Nucifora M, Sahnane N, Epistolio S, Riveiro ME, Bertolini V, et al. Detection rate of unknown primary tumour by using somatostatin receptor PET/CT in patients with metastatic neuroendocrine tumours: a meta-analysis. Endocrine (2019) 64:456–68. doi:10.1007/s12020-019-01934-9
12. Tan TH, Lee BN, Hassan SZA. Diagnostic value of 68Ga-DOTATATE PET/CT in liver metastases of neuroendocrine tumours of unknown origin. Nucl Med Mol Imaging (2014) 48(3):212–5. doi:10.1007/s13139-013-0258-9
13. Lee I, Paeng JC, Lee SJ, Shin CS, Jang JY, Cheon GJ, et al. Comparison of diagnostic sensitivity and quantitative indices between 68Ga-dotatoc PET/CT and 111 in-pentetreotide SPECT/CT in neuroendocrine tumors: a preliminary report. Nucl Med Mol Imaging (2015) 49(4):284–90. doi:10.1007/s13139-015-0356-y
14. Mitchell GS, Lloyd PNT, Cherry SR. Cerenkov luminescence and PET imaging of 90Y: capabilities and limitations in small animal applications. Phys Med Biol (2020) 65(6):065006. doi:10.1088/1361-6560/ab7502
Keywords: cerenkov luminescence imaging (CLI), image-guided surgery (IGS), margin assessment, detection limit, liver
Citation: Ciarrocchi E, Saponaro S, Bartoli F, Cataldi AG, Vitali S, Erba PA and Belcari N (2021) In-vitro Study for Cerenkov Luminescence Imaging Application in Hepatic Metastasectomy. Front. Phys. 9:635540. doi: 10.3389/fphy.2021.635540
Received: 30 November 2020; Accepted: 15 January 2021;
Published: 12 March 2021.
Edited by:
Antonello Enrico Spinelli, San Raffaele Scientific Institute, ItalyReviewed by:
Chongzhao Ran, Harvard Medical School, United StatesDaniele De Paula Faria, University of São Paulo, Brazil
Copyright © 2021 Ciarrocchi, Saponaro, Bartoli, Cataldi, Vitali, Erba and Belcari. This is an open-access article distributed under the terms of the Creative Commons Attribution License (CC BY). The use, distribution or reproduction in other forums is permitted, provided the original author(s) and the copyright owner(s) are credited and that the original publication in this journal is cited, in accordance with accepted academic practice. No use, distribution or reproduction is permitted which does not comply with these terms.
*Correspondence: Esther Ciarrocchi, ZXN0aGVyLmNpYXJyb2NjaGlAZGYudW5pcGkuaXQ=