
ORIGINAL RESEARCH article

Front. Phys., 15 April 2021
Sec. Soft Matter Physics
Volume 9 - 2021 | https://doi.org/10.3389/fphy.2021.637138

Cluster Morphology of Colloidal Systems With Competing Interactions

  • 1Facultad De Ciencias en Física y Matemáticas, Universidad Autonoma De Chiapas, Tuxtla Gutiérrez, México
  • 2NIST Center for Neutron Research, National Institute of Standards and Technology, Gaithersburg, MD, United States
  • 3Department of Chemical and Biomolecular Engineering, University of Delaware, Newark, DE, United States
  • 4División De Ciencias e Ingenierías, Campus León, Universidad De Guanajuato, León, México

Reversible aggregation of purely short-ranged attractive colloidal particles leads to the formation of clusters with a fractal dimension that only depends on the second virial coefficient. The addition of a long-ranged repulsion to the potential modifies the way in which the particles aggregate into clusters and form intermediate range order structures, and have a strong influence on the dynamical and rheological properties of colloidal dispersions. The understanding of the effect of a long-ranged repulsive potential on the aggregation mechanisms is scientifically and technologically important for a large variety of physical, chemical and biological systems, including concentrated protein solutions. In this work, the equilibrium cluster morphology of particles interacting through a short-ranged attraction plus a long-ranged repulsion is extensively studied by means of Monte Carlo computer simulations. Our findings point out that the addition of the repulsion affects the resulting cluster morphology and allows one to have a full control on the compactness or fractal dimension of the aggregates at a given thermodynamic condition. This allows us to manipulate the reversible aggregation process and, therefore, to finely tune the resulting building blocks of materials at large length scales.

1 Introduction

Many body systems composed of particles interacting via a short-range attraction and a long-range repulsion (SALR) have attracted attention in the past decade due to their rich phase behavior not observed for systems interacting with purely attractive potentials. One of these is the clustered fluid phase resulting from the frustration of the gas-liquid separation. This phase has been observed in experiments, as well as in molecular simulations, see, e.g., references [114]. Understanding the clustering of particles is necessary to explain changes in the dynamics and rheology of colloidal systems with competing interactions, see [15, 16].

The competition between attraction and repulsion over different length scales makes possible to have different phase diagrams depending on the parameters that control both the range and strength of each potential feature. [17] presented an empirical classification for systems with competing interactions based on the range of the repulsion and attraction. When the attraction range is smaller than 20% of the particle diameter σ and a repulsion range is slightly larger than that of the attraction, these systems are considered as type I system. Particles in type II systems have a longer range repulsion while the attraction range is similar to that of the type I systems. However, the range of the repulsion is still at the order of σ. Both the type I and II SALR systems have been studied see Table 1 in reference [17]. Type I and II systems present a similar phase diagram, which includes phases as: the dispersed fluid, clustered fluid, and percolated states. One difference of these two types of systems is that type I is believed to present a gas-liquid separation below the cluster temperature if the repulsion range is short enough, as is speculated by [17]. In type II systems, the repulsion prevents the equilibrium clustering of particles beyond some limit, see, e.g. [3]. In reference [11] it is found that it is possible to find a fluid-crystal coexistence in type II systems. Finally, a type III system the attraction range is much longer than that of type I and II systems, and comparable to σ with an even longer-ranged repulsion. For those systems, some theoretical study show that there can be some very interesting gas-liquid transition behavior, see, e.g., [18, 19].

In this work, we focus on the cluster morphology of type I systems, since the features of the interaction are more similar to the estimated potential for colloidal systems and protein solutions, see for example references [2, 4, 5, 2023]. Besides, the structural properties of clusters have not been studied systematically yet.

The phase diagram of particles with only short-ranged attractions has been studied intensively, see e.g. [2430]; and it is widely accepted that their thermodynamic behavior is determined by the extended law of corresponding states, [31]. In a similar spirit [10], proposed a generalized phase diagram for particles with competing interactions after studying type I and II systems through Monte Carlo computer simulations. According to the generalized phase diagram, particles at low and moderate concentrations form a dispersed fluid state at high temperatures, and an equilibrium clustered fluid state at temperatures below Tcref, where Tcref is the critical temperature of a reference system. Particles in the reference system interact through only the attractive part of the full SALR potential, the repulsive part, beyond σ, plays the role of a perturbation. At high enough concentrations, the dispersed fluid state percolates to form the random percolated state similar to particles with only attractions. However, when increasing the concentration, clustered fluid state can transition into a different percolating network, the cluster percolated state. Below the equilibrium clustered fluid state, it has been identified a non-equilibrium region related to the gel transition, [11]; but it is out of scope of the generalized phase diagram proposed by [10].

The manuscript is organized as follows. In Section 2, the interaction potential, as well as the computer simulation protocol are described. In Section 3, the structural signature of competing interaction systems is discussed and intimately related to the properties of clusters, which are studied in Section 5. Section 4 presents the phase diagram, where the region relevant for this work is explicitly pointed out. Finally, in section 6 the main conclusions of this work and some perspectives are presented.

2 Competing Interaction Potential and Monte Carlo Computer Simulations

We have performed extensive Monte Carlo (MC) computer simulations in the canonical ensemble NVT for a system made up of spherical particles with a diameter σ, interacting through a short-ranged attraction plus a long-ranged repulsion given by the expression,

u(r)={r<σϵσrλσAϵexp(κ(rλσ))r/σ0.1r>λσ(1)

the range and strength of the attraction are well determined by λ and ϵ, respectively, while the maximum repulsion strength (in units of ϵ) is given by A and the corresponding range is approximately κ1. The potential well is related to the reduced temperature by T*=kBT/ϵ, with kB being the Boltzmann’s constant and T the absolute temperature. This potential form was chosen because the contribution of the attraction, as well as the repulsion, are easily distinguishable. We have also chosen the range parameters as: λ=1.1 and κ=3 to have a simple representation of the interaction between proteins in aqueous solution, see, for example [10]. We are mainly interested in the effect of the repulsion strength on the structure and aggregate morphology. For that reason, we systematically vary the values of A=0.2, 0.5, 0.7 and 1.0.

MC computer simulations were carried out at the same packing fraction, ϕ=0.1; this is related with the number density ρ*=6ϕπ. We particularly chose this particle concentration to avoid the percolation threshold, which is reached when ϕ0.15, see [32, 33]. A typical simulation consists of 108 MC steps to reach the equilibrium and 108 extra MC steps to measure the structural properties of the system. At the lowest temperatures, additional MC steps where required to reach thermodynamic equilibrium; 109 MC steps before the structure was measured. In some simulations, we were not able to reach the equilibrium since particles tend to aggregate in large clusters, this situation is similar to the usual gas-liquid phase separation. In the Supplementary Material, we show the calculation of the binodal line; those results indicate that the non-equilibrium states observed in simulations are close to the binodal.

To characterize the microstructure, we calculate the so-called structure factor, S(q), which quantifies the density fluctuation correlations [34]. We have simulated a system of 11,000 particles to resolve the S(q) at small q-values, i.e., long wavelengths. Once the structure of a system was determined, the cluster size distribution, P(s), as well as the radius of gyration, Rg(s), were calculated. Those quantities represent the normalized probability of finding a cluster made of s particles and the corresponding effective radius. In this second calculation, the number of particles in the simulations was decreased to 4,000, since the computational cost of larger systems is quite expensive.

3 Structural Signature of the Intermediate Range Order Structures and Clustered Phase

The hallmark of many SALR systems, is found in the structure factor, [10]. The S(q) presents a peak at some q-value smaller than the typical one related to the correlation between pairs of particles, usually around 2π/σ. Such low-q peak has been observed in protein solutions, see, for example, [1, 2, 5, 15, 22]. However, this peak is not only due to the appearance of a clustered phase, but to a more general intermediate range order (IRO) structure, see [810, 22]. For example, the IRO peak has also been observed at high concentrations where particles are already forming a percolating network, see [8].

[10] defined the clustered fluid state as that thermodynamic state of a system at which the cluster size distribution, P(s), displays a well-defined peak or maximum around s20. This state is easily detected since P(s) decreases faster than a power law, when the system is below the percolation threshold. Also, according to [10] the clustered state is reached when the low q-peak takes a value above the critical value of 2.7. This empirical criterion works well for type II SALR systems, although there is not a physical explanation for such a value. Another criterion to identify the clustered phase has been proposed by [13] based on the value of the thermal correlation length.

In Figures 1A,B the structure factor for the systems with the lower repulsion, obtained through MC simulation (symbols) and by solving the Ornstein-Zernike equation with the Percus-Yevick closure (solid lines), is shown. In (A) it is also included the S(q) for the reference system, A=0 (dashed lines). The structure factor for A=0 and A=0.2 is equal for all temperatures considered, except for qσ<2, that means the repulsion is too weak to affect the short-ranged correlations at separations around σ but is large enough to break up the large-ranged correlations responsible of the gas-liquid phase separation, as q goes to 0. For the system with A=0.5, the low-q peak emerges as indicated in both simulation and theory, see Figure 1B. The localization of this peak shifts to lower values as T* is lowered. It is worth to mention that the theory does not agree with the simulation at low-q values however the information provided is useful to distinguish between systems close to the phase separation, panel (A) and systems with a true clustered phase, panel (B). In panel (B) the low-q peak for the lowest temperatures is close to the limit imposed to the periodic boundary conditions, but the theory can give the trend of simulation as it does at the highest temperatures.

FIGURE 1
www.frontiersin.org

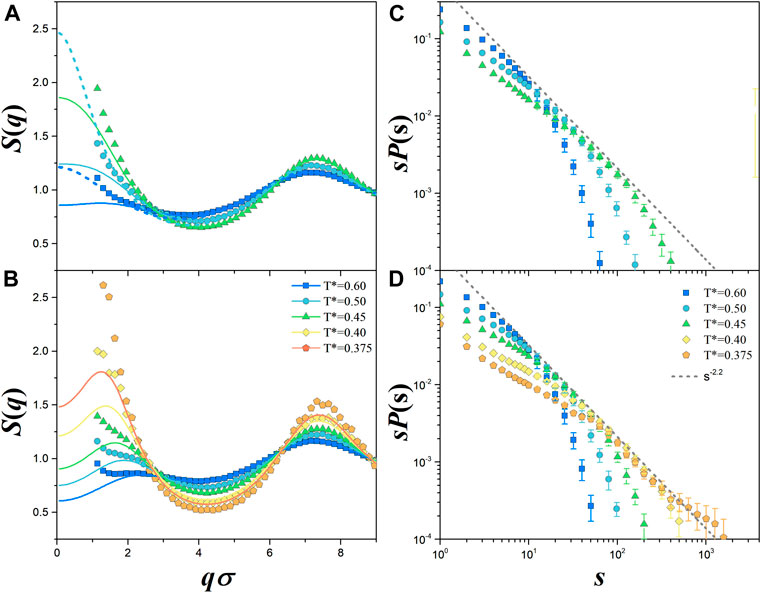
FIGURE 1. Structure factor for competing interaction systems whose repulsion strength is (A)A=0.2 and (B)A=0.5 at ϕ=0.1 and different temperatures. (C,D) display the cluster size distributions for (A,B), respectively. Computer simulation results are denoted by symbols, while solid lines are the theoretical solution of the Ornstein-Zernike equations with the Percus-Yevick closure. In (A) we also include the S(q) for the reference system the SW potential, i.e., A=0 (dashed lines). In (C,D) we also include P(s)s2.2 (solid line), the limit case for random percolation, see [35].

Figures 1C,D show the cluster size distribution for systems with A=0.2 and 0.5, respectively, where P(s) is multiplied by s to avoid the biasing to monomers. The probability of finding large clusters increases as the temperature gets lower, as expected, see [8]. For example, for the system with A=0.2 at T*=0.4, that is inside the phase separation region, the distribution presents two peaks, at s=1 and 4000 (data not shown). By increasing the repulsion strength to A=0.5, P(s) indicates that the probability of finding large clusters is higher for A=0.2 than for A=0.5, since the repulsion impedes the clustering. At T*=0.375 the distribution looks different than the one obtained for other temperatures. In fact, there is a small shoulder at around 60 particles, a value larger than the reported for the clustered phase in reference [10]. Also, for this temperature, the low-q peak exceeds the value of 2.5, which is closer to the expected for a clustered fluid. Then, this case is somehow in the middle of the full phase separation and the formation of a clustered phase. This observation thus indicates that for a type I SALR system, the transition temperature from a dispersed fluid state to a clustered fluid state may start shift away from the gas-liquid transition line for a reference potential system. This is qualitatively different from that of a type II SALR system. Hence, for the SALR system, the strength of the repulsion can affect the transition temperature from a dispersed fluid to the clustered fluid state.

The relationship between the low-q peak and the shoulder in sP(s) is clearer for the remaining cases. Figure 2 contains the same information as in Figure 1 for systems with A=0.7 and 1.0. At low temperatures, T*<0.375, the low-q peak of the structure factor is about 2.0, and the cluster size distribution in panels (C) and (D) present a shoulder between 20 and 30 particles, which indicates the formation of the clustered fluid. Here the maximum of the S(q) is not that close to the 2.7 threshold value, however systems are forming a clustered fluid. An important observation here is that at high s values the size distribution follows the power law P(s)s2.2 observed in random percolation and previously noted in reference [8]. Here, clusters must form larger clusters that eventually percolate in the cluster percolated phase, see reference [10].

FIGURE 2
www.frontiersin.org

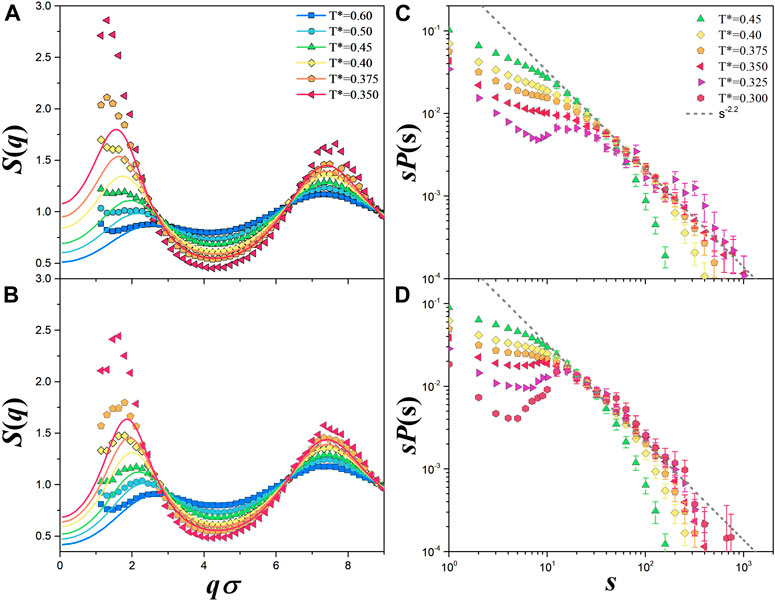
FIGURE 2. Structure factor for competing interaction systems whose repulsion strength is (A)A=0.7 and (B)A=1.0 at ϕ=0.1 and different temperatures. (C,D) show the corresponding cluster size distributions. Computer simulation results are denoted by symbols, while solid lines are the theoretical solution to the Ornstein-Zernike equation with the Percus-Yevick closure. In (C,D) we also include P(s)s2.2 (solid line), the limit case for random percolation, see [35].

4 Phase Diagram

In Figure 3A the phase diagram for the SW fluid with an interaction range λ=1.1 is displayed; it shows the gas-liquid coexistence (blue circles) and the percolation threshold (orange diamonds). The main effect having a repulsive potential coupled with the SW is either to lower the critical temperature or to inhibit the gas-liquid phase separation, favoring the formation of the so-called intermediate range order (IRO) structure, as is discussed in references [810]. For the lowest repulsion considered here, A=0.2, we did not observed the IRO peak, as well as the clustered phase, but for the larger repulsion the simulations predict the existence of the IRO peak at all temperatures considered.

FIGURE 3
www.frontiersin.org

FIGURE 3. (A) phase diagram for the SW fluid with λ=1.1, our reference system. Circles correspond to the gas-liquid phase separation taken from reference [29]; diamonds point out the percolation threshold, from reference [33]; using the extended law of corresponding states to map the SW with λ=1.05 data. (B) State for particles interacting through the full SALR potential, here we identify the dispersed fluid, the clustered fluid and those states in the phase separation, see Supplementary Material. (C) Snapshots corresponding to the yellow star for different repulsion strengths. Clusters are colored randomly to be easily identified. For clarity, clusters with 10 or more particles are the only ones displayed.

The information presented in the previous section allows us to establish the boundary between a disperse fluid, the clustered one and the phase separation. Nonetheless, the exact location of this boundary depends on the specific value of the repulsive potential, see Figure 3B. Competing interaction systems at low temperatures resemble the gas-liquid phase separation for A>0.2, however, it is difficult to establish this from the simulation results. In the Supplementary Material, we show the calculation of the binodal corresponding for different A-values by using an approximate perturbation approach developed by [36]. This approach predicts the occurrence of the gas-liquid phase separation for all repulsive potentials considered here, which agrees well with the proposal discussed in reference [17] concerning the phase diagram of type I SALR systems. For A=0.2, the separation is predicted at T*0.4, which agrees well with the findings of our simulations. Thus, the most interesting region to analyze the clustering is localized below the percolation threshold and at temperatures around the binodal, colored region in Figure 3A. This temperature window includes states where the systems could be either a disperse or a clustered fluid and close to the expected phase separation.

Figure 3C shows some snapshots of the simulated system at ϕ=0.1 and T*=0.45 for different values of A, this corresponds to the yellow star in (A). For clarity, only clusters with 10 and more particles are shown. The system with purely attractive particles, case A=0, presents the expected gas-liquid phase separation, a large cluster surrounded by small clusters and monomers. As the repulsion strength increases, the liquid phase disappears and a clustered phase emerges. It can be observed that the cluster morphology depend of the value of A as we will see below.

5 Cluster Morphology

The cluster morphology of competing interactions systems has been studied in experiments and simulations [13]. found that equilibrium clusters are more compact than those out of equilibrium. Experiments made by [7] indicate that cluster morphology is affected by the attractive contribution. Also [37], found that equilibrium clusters tend to be elongated structures. In a previous publication, [38]; we studied the morphology of clusters made of purely attractive particles at the same ϕ-value and for temperatures above the binodal. There, we found that the morphology of clusters with more than 10 particles is determined by the strength of the attraction via the second virial coefficient, while the morphology of small clusters is insensitive to the state of the system.

In this work, we have performed a systematic study of the cluster morphology. The radius of gyration is fitted using the equation: Rg=Cs1/df, where df is the well-known fractal dimension; this definition has been used to characterize the morphology in similar systems [39]. Figure 4 shows the results for systems at different temperatures and for repulsion strengths (A) A = 0.5 and (B) 1.0. It is worth to mention that we have only considered the Rg of clusters observed at least 100 times in the simulation to have a more reliable and accurate statistics. For A=0.5, systems at high temperatures follow a similar trend as the one observed for attractive particles. Small clusters have almost the same shape independent of the temperature and large clusters become more compact as the attraction becomes stronger, see Reference [38]. The changes in df of large clusters are smaller than the ones observed in systems with purely attractive interactions and clusters keep a fractal dimension close to 2.0.

FIGURE 4
www.frontiersin.org

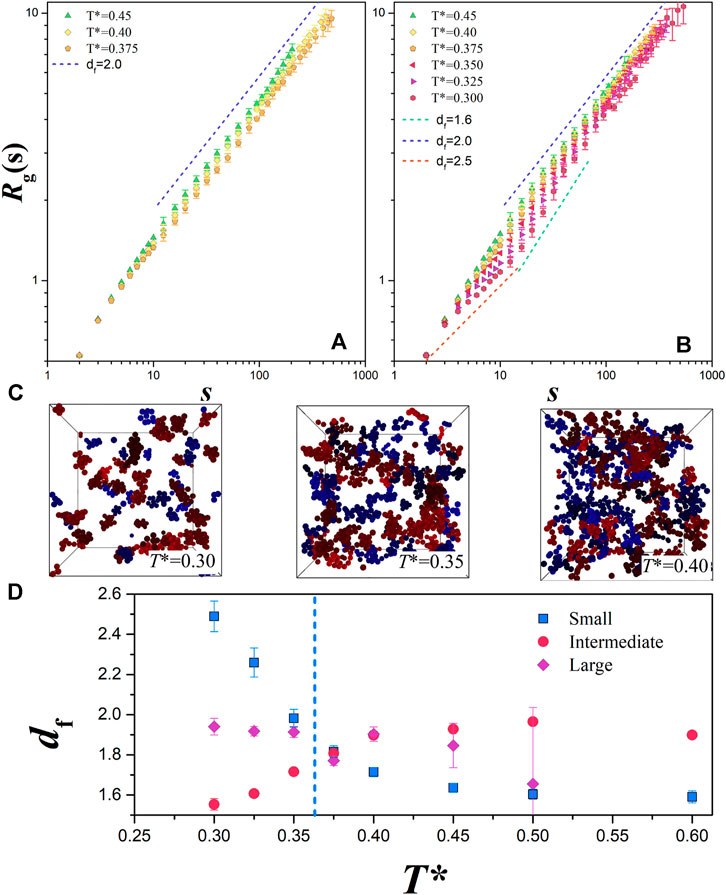
FIGURE 4. Radius of gyration for competing interaction systems at ϕ=0.1 with different repulsion strengths (A)A=0.5 and (B)A=1.0 at different temperatures. We plot, along the expected Rg, the radius of gyration for clusters with a fractal dimension of 2 (blue lines), 2.5 (red lines) and 1.6 (green lines). (C) Snapshots of the system with A=1.0 at different temperatures are displayed. Clusters with 5 up to 12 particles are colored in blue and clusters with 15s30 in red. (D) Fractal dimension for systems with A=1.0, we classify clusters in small (s12), intermediate (13s60) and large (s100), see [40]. Vertical line is the boundary between dispersed and clustered fluid.

From Figure 1 it was noted the presence of small shoulder at s60 particles, at the same value there is a small change in the slope of Rg; this behavior is more pronounced for the case A=1.0 where also the localization of the shoulder is shifted to s20. Such case is shown in 4 (B), the behavior or Rg is completely different from that reported in reference [38]. Firstly, the morphology of small clusters with less than approximately 15 particles becomes more compact as the temperature gets lower, the fractal dimension at the lowest temperature is around 2.5. Secondly, clusters with a larger number of particles, until 60, present a lower fractal dimension as the temperature gets lower. A similar morphology has been previously reported by [23]; they simulated a system of particles interacting through a potential fitted from experimental data for a lysozyme immersed in an aqueous solution. This means that at low temperatures compact clusters join together without merging completely, that makes possible the arrangement of these clusters in elongated structures with a lower fractal dimension, in agreement to [23]. It is important to note that for those clusters 2.5<2Rg/σ<4, this size is comparable with 1.5<qσ<2.5, which is the interval where the low-q peak was located. Finally, clusters with more than approximately 60 particles seem to have the same df, regardless the temperature of the system. The latter could be related to the fact that at all temperatures, the S(q) is very similar at low wavelengths, i.e., q0, see Figure 2B.

Figure 4C shows snapshots for systems with A=1.0 at different temperatures. In these cases, small clusters (5<s12) are colored in blue and intermediate clusters (15s30) in red. Small clusters at low temperatures tend to be compact structures, they are less compact as the temperature increases. The intermediate size clusters at low temperatures are still compact, but adopt an elongated configuration while at high temperatures some particles look as branches. Besides, at T*=0.4 small and intermediate clusters do not have a distinctive shape as for the lower temperatures, which agree with the fact that Rg does not change its slope at 15 particles. These qualitative observations are supported by the information given in Figure 4D. There, we have computed the fractal dimension of clusters at different temperatures, they are classified as small (s12), intermediate (13s60) and large (s100), this classification agrees with the different fractal regimes shown by [40]. Since the boundary between intermediate and large clusters does not have a well-defined location, we have decided to skip some of the data. From the figure, it is clear how small clusters become more compact as the temperature gets lower than T*=0.375, i.e., the boundary between the dispersed and clustered phases. Intermediate clusters become more elongated, while the morphology of large clusters only changes slightly.

6 Conclusion

In this work, we investigated the cluster formation for systems with competing interactions. The potential parameters were chosen to represent the interactions between proteins in an aqueous solution at low salinity. The analysis of the structure factor, as well as the cluster morphology, reveals that due to the addition of the long-ranged repulsion, the gas-liquid phase separation is shifted to lower temperatures compared with that of systems with pure attractive potential. For the case A=0.2, it was evident that the phase separation happens at T*=0.4 and there is no clearer IRO peak in the structure factor. For stronger repulsion, the development of the IRO states as indicated by the IRO peak is very obvious in the structure factor. And the cluster morphology showed more complex structures due to the competition of the attraction and repulsion. At the lowest temperature analyzed here, T*=0.35, the system with A=0.5 reached a non-equilibrium state, which made difficult to state if it is a gas-liquid phase transition or a non-equilibrium cluster phase. Systems with the largest repulsion strength remained in equilibrium within the simulation window.

The analysis of the cluster size percolation for systems in the clustered fluid state revealed that there is cluster formation with a preferential size in clustered fluid states. This optimal size depends also on the strength of the repulsive potential. Thus for the type I SALR systems, it is possible to produce clustered states with specific cluster size by controlling the potential parameters.

At the lowest temperatures for the stronger repulsion, particles are locally organized in very compact structures. Small clusters with less than 12 particles tend to adopt the minimum energy configuration, while intermediate size clusters have elongated configurations when these compact clusters join together with certain specific configurations. This cluster formation is different from that observed in systems made of purely attractive particles, [38]. For the SALR systems studied here, the scales at which the intermediate size clusters are observed can be related with the value at which the IRO peak appears in the structure factor. An interesting future work is the analysis of the dynamics of the clustering process at different concentrations in both the cluster fluid states and the cluster percolated states.

Data Availability Statement

The original contributions presented in the study are included in the article/Supplementary Material, further inquiries can be directed to the corresponding authors.

Author Contributions

All authors contributed to the design and implementation of the research, to the analysis of the results and to the writing of the manuscript.

Funding

NV-P acknowledges support by CONACyT through the scholarship Retenciones 2019–1. RC-P. also acknowledges the financial support provided by the Consejo Nacional de Ciencia y Tecnología (CONACYT, Mexico) through Grants Nos. 237,425 and 287,067. YL acknowledge the support by the Center for High Resolution Neutron Scattering (CHRNS), a partnership between the National Institute of Standards and Technology and National Science Foundation under Agreement No. DMR-1508249.

Conflict of Interest

The authors declare that the research was conducted in the absence of any commercial or financial relationships that could be construed as a potential conflict of interest.

Supplementary Material

The Supplementary Material for this article can be found online at: https://www.frontiersin.org/articles/10.3389/fphy.2021.637138/full#supplementary-material.

References

1. Baglioni P, Fratini E, Lonetti B, Chen SH. Structural arrest in concentrated cytochrome c solutions: the effect of pH and salts. J Phys Condens Matter (2004) 16:S5003. doi:10.1088/0953-8984/16/42/016

CrossRef Full Text | Google Scholar

2. Stradner A, Sedgwick H, Cardinaux F, Poon WCK, Egelhaaf SU, Schurtenberger P. Equilibrium cluster formation in concentrated protein solutions and colloids. Nature (2004) 432:492–495. doi:10.1038/nature03109

PubMed Abstract | CrossRef Full Text | Google Scholar

3. Sciortino F, Mossa S, Zaccarelli E, Tartaglia P. Equilibrium cluster phases and low-density arrested disordered states: the role of short-range attraction and long-range repulsion. Phys Rev Lett (2004) 93(5):055701. doi:10.1103/PhysRevLett.93.055701

PubMed Abstract | CrossRef Full Text | Google Scholar

4. Campbell AI, Anderson VJ, van Duijneveldt JS, Bartlett P. Dynamical arrest in attractive colloids: the effect of long-range repulsion. Phys Rev Lett (2005) 94(20):208301. doi:10.1103/PhysRevLett.94.208301

PubMed Abstract | CrossRef Full Text | Google Scholar

5. Cardinaux F, Stradner A, Schurtenberger P, Sciortino F, Zaccarelli E. Modeling equilibrium clusters in lysozyme solutions. Europhys Lett (2007) 77:48004. doi:10.1209/0295-5075/77/48004

CrossRef Full Text | Google Scholar

6. Toledano JCF, Sciortino F, Zaccarelli E. Colloidal systems with competing interactions: from an arrested repulsive cluster phase to a gel. Soft Matter (2009) 5:2390–8. doi:10.1039/B818169A

CrossRef Full Text | Google Scholar

7. Zhang TH, Klok J, Hans Tromp R, Groenewold J, Kegel WK. Non-equilibrium cluster states in colloids with competing interactions. Soft Matter (2012) 8:667–72. doi:10.1039/C1SM06570J

CrossRef Full Text | Google Scholar

8. Valadez-Pérez NE, Castañeda Priego R, Liu Y. Percolation in colloidal systems with competing interactions: the role of long-range repulsion. RSC Adv (2013) 3:25110–9. doi:10.1039/C3RA44588G

CrossRef Full Text | Google Scholar

9. Godfrin PD, Castañeda Priego R, Liu Y, Wagner NJ. Intermediate range order and structure in colloidal dispersions with competing interactions. J Chem Phys (2013) 139:154904. doi:10.1063/1.4824487

PubMed Abstract | CrossRef Full Text | Google Scholar

10. Godfrin PD, Valadez-Pérez NE, Castañeda Priego R, Wagner NJ, Liu Y. Generalized phase behavior of cluster formation in colloidal dispersions with competing interactions. Soft Matter (2014) 10:5061–71. doi:10.1039/C3SM53220H

PubMed Abstract | CrossRef Full Text | Google Scholar

11. Mani E, Lechner W, Kegel WK, Bolhuis PG. Equilibrium and non-equilibrium cluster phases in colloids with competing interactions. Soft Matter (2014) 10:4479–86. doi:10.1039/C3SM53058B

PubMed Abstract | CrossRef Full Text | Google Scholar

12. Sweatman MB, Fartaria R, Lue L. Cluster formation in fluids with competing short-range and long-range interactions. J Chem Phys (2014) 140:124508. doi:10.1063/1.4869109

PubMed Abstract | CrossRef Full Text | Google Scholar

13. Jadrich RB, Bollinger JA, Johnston KP, Truskett TM. Origin and detection of microstructural clustering in fluids with spatial-range competitive interactions. Phys Rev E (2015) 91:042312. doi:10.1103/PhysRevE.91.042312

CrossRef Full Text | Google Scholar

14. Santos AP, Pękalski J, Panagiotopoulos AZ. Thermodynamic signatures and cluster properties of self-assembly in systems with competing interactions. Soft Matter (2017) 13:8055–63. doi:10.1039/C7SM01721A

PubMed Abstract | CrossRef Full Text | Google Scholar

15. Riest J, Nägele G, Liu Y, Wagner NJ, Godfrin PD. Short-time dynamics of lysozyme solutions with competing short-range attraction and long-range repulsion: experiment and theory. J Chem Phys (2018) 148:065101. doi:10.1063/1.5016517

PubMed Abstract | CrossRef Full Text | Google Scholar

16. Ruiz-Franco J, Camerin F, Gnan N, Zaccarelli E. Tuning the rheological behavior of colloidal gels through competing interactions. Phys Rev Mater (2020) 4:045601. doi:10.1103/PhysRevMaterials.4.045601

CrossRef Full Text | Google Scholar

17. Liu Y, Xi Y. Colloidal systems with a short-range attraction and long-range repulsion: phase diagrams, structures, and dynamics. Curr Opin Colloid Interf Sci (2019) 39:123–36. doi:10.1016/j.cocis.2019.01.016

CrossRef Full Text | Google Scholar

18. Archer AJ, Wilding NB. Phase behavior of a fluid with competing attractive and repulsive interactions. Phys Rev E (2007) 76:031501. doi:10.1103/PhysRevE.76.031501

CrossRef Full Text | Google Scholar

19. Zhuang Y, Charbonneau P. Equilibrium phase behavior of the square-well linear microphase-forming model. J Phys Chem B (2016) 120:6178–88. doi:10.1021/acs.jpcb.6b02167

PubMed Abstract | CrossRef Full Text | Google Scholar

20. Shukla A, Mylonas E, Di Cola E, Finet S, Timmins P, Narayanan T. Absence of equilibrium cluster phase in concentrated lysozyme solutions. Pnas (2008) 105:5075–80. doi:10.1073/pnas.0711928105

PubMed Abstract | CrossRef Full Text | Google Scholar

21. Godfrin PD, Hudson SD, Hong K, Porcar L, Falus P, Wagner NJ. Short-time glassy dynamics in viscous protein solutions with competing interactions. Phys Rev Lett (2015) 115:228302. doi:10.1103/PhysRevLett.115.228302

PubMed Abstract | CrossRef Full Text | Google Scholar

22. Liu Y, Porcar L, Chen J, Chen WR, Falus P, Faraone A. Lysozyme protein solution with an intermediate range order structure. J Phys Chem B 115 (2011) 7238–47. doi:10.1021/jp109333c

PubMed Abstract | CrossRef Full Text | Google Scholar

23. Baumketner A, Cai W. Clusters of lysozyme in aqueous solutions. Phys Rev E (2018) 98:032419. doi:10.1103/PhysRevE.98.032419

CrossRef Full Text | Google Scholar

24. Dijkstra M. Phase behavior of hard spheres with a short-range yukawa attraction. Phys Rev E (2002) 66:021402. doi:10.1103/PhysRevE.66.021402

CrossRef Full Text | Google Scholar

25. Schöll-Paschinger E, Benavides AL, Castañeda-Priego R. Vapor-liquid equilibrium and critical behavior of the square-well fluid of variable range: a theoretical study. J Chem Phys (2005) 123:234513. doi:10.1063/1.2137713

PubMed Abstract | CrossRef Full Text | Google Scholar

26. Largo J, Solana JR, Yuste SB, Santos A. Pair correlation function of short-ranged square-well fluids. J Chem Phys (2005) 122:084510. doi:10.1063/1.1855312

CrossRef Full Text | Google Scholar

27. Pagan DL, Gunton JD. Phase behavior of short-range square-well model. J Chem Phys (2005) 122:184515. doi:10.1063/1.1890925

PubMed Abstract | CrossRef Full Text | Google Scholar

28. Espíndola-Heredia R, del Río F, Malijevsky A. Optimized equation of the state of the square-well fluid of variable range based on a fourth-order free-energy expansion. J Chem Phys (2009) 130:024509. doi:10.1063/1.3054361

PubMed Abstract | CrossRef Full Text | Google Scholar

29. Valadez-Pérez NE, Benavides AL, Schöll-Paschinger E, Castañeda Priego R. Phase behavior of colloids and proteins in aqueous suspensions: theory and computer simulations. J Chem Phys (2012) 137:084905. doi:10.1063/1.4747193

PubMed Abstract | CrossRef Full Text | Google Scholar

30. Orea P, Romero-Martínez A, Basurto E, Vargas CA, Odriozola G. Corresponding states law for a generalized Lennard-Jones potential. J Chem Phys (2015) 143:024504. doi:10.1063/1.4926464

PubMed Abstract | CrossRef Full Text | Google Scholar

31. Noro MG, Frenkel D. Extended corresponding-states behavior for particles with variable range attractions. J Chem Phys (2000) 113:2941–4. doi:10.1063/1.1288684

CrossRef Full Text | Google Scholar

32. Heyes DM. Monte Carlo simulations of continuum percolation of 3d well fluids. J Phys Condens Matter (1990) 2:2241–9. doi:10.1088/0953-8984/2/9/013

CrossRef Full Text | Google Scholar

33. Wei J, Xu L, Song F. Range effect on percolation threshold and structural properties for short-range attractive spheres. J Chem Phys (2015) 142:034504. doi:10.1063/1.4906084

PubMed Abstract | CrossRef Full Text | Google Scholar

34. Hansen JP, McDonald IR. Static properties of liquids: thermodynamics and structure. 4th ed. Oxford: Academic Press (2013). 61–104 p.

CrossRef Full Text

35. Stauffer D. Scaling theory of percolation clusters. Phys Rep (1979) 54:1–74. doi:10.1016/0370-1573(79)90060-7

CrossRef Full Text | Google Scholar

36. Benavides AL, Gil-Villegas A. The thermodynamics of molecules with discrete potentials. Mol Phys (1999) 97:1225–32. doi:10.1080/00268979909482924

CrossRef Full Text | Google Scholar

37. Kowalczyk P, Ciach A, Gauden P, Terzyk A. Equilibrium clusters in concentrated lysozyme protein solutions. J Colloid Interf Sci (2011) 363:579–84. doi:10.1016/j.jcis.2011.07.043

CrossRef Full Text | Google Scholar

38. Valadez-Pérez NE, Liu Y, Castañeda Priego R. Reversible aggregation and colloidal cluster morphology: the importance of the extended law of corresponding states. Phys Rev Lett (2018) 120:248004. doi:10.1103/PhysRevLett.120.248004

PubMed Abstract | CrossRef Full Text | Google Scholar

39. Sciortino F, Tartaglia P, Zaccarelli E. One-dimensional cluster growth and branching gels in colloidal systems with short-range depletion attraction and screened electrostatic repulsion. J Phys Chem B (2005) 109:21942–53. doi:10.1021/jp052683g

PubMed Abstract | CrossRef Full Text | Google Scholar

40. Ruiz-Franco J, Zaccarelli E. On the role of competing interactions in charged colloids with short-range attraction. Annu Rev Condens Matter Phys (2021) 12:51. doi:10.1146/annurev-conmatphys-061020-053046

CrossRef Full Text | Google Scholar

Keywords: competing interactions, reversible aggregation, clustering, cluster morphology, fractal dimension

Citation: Valadez-Pérez NE, Liu Y and Castañeda-Priego R (2021) Cluster Morphology of Colloidal Systems With Competing Interactions. Front. Phys. 9:637138. doi: 10.3389/fphy.2021.637138

Received: 02 December 2020; Accepted: 03 February 2021;
Published: 15 April 2021.

Edited by:

Giancarlo Ruocco, Italian Institute of Technology (IIT), Italy

Reviewed by:

Emanuela Zaccarelli, National Research Council (CNR), Italy
Patrick Charbonneau, Duke University, United States

Copyright © 2021 Valadez-Pérez, Liu and Castañeda-Priego. This is an open-access article distributed under the terms of the Creative Commons Attribution License (CC BY). The use, distribution or reproduction in other forums is permitted, provided the original author(s) and the copyright owner(s) are credited and that the original publication in this journal is cited, in accordance with accepted academic practice. No use, distribution or reproduction is permitted which does not comply with these terms.

*Correspondence: Néstor E. Valadez-Pérez, nestor.valadez@unach.mx, enextv@gmail.com

Download