 Pascuala García-Martínez1*
 Ignacio Moreno2,3
 María del Mar Sánchez-López2,4
 Jordi Gomis3
 Pedro Martínez3
 Aarón Cofré3
- 1Departamento de Óptica, Facultat de Física, Universitat de València, Burjassot, Spain
- 2Instituto de Bioingeniería, Universidad Miguel Hernández de Elche, Elche, Spain
- 3Departamento de Ciencia de Materiales, Óptica y Tecnología Electrónica, Universidad Miguel Hernández de Elche, Elche, Spain
- 4Departamento de Física Aplicada, Universidad Miguel Hernández de Elche, Elche, Spain
Supercontinuum (SC) lasers combine a broadband light spectrum with the unique properties of single-mode lasers. In this work we present an optical system to spectrally filter a SC laser source using liquid-crystal on silicon (LCoS) spatial light modulators (SLM). The proposed optical system disperses the input laser and the spectrally separated components are projected onto the LCoS-SLM, where the state of polarization of each wavelength is separately modulated. Finally, recombining the modulated spectral components results in an output laser source where the spectrum can be controlled dynamically from a computer. The system incorporates two branches to independently control the visible (VIS) and the near infrared (NIR) spectral content, thus providing a SC laser source from 450 to 1,600 nm with programmable spectrum. This new ability for controlling at will the wide spectra of the SC laser sources can be extremely useful for biological imaging applications.
Introduction
A wide range of applications from biological and biomedical microscopic imaging requires a use of SC laser sources. They are characterized by an extremely broad spectral coverage from ~400 to 2,400 nm emitted as a continuum with an integrated power of up to several watts (even tens of watts), and at the same time a perfect Gaussian single-mode beam which can be focused down to the diffraction limit. This gives rise to a brightness that can exceed conventional light sources by more than six orders of magnitude, while staying within the spatial resolution regime of optical microscopy if needed [1]. Those sources have found many applications in a variety of fields of microscopy such as confocal microscopy [2] and STED microscopy [3].
In addition, SLMs are useful devices for advancing microscopy technology and they have been employed to control the imaging performance of many optical microscopes [4, 5]. In fact, a SLM can have different functions in a microscope, going from controlling the illumination by displaying a diffractive optical element (DOE) that structures and shapes the illumination beam, or/and acting on the imaging path of the microscope, by manipulating the Fourier components of the light coming from the sample [4, 6].
In many optical systems, the possibility of controlling light source spectra is an interesting subject. Some efforts have been done in solar simulators using a supercontinuum laser to implement tuning spectra using static opaque masks as mobile elements for spectral shaping [7] or use a programmable liquid crystal (LC) SLMs to rapidly generate an arbitrary spectrum [8]. However, the visible range is lost due to the poor laser emission in this wavelength range.
Some years ago, we presented an optical system based on a LCoS-SLM that acts as a waveplate with a programmable spectral retardance function in the visible wavelength range which is controlled via the voltage signal which depends on the addressed gray level of the LCoS panel [9]. The proposed optical system was probed experimentally through different examples, which include broadband constant phase-shift retarders, and retardance bands of variable bandwidth and variable central wavelength. A great number of applications, such as hyperspectral imaging, spectral polarimetry, ellipsometry, interferometry or colorimetry, among others, can benefit from this control.
In this work, we extend our previous optical system shown in Moreno et al. [9] to a programmable spectra light source generation by extending the spectral range to include also the near infrared (NIR) region and so being able to generate any desired spectra. This spectral extension is accomplished taking profit of the light beam reflected at the beam splitter in the system to include a second arm that is modulated by a second LCoS-SLM operational at the NIR wavelength range. In fact, the extension to NIR light could be very important in different areas, like optical fiber communications, with standard windows operating at 980 nm, 1,330 m, and 1,550 nm [10], or in biomedical imaging, where the conventional therapeutical windows are centered at ranges of 650–950 nm (first window) or 1,100–1,350 nm (second window) [11]. Using techniques like Optical Coherence Tomography (OCT), the penetration in biological tissues has been demonstrated to increase with larger wavelengths, ranging from only hundreds of microns in the shorter wavelength region of the visible spectrum (about 450–550 nm) to about 1–2 mm in the mid infrared (1,300–1,500 nm) [12]. Thus, a broadband laser source system where the spectrum can be designed and tuned in real time can be extremely interesting also for these applications.
The paper is organized as follows: after this introduction, Section “Experimental System” describes the VIS-NIR programmable SC laser spectrum generator system; then Section “Calibration Procedure” explains the explains the adjustments required to achieve good results; Section “Experimental Results” includes experiments that demonstrate the effective generation of different spectral content in the laser source; finally, Section “Conclusions” concludes the work.
Experimental System
The optical setup scheme is shown in Figure 1. The input light is a supercontinuum laser beam from Fianium (model SC400). This light source emits a broadband laser beam with continuous broadband spectrum from 400 nm to more than 1,800 nm. The beam is first polarized by a Glan-Taylor linear polarizer useful in this complete spectral range (Edmund Optics #89–547), with an orientation of 45° with respect to the horizontal direction in the laboratory framework. Then, it is directed onto a non-polarizing beam splitter (BS) that splits light into two arms. One arm is used to modulate each of the two spectral regions: VIS and NIR ranges, respectively. Then, each arm has the same optical scheme. First, the light beam traverses a blazed grating that disperse the input light. The first diffraction order, where the gratings show the highest efficiency, passes through an achromatic converging lens that produces a collimated beam that projects the dispersed light beam into the LCoS-SLM panel. We use two SLMs from Hamamatsu, models X10468-01 and X10468-08, specifically designed to be used for VIS and NIR, respectively. Both devices are parallel-aligned LCoS devices, i.e., they are pixelated linear retarders whose retardance at each pixel is controlled from a computer [13]. The applied voltage, and hence the retardance, is controlled using grayscale images with 8-bit encoding, allowing 256 levels. The LC director is oriented along the horizontal direction in both SLMs. Because the LC director axis forms 45° with the input polarization, the state of polarization is modulated on the reflected light as a function of the retardance applied by the LCoS-SLM. The modulated reflected beams follow then the reverse path, and the lens and the grating recombine all the spectral components again on the first diffraction order. This recombined beam propagates towards the BS where the two VIS and NIR beams merge again in a single output beam. A second Glan-Taylor linear polarizer is placed at the output, also oriented at 45°, which transforms the polarization modulation induced by the LCoS-SLMs onto irradiance modulation, thus generating a desired spectral filtering on the SC spectrum.
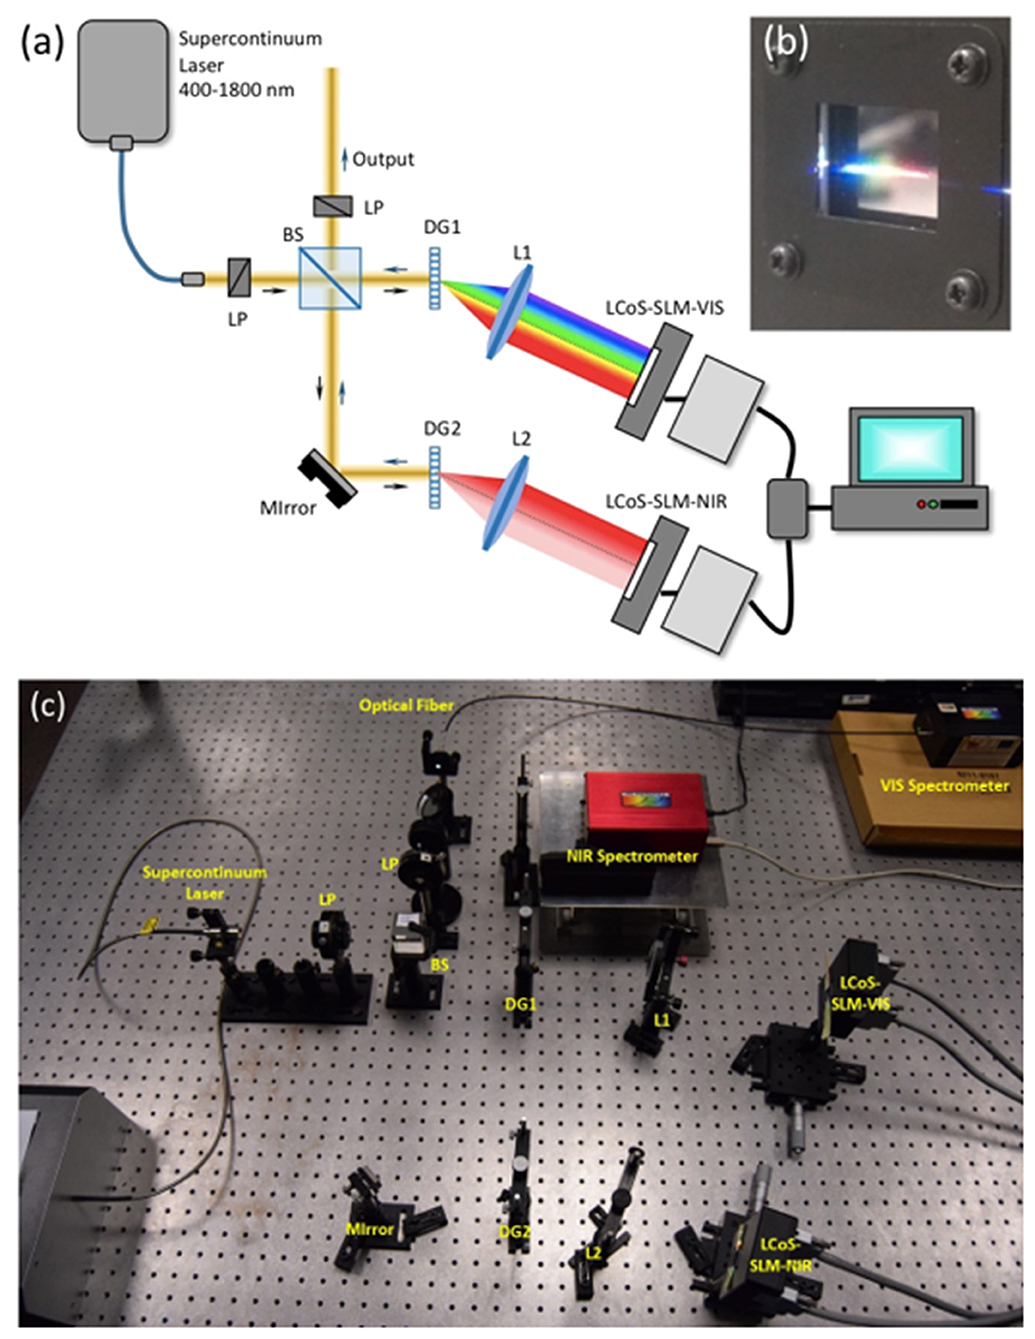
Figure 1. (a) Scheme of the VIS-NIR spectrum generator; LP, linear polarizer; BS, beam-splitter; DG, blazed diffraction grating; L, converging lens. (b) Picture of the dispersed visible SC beam projected onto the VIS-LCoS-SLM. (c) Picture of the complete system.
The spectrum of the output beam is registered with two spectrometers, a Stellar-Net Black-Comet STN-BLK-C-SR-25 model that can measure between 200 and 1,080 nm, and another Stellar-Net STE-RED-WAVE-NIR-512-25 model that can measure between 900 and 2,300 nm. A mirror mounted on an adjustable flip platform is used to direct the beam to one or the other spectrometer. A diffuser is placed before the spectrometer entrance, to avoid damaging the detectors.
Calibration Procedure
However, prior to be used, the system must be calibrated, since the SLM retardance depends on the wavelength and on the applied voltage. This means that one must carefully adjust the LCoS array to display the desired retardance for the wavelength illuminating each pixel. Therefore, it is necessary to determine the device retardance Φ(λ, g) both as a function of the wavelength (λ) and as a function of the addressed gray-level signal (g). This function follows the typical relation of a single anisotropic LC layer, i.e., Φ(λ, g) = (2π/λ)Δn·d, where d is the thickness of the LC layer and Δn(g) is its effective birefringence, which depends on the addressed signal.
Since the input polarizer has the transmission axis oriented at 45° with respect to the LC director axis, if the output polarizer is parallel to the first one, the ideal output normalized irradiance transmission for parallel polarizers would be given by where imax indicate the maximum transmission [14]. This relation allows calibrating the spectral retardance Φ(λ) in the SLM by measuring transmission t(λ). Measurements show a typical oscillating spectrum vs. λ that can be fitted, typically with a Cauchy type relationship, to derive the retardance function for different applied voltages, as detailed in [9, 14]. Some other secondary rapid oscillations typically appear in the spectrum, due to Fabry-Perot type interferences generated at the different layers in the SLM device. Other polarization changes can occur at the different elements in the system. Nevertheless, all these effects can be considered to achieve a better fit, as detailed in [15]. The procedure has been applied successfully in many liquid-crystal devices, for precisely calibrating its modulation properties in the VIS spectral range [16], but also in the NIR range [17].
As a result of this calibration we obtain, for each gray level g addressed from the computer, functions that provide the spectral retardance Φ(λ, g) in the SLM, and the corresponding spectral irradiance i(λ, g) at the output beam. Once this information was processed, we obtain a table of correspondence between retardance, wavelength and addressed gray level, which makes possible to define a gray level function g(λ) that generates the desired spectral retardance Φ(λ) that provides a desired spectral irradiance i(λ) at the output beam [9].
Another second important calibration requirement is an accurate determination of the spatial location on the SLM panels where each wavelength is impinging. As we see in Figure 1b, when separating the wavelengths with the diffraction grating and projecting on the SLM screen, a horizontal light beam strikes in which the different wavelengths are separated. Note that this is a requirement to be able to generate any arbitrary desired spectra i(λ) since in this way we can control the retardance applied to each wavelength individually. Therefore, another very relevant calibration of the system consists in determining the mapping function x = f(λ) that relates the wavelength λ with the pixel location x where this wavelength λ impinges. This calibration is obtained by displaying in the SLM again a uniform gray-level image, but now with a very narrow vertical bar with a different gray level. Such a narrow bar affects only a narrow spectral band, which can be easily identified in the spectrometer measurement.
Finally, as a result, if an output spectrum function defined as i(λ) is desired at the output, a corresponding gray-level function g(x) is calculated that must be addressed to the SLM to generate it. Note that the images addressed to the SLM are one-dimensional functions with variations only along the x direction. We refer the reader to our previous works [9, 14–17] to obtain more details about all these calibration procedures, and here we rather concentrate on the obtained results with the VIS-NIR spectral generator.
Experimental Results
In this work we applied this full procedure for both the VIS and the NIR SLMs, so we can extend the range in which the function i(λ) can be designed. For that purpose, we generate two gray-level images, one for the VIS-SLM that controls the spectrum between 450 and 800 nm, and another for the NIR-SLM, that controls the spectrum between 900 and 1,400 nm. Note that we have a gap between 800 and 900 nm; these wavelengths lie outside the active area of the two SLMs are therefore are not contributing to the final output beam. However, we selected this configuration to be able to extend the function i(λ) to cover most of the AM1.5 solar spectrum [7].
Minimum and Maximum Spectra
The first results, presented in Figure 2a, show the spectral functions i0(λ) and i1(λ) that correspond to the minimum and maximum irradiance, respectively. An image g0(x) like shown in Figure 2b is addressed to the VIS-SLM, where the gray-level values at each location has been assigned to provide at the output a polarization as close as possible to be linear and oriented at −45° for all wavelengths. In this way the light is completely absorbed by the output polarizer and a null transmission is expected. Considering that the input polarizer is oriented at +45°, this implies that the system must operate as a half-wave retarder for all wavelengths. Note that the pattern g0(x) in Figure 2b is a continuous slow varying gray function along the horizontal direction, where the light spectrum has been dispersed (Figure 1b). Since the retardance, for a given gray-level, depends on the wavelength, the gray level mask g0(x) must show this above-mentioned variation to provide a constant half-wave retardance for all wavelengths. A similar function is addressed to the NIR-SLM, adapted to the modulation characteristics of this SLM.
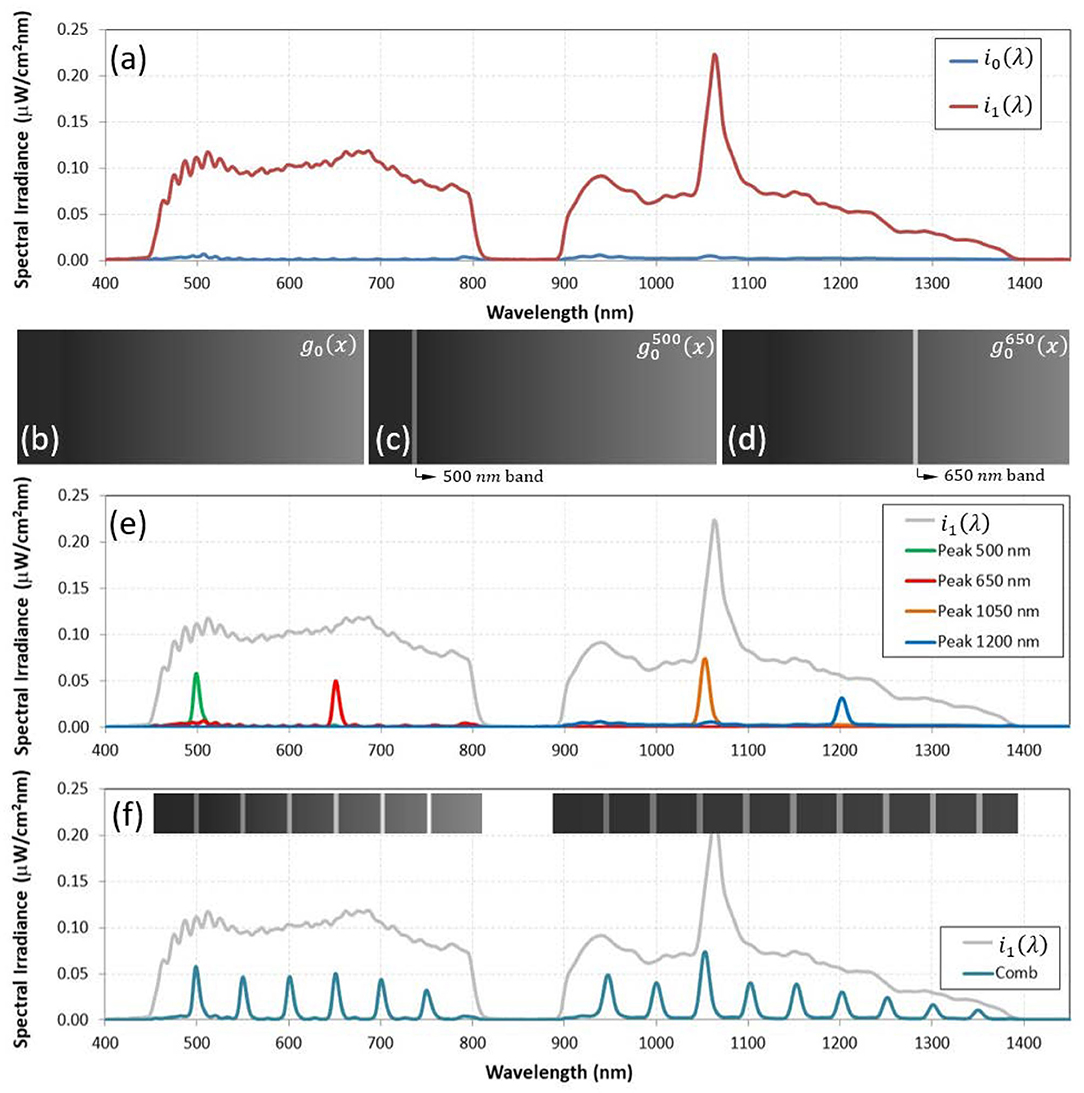
Figure 2. (a) Experimental measurements of the minimum i0(λ) and maximum i1(λ) spectra. (b) Gray level function g0(x) generating i0(λ). (c) Gray level function generating the narrow band at 500 nm. (d) Gray level function generating the narrow band at 650 nm. (e) Experimental measurements for narrow bands centered at 500, 650, 1,050, and 1,200 nm. (f) Experimental measurements for a wavelength comb spectrum.
Similarly, another gray-level image g1(x) is designed to generate the maximum spectrum i1(λ). In this case, the SLM must retain the input polarization linear oriented at +45° for all wavelengths, so it is fully transmitted by the output polarizer, delivering the maximum irradiance in the full spectrum. Therefore, the system must operate as a full-wave retarder for all wavelengths.
The results in Figure 2a verifies the good extinction expected for i0(λ) for all wavelengths, and the generation of a broadband spectrum i1(λ) that represents the upper bound of the different spectra than can be generated in the system. The experimental i1(λ) curve shows a value around 0.10 mW/(cm2nm) in the complete spectrum from 450 to 1,400 nm, except for the non-accessible gap between 800 and 900 nm. A strong peak is entered at 1,064 nm, corresponding to the pump laser originating the SC continuum emission. Some rapid oscillations are also observed for low wavelengths, corresponding to Fabry-Perot interference effects in the VIS-SLM, which are more noticeable in this short wavelength range. These two spectra i1(λ) and i0(λ) are therefore the maximum and minimum bounds where we can control the output light. We measured an average signal-to-noise ratio SNR = i1/i0 > 50.
Specific Narrowband Wavelength Selection and Wavelength Combs
In many situations it is very interesting to achieve a light source where a narrow spectral band can be selected. This is a typical case in many biological samples that can show certain phenomenon (absorption, changes in their atomic structures, etc.) when illuminated by specific wavelengths. In Figure 2e we illustrate the possibilities offered by the developed system showing the spectral measurements when narrow spectral peaks are selected art wavelengths of 500, 650, 1,050, and 1,200 nm, respectively. The figure includes also the i1(λ) spectrum for comparison, that reveals that we are not reaching the maximum possible transmission. We attribute this effect to the fact that the laser spot on the SLM is larger than the pixel size, and some wavelength crosstalk happens. Nevertheless, the measured spectra show a successful generation of narrow bands centered at the expected wavelengths.
Figures 2c,d illustrate the gray-level masks and that are addressed in this case to the VIS-SLM device to generate the peaks at 500 and 650 nm, respectively. In each mask, a narrow vertical band substitutes the original values of g0(x) by those of g1(x), thus providing the high transmission in this narrow spectral band. Laterally shifting this band in the gray-level mask provides the wavelength shift in the spectrum. In order to clearly show the effect, these results show narrow bands of 10 pixels width around the central selected wavelength, which give a spectral width on the basis between 10 and 20 nm, depending on the central wavelength. Further reduction in the number of pixels in the band results in narrower but weaker spectral bands.
Figure 2f shows the generation of a wavelength comb spectrum, where one such narrow band peak is added every 50 nm, both in the VIS and in the NIR regions of the spectrum. The inset illustrates the two gray-level masks that are addressed to the two SLMs, each one composed of the corresponding g0(x) function background with the narrow bands corresponding to each peak in the spectrum.
Spectral Passband Illumination and Solar Spectrum
Spectral bandpass illumination is also interesting in many applications, including fluorescence or colorimetry. Figure 3a shows the experimental measurements obtained for different bandpass spectra starting at 450 nm and in 900 nm, respectively, with the cut-off wavelengths centered at 500 and 650 nm in the VIS region, and at 1,050 nm and 1,200 nm in the NIR region. Figures 3b–d illustrate the gray-level masks that are addressed to the VIS-SLM. Figure 3b shows the mask g1(x) that generates the maximum spectrum i1(λ). Note that it also presents a continuous gray-level variation, but with different values compared to the function g0(x) in Figure 2b, since g1(x) must provide a full wave retardance for all wavelengths. Figures 3c,d are the gray level masks and that generate the bandpass spectra with cut-off at 500 and 650 nm, respectively. Now, in each mask, the function g1(x) is used until the spatial location corresponding to the cut-off wavelength, where the mask is selected to the function g0(x) that provides the null transmission shown in Figure 2b. The transitions between the gray level masks g1(x) and g0(x) have been marked in Figures 3c,d when the cut-off wavelength is selected at 500 and 650 nm, respectively.
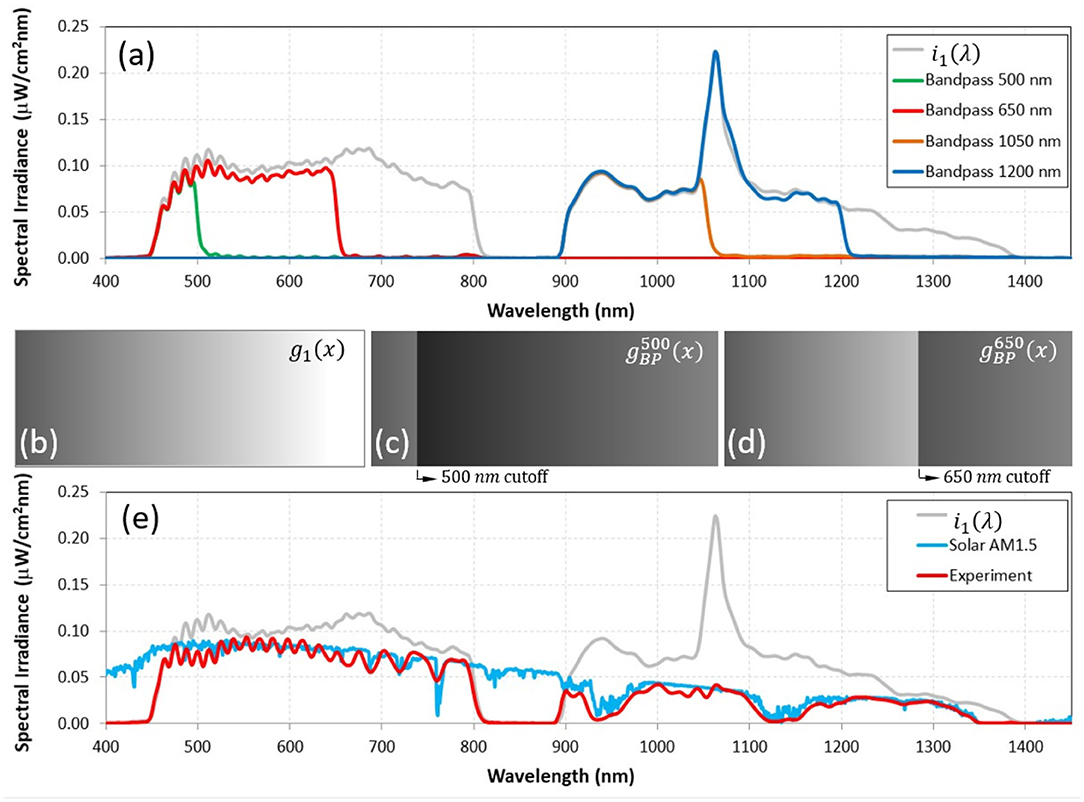
Figure 3. (a) Experimental measurements for low bandpass illumination with cutoff wavelengths at 500, 650, 1,050, and 1,200 nm. (b) Gray level function g1(x) generating i1(λ). (c) Gray level function generating the bandpass at 500 nm. (d) Gray level function generating the bandpass at 650 nm. (e) Comparison of the solar AM1.5 spectrum with its experimental reproduction on the supercontinuum laser.
As a final example, in Figure 3e we have simulated the solar AM1.5 spectrum. Solar simulators are of great interest in photovoltaics [7] or in precision agriculture [18] applications. We have calculated the gray-scale image that best matches this solar spectrum within the limits imposed by the maximum available irradiance i1(λ). The graphs in Figure 3e shows the AM1.5 spectrum that we try to reproduce and the effective generation on the supercontinuum laser. Despite the oscillations observed in the visible region, and the bands below 450 nm and the gap between 800 and 900 nm, which are not accessible in the system, the rest of the spectrum shows a rather good reproduction of the solar AM1.5 curve. The ripple in the visible spectrum might be due to the Fabry-Perot effects that this SLM suffers, or to other electronic based effects like the pixel crosstalk caused by fringing in the LC layer. Nevertheless, the solar spectrum is well-reproduced in the VIS and in the NIR ranges, including the characteristic H2O absorption bands around 940 and 1,140 nm.
To illustrate the possible potential use of this illumination system in microscopy. Figure 4 shows some images captured in a conventional bright field microscope, where the illumination system has been substituted by the light output of the spectral generator system, which is delivered to the microscope with an optical fiber. A 10X objective is employed and the sample is a hair. The metallic needle that is also present in the image is located in the microscope intermediate image. The images correspond to illumination of the sample with the solar spectrum (Figure 4a), with two narrow band illuminations centered at 500 and 475 nm (Figures 4b,c), and finally for a low band-pass illumination with cut-off at 550 nm. In this case, we used a regular RGB camera, so the spectral changes can be visualized in the change of color of the background. These results show the potentials of the system for multispectral, hyperspectral, or even more complicated structured spectral illumination.
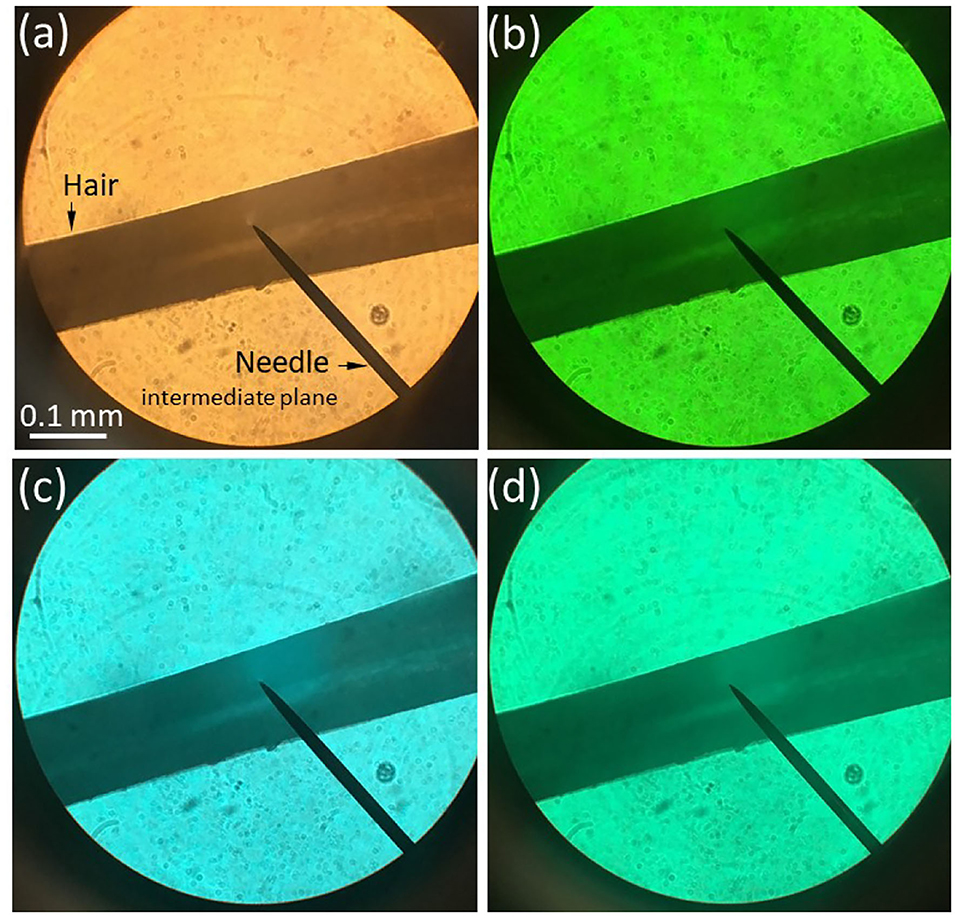
Figure 4. Imaging in a conventional microscope illuminated with light output from the spectrum generator system. (a) Solar spectrum. (b) Narrowband illumination centered at 500 nm. (c) Narrowband illumination centered at 475 nm. (d) Lowpass illumination with cut-off centered at 550 nm.
Conclusions
In summary, an optical system for generating laser light spectra with a programmable spectral distribution is presented. One of our main motivation is to implement light sources at will for microscopic and biological imaging. The programmable part of our systems comes from the use of SLMs that can change retardance, and so irradiance, in real time. We proposed a complete system that covers both visible and near-infrared wavelength regions. In fact, there is a great interest in extending to NIR the technique because of its application in bio-samples imaging, where it increases the penetration in biological tissue.
Note that one of the great limitations of our system is the reduced light efficiency, due to the use of diffraction gratings, beam splitters, polarizers, as well as the losses in the SLMs. These limitations can be reduced by optimizing some of the optical elements such as diffracting grating and beam splitters.
Data Availability Statement
The original contributions generated for this study are included in the article/supplementary material, further inquiries can be directed to the corresponding author/s.
Author Contributions
JG and PM were two master students that did the optical experiments under the supervision of IM. AC was a doctorate student under the supervision of IM and MS-L. PG-M was a visitors professor at the University Miguel Hernandez of Elche that was collaborating in the experiment. PG-M, MS-L, and IM wrote the paper. All authors contributed to the article and approved the submitted version.
Funding
This work has been financed by Generalitat Valenciana, Conselleria d'Educació, Investigació, Cultura i Esport (PROMETEO-2017-154) and by Ministerio de Ciencia, Innovación y Universidades, Spain (RTI2018-097107-B-C33).
Conflict of Interest
The authors declare that the research was conducted in the absence of any commercial or financial relationships that could be construed as a potential conflict of interest.
References
1. Granzow N. Supercontinuum white light lasers: a review on technology and applications. Photonics Educ Meas Sci. (2019) 11144:1114408. doi: 10.1117/12.2533094
2. Shi K, Yin S, Liu Z. Chromatic confocal microscopy using supercontinuum light. Opt Express. (2004) 12:2096–101. doi: 10.1364/OPEX.12.002096
3. Wildanger D, Rittweger E, Kastrup L, Hell S. STED microscopy with a supercontinuum laser source. Opt Express. (2008) 16:9614–21. doi: 10.1364/OE.16.009614
4. Maurer C, Jesacher A, Bernet S, Ritsch-Marte M. What spatial light modualtors can do for optical microscopy? Laser Photonics Rev. (2011) 5:81–101. doi: 10.1002/lpor.200900047
5. Martinez J L, García-Martínez P, Moreno I. Microscope system with on axis programmable Fourier transform filtering. Opt. Laser Eng. (2016) 89:116–22. doi: 10.1016/j.optlaseng.2016.04.008
6. Micó V, García J, Camacho L, Zalevsky Z. Quantitative phase imaging in microscopy using a spatial light modulator. Springer Ser Surf Sci. (2011) 46:145–67. doi: 10.1007/978-3-642-15813-1_6
7. Dennis T, Schlager JB, Bertness KS. A novel solar simulator based on supercontinuum laser or sola cell device and material characterization. IEEE J Photovoltaics. (2014) 4:1119–27. doi: 10.1109/JPHOTOV.2014.2321659
8. Dennis T. An arbitrarily programmable solar simulator based on a liquid crystal spatial light modulator. IEEE 40th Conference Photovoltaic Specialist Conference (Denver, CO). (2014). p. 3326–30. doi: 10.1109/PVSC.2014.6925647
9. Moreno I, Carrión JV, Martínez JL, García-Martínez P, Sánchez-López MM, Campos J. Optical retarder system with programmable spectral retardance. Opt Lett. (2014) 39:5483–6. doi: 10.1364/OL.39.005483
11. Sordillo LA, Pu Y, Pratavieira S, Budansky Y, Alfano RR. Deep optical imaging of tissue using the second and third near-infrared spectral windows. J Biomed Opt. (2014) 19:056004. doi: 10.1117/1.JBO.19.5.056004
12. Unterhuber A, Povazay B, Bizheva K, Hermann B, Sattmann H, Stingl A, et al. Advances in broad bandwidth light sources for ultrahigh resolution optical coherence tomography. Phys Med Biol. (2004) 49:1235–46. doi: 10.1088/0031-9155/49/7/011
13. Rosales-Guzmán C, Forbes A. How to Shape Light With Spatial Light Modulators. SPIE Press (2017). doi: 10.1117/3.2281295
14. Vargas A, Donoso R, Ramírez M, Carrión J, Sánchez-López MM, Moreno I. Liquid crystal retarder spectral retardance characterization based on a Cauchy dispersion relation and a voltage transfer function Opt Rev. (2013) 20:378–84. doi: 10.1007/s10043-013-0068-4
15. Vargas A, Sánchez-López MM, García-Martínez P, Arias J, Moreno I. Highly accurate spectral retardance characterization of a liquid crystal retarder including Fabry-Perot interference effects. J Appl Phys. (2014) 115:033101. doi: 10.1063/1.4861635
16. Marco D, Sánchez-López MM, García-Martínez P, Moreno I. Using birefringence colors to evaluate a tunable liquid-crystal q-plate. J Opt Soc Am B. (2019) 36:D34–41. doi: 10.1364/JOSAB.36.000D34
17. Messaadi A, Sánchez-López MM, García-Martínez P, Vargas A, Moreno I. Optical system for measuring the spectral retardance function in an extended range. J Eur Opt Soc Rapid Pub. (2016) 12:21. doi: 10.1186/s41476-016-0023-7
Keywords: supercontinuum laser, broadband light sources, spatial light modulators, biological applications, microscopy, liquid crystal on silicon
Citation: García-Martínez P, Moreno I, Sánchez-López MM, Gomis J, Martínez P and Cofré A (2021) Programmable Supercontinuum Laser Spectrum Generator Based on a Liquid-Crystal on Silicon Spatial Light Modulator. Front. Phys. 9:651147. doi: 10.3389/fphy.2021.651147
Received: 08 January 2021; Accepted: 09 March 2021;
Published: 01 April 2021.
Edited by:
Ming Lei, Xi'an Jiaotong University, ChinaReviewed by:
Kapil Debnath, Indian Institute of Technology Kharagpur, IndiaJunichi Fujikata, Photonics Electronics Technology Research Association, Japan
Copyright © 2021 García-Martínez, Moreno, Sánchez-López, Gomis, Martínez and Cofré. This is an open-access article distributed under the terms of the Creative Commons Attribution License (CC BY). The use, distribution or reproduction in other forums is permitted, provided the original author(s) and the copyright owner(s) are credited and that the original publication in this journal is cited, in accordance with accepted academic practice. No use, distribution or reproduction is permitted which does not comply with these terms.
*Correspondence: Pascuala García-Martínez, cGFzY3VhbGEuZ2FyY2lhQHV2LmVz