 Bin Liu1,2,3Jifeng Wu1,2Yanwei Cui1,2,4Qinqing Zhu1,2,5Guorui Xiao1,2,4Siqi Wu4Guanghan Cao4
 Zhi Ren1,2*
- 1Key Laboratory for Quantum Materials of Zhejiang Province, School of Science, Westlake University, Hangzhou, China
- 2Institute of Natural Sciences, Westlake Institute for Advanced Study, Hangzhou, China
- 3Faculty of Materials Science and Engineering, Kunming University of Science and Technology, Kunming, China
- 4Department of Physics, Zhejiang University, Hangzhou, China
- 5Department of Physics, Fudan University, Shanghai, China
We report the crystal structure and superconducting properties of new V5+2xNb35−xMo35−xIr10Pt15 high-entropy alloys (HEAs) for x in the range of 0
1 Introduction
High-entropy alloys (HEAs) consisting of five or more constituent elements have received a lot of attention as an emerging class of multicomponent alloys [1–5]. These alloys are stabilized by the high mixing entropy rather than the formation enthalpy, and often refereed to as metallic glasses on ordered lattices. Despite the presence of strong chemical disorder, some HEAs exhibit collective quantum phenomena such as superconductivity [6, 7]. So far, a number of HEA superconductors have been discovered and their crystal structures can be categorized into body-centered cubic (bcc)-type [8–11], a-Mn-type [12, 13], CsCl-type [14], hcp-type [15–17], A15-type [18], and s-type [19]. In particular, the A15-type
Motivated by this, we replace Al and Ga in the V–Nb–Mo–Al–Ga HEAs with Ir and Pt to form new V5+2xNb35−xMo35−xIr10Pt15 HEAs. A nearly single A15 phase is found for 0
2 Materials and Methods
The V5+2xNb35−xMo35−xIr10Pt15 HEAs were prepared by the arc melting method. Stoichiometric amounts of high purity V (99.99%), Nb (99.999%), Mo (99.995%), Ir (99.99%), Pt (99.99%) elements were mixed thoroughly and pressed into pellets in an argon-filled glove box. The pellets were then melted in an arc furnace under high-purity argon atmosphere. To ensure homogeneity, the melts were flipped several times, followed by rapid cooling on a water-chilled copper plate. The phase purity of as-cast HEAs was checked by powder x-ray diffraction (XRD) at room temperature using a Bruker D8 Advance x-ray diffractometer with Cu-Kα radiation. The structural refinements were performed using the JANA2006 program [21]. The morphology and elemental composition were examined by a Zeiss field emission scanning electron microscope (SEM) equipped with an energy dispersive x-ray (EDX) spectrometer. The four-probe resistivity and specific heat were measured in a Quantum Design Physical Property Measurement System (PPMS-9 Dynacool). The dc magnetization measurements were carried out in a commercial SQUID magnetometer (MPMS3).
3 Results and Discussion
3.1 X-Ray Diffraction and Chemical Composition
The XRD patterns for the V5+2xNb35−xMo35−xIr10Pt15 HEAs are displayed in Figure 1A. For all x values, the major diffraction peaks can be well indexed on a cubic lattice with the
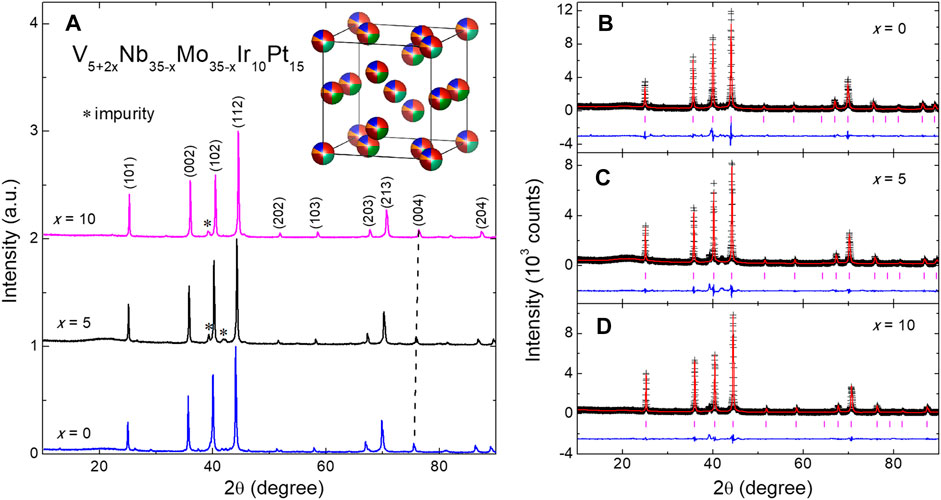
FIGURE 1. (A) X-ray diffraction patterns for the V5+2xNb35−xMo35−xIr10Pt15 HEAs. The major peaks are indexed on a cubic unit-cell with the Pm

TABLE 1. Structural and physical parameters of the V5+2xNb35−xMo35−xIr10Pt15 HEAs.
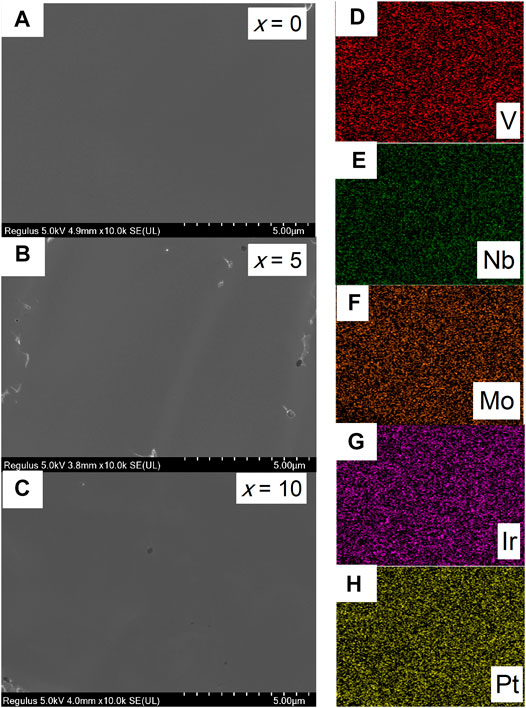
FIGURE 2. (A–C) Typical SEM images for the V5+2xNb35−xMo35−xIr10Pt15 HEAs with x = 0, 5 and 10, respectively. (D–H) Elemental mapping of V, Nb, Mo, Ir, and Pt, respectively, for the HEA with x = 0.
3.2 Resistivity and Magnetic Susceptibility
Figures 3A,B show the temperature dependencies of resistivity (ρ) and magnetic susceptibility (χ) for the V5+2xNb35−xMo35−xIr10Pt15 HEAs, respectively. For each x value, a sharp drop in ρ and strong diamagnetic χ are observed, signifying a superconducting transition. As indicated by the vertical dashed line, the midpoint of ρ drop coincides well with the onset of diamagnetic transition. By this criterion, Tc is determined to be 5.18, 4.49, and 3.61 K for the HEAs with x = 0, 5, and 10, respectively. Below Tc, there is a clear bifurcation between the zero-field cooling (ZFC) and field cooling (FC) χ data measured under an applied field of 1 mT, which is characteristic of a type-II superconductor. At 1.8 K, the
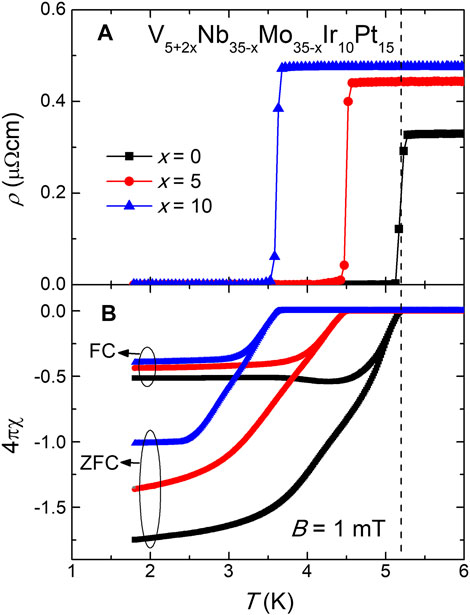
FIGURE 3. (A) Temperature dependence of resistivity for the V5+2xNb35−xMo35−xIr10Pt15 HEAs below 6 K. (B) Temperature dependence of magnetic susceptibility measured under 1 mT for these HEAs in the same temperature range. The ZFC as well as FC curves are labeled, and the vertical dashed line is a guide to the eyes.
3.3 Specific Heat
To confirm the bulk nature of superconductivity, the V5+2xNb35−xMo35−xIr10Pt15 HEAs were further characterized by specific heat (
where γ and β(δ) are the Sommerfeld and phonon specific heat coefficients, respectively. With β, the Debye temperature
where R is the molar gas constant 8.314 J/molK2. This gives γ = 4.59, 4.94, and 5.03 mJ/molatomK2, and
with
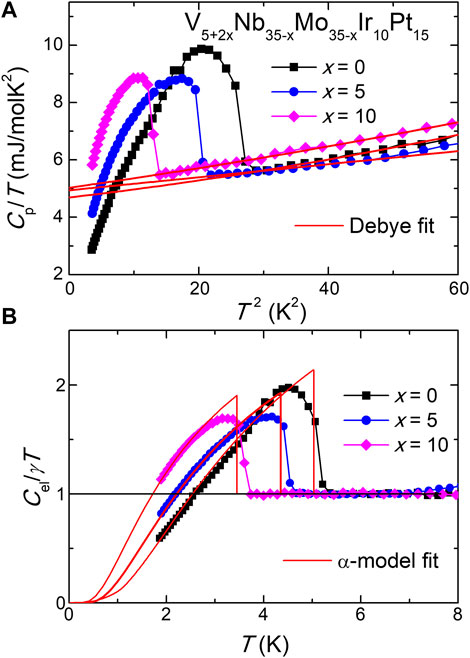
FIGURE 4. (A) Low-temperature specific heat for the V5+2xNb35−xMo35−xIr10Pt15 HEAs plotted as
3.4 Upper Critical Field
The upper critical fields
where
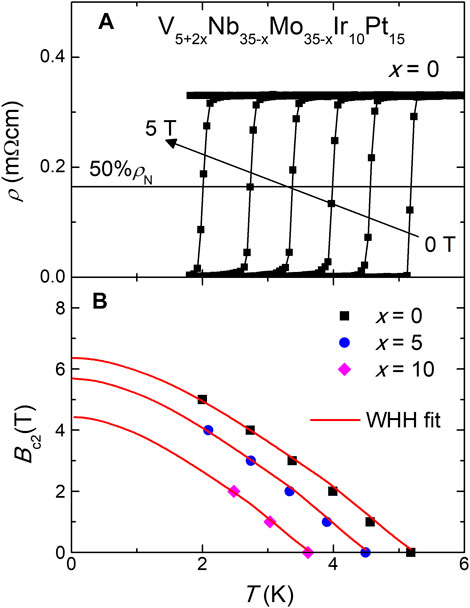
FIGURE 5. (A) Temperature dependence of resistivity for the V5+2xNb35−xMo35−xIr10Pt15 HEA with x = 0 under various field up to 6 T with an field increment of 1 T. The horizontal line and the arrow mark the level corresponding to half of the resistivity drop and the increasing field direction, respectively. (B) Temperature dependence of the upper critical fields for these HEAs. The solid lines are WHH fits to the data.
3.5 VEC Dependence of Tc
Figure 6 shows the VEC dependence of Tc for the V5+2xNb35−xMo35−xIr10Pt15 HEAs, together with the data for A15-type V-Nb-Mo-Al-Ga HEA [18] and binary [20] superconductors for comparison. One can see that superconductivity in all these materials occurs near the VEC values of 4.7 and 6.5, consistent with the expectation from the Matthias rule [30]. Compared with the V–Nb–Mo–Al–Ga HEAs, the V–Nb–Mo–Ir–Pt HEAs have higher VEC values in the range of 6.4–6.5 and their VEC dependence of Tc is in the opposite trend, increasing monotonically with the increase of VEC. Nevertheless, the maximum Tc is considerably lower for the V–Nb–Mo–Ir–Pt HEAs than for the V-Nb-Mo-Al-Ga ones. This indicates that optimal VEC for Tc in A15-type HEA superconductors is around 4.7, which is reminiscent of the case in binary A15 compounds [20]. Moreover, for similar VEC values, the Tc values for V–Nb–Mo–Al–Ga and V–Nb–Mo–Ir–Pt HEAs are always no more than half those of the binary compounds. It is thus reasonable to speculate that the upper limit of Tc for A15-type HEA superconductors is about one-half the highest Tc in binary A15 superconductors.
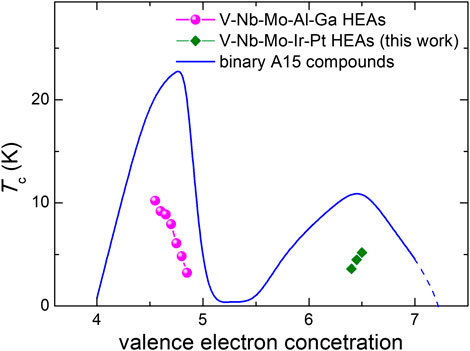
FIGURE 6. VEC dependence of Tc for the A15-type HEA superconductors. The solid line denotes the Tc behavior of binary A15 superconductors.
4 Conclusion
In summary, we have studied the structure, electronic, magnetic and thermodynamic properties of the V5+2xNb35−xMo35−xIr10Pt15 HEAs with 0
Data Availability Statement
The raw data supporting the conclusions of this article will be made available by the authors, upon reasonable request.
Author Contributions
LB synthesized the samples and did the physical property measurements with the assistance from WJF, CYW, ZQQ, XGR. WSQ and CGH contributed in the magnetic measurements. RZ supervised the project and wrote the paper.
Funding
The authors thank the foundation of Westlake University and the National Key Research Development Program of China (No. 2017YFA0303002) for financial support.
Conflict of Interest
The authors declare that the research was conducted in the absence of any commercial or financial relationships that could be construed as a potential conflict of interest.
References
1. Yeh JW, Chen SK, Lin SJ, Gan JY, Chin ST, Shun TT, et al. Nanostructured high-entropy alloys with multiple principal elements: novel alloy Design concepts and outcomes. Adv Eng Mater (2004) 6:299. doi:10.1002/adem.200300567
2. Ye YF, Wang Q, Lu J, Liu CT, Yang Y High-entropy alloy: challenges and prospects. Mater Today (2016) 19:349. doi:10.1016/j.mattod.2015.11.026
3. Miracle DB, Senkov ON A critical review of high entropy alloys and related concepts. Acta Mater (2017) 122:448. doi:10.1016/j.actamat.2016.08.081
4. Zhang WR, Liaw PK, Zhang Y Science and technology in high-entropy alloys. Sci China Mater (2018) 61:2. doi:10.1007/s40843-017-9195-8
5. George EP, Rabbe D, Ritchie RO High-entropy alloys. Nat Rev Mater (2019) 4:515. doi:10.1038/s41578-019-0121-4
6. Sun LL, Cava RJ High entropy alloy superconductors -status, opportunities and challenges. Phys Rev Mater (2019) 3:090301. 10.1016/j.mattod.2015.11.026
7. Kitagawa J, Hamamoto S, Ishizu N Cutting edge of high-entropy alloy superconductors from the perspective of materials research. Metals (2020) 10:1078. doi:10.3390/met10081078
8. Kozelj K, Vrtnik S, Jelen A, Jazbec S, Jaglicic Z, Maiti S, et al. Discovery of a superconducting high-entropy alloy. Phys Rev Lett (2014) 113:107001. doi:10.1103/PhysRevLett.113.107001
9. vonn Rohr F, Winiarski MJ, Tao J, Klimczuk T, Cava RJ The effect of electron count and chemical complexity on the superconductivity of the Ta-Nb-Hf-Zr-Ti high-entropy alloy. Proc Nat Acad Sci USA (2016) 113:E7144. doi:10.1073/pnas.1615926113
10. Yuan Y, Wu Y, Luo HQ, Wang ZS, Liang X, Yang Z, et al. Superconducting Ti15Zr15Nb35Ta35 high-entropy alloy with intermediate electron-phonon coupling. Front Mater (2018) 5:72. doi:10.3389/fmats.2018.00072
11. Nelson WL, Chemey AT, Hertz M, Choi E, Graf DE, Latturner S, et al. Superconductivity in a uranium containing high entropy alloy. Sci Rep (2020) 10:4717. doi:10.1038/s41598-020-61666-z
12. Stolze K, Cevallos FA, Kong T, Cava RJ High-entropy alloy superconductors on an α-Mn lattice. J Mater Chem C (2018) 6:10441. doi:10.1039/C8TC03337D
13. Liu B, Wu JF, Cui YW, Zhu QQ, Xiao GR, Wang HD, et al. Structural evolution and superconductivity tuned by valence electron concentration in the Nb–Mo–Re–Ru–Rh high-entropy alloys. J Mater Sci Technol (2021) 85:11. doi:10.1016/j.jmst.2021.02.002
14. Stolze K, Tao J, von Rohr FO, Kong T, Cava RJ Sc–Zr–Nb–Rh–Pd and Sc–Zr–Nb–Ta–Rh–Pd high-entropy alloy superconductors on a CsCl-type lattice. Chem Mater (2018) 20:906. doi:10.1021/acs.chemmater.7b04578
15. Marik S, Molta K, Varghese M, Sajilesh KP, Singh D, Breard Y, et al. Superconductivity in a new hexagonal high-entropy alloy. Phys Rev Mater (2019) 3:060602. doi:10.1103/PhysRevMaterials.3.060602
16. Lee YS, Cava RJ Superconductivity in high and medium entropy alloys based on MoReRu. Physica C. (2019) 566:1353520. doi:10.1016/j.physc.2019.1353520
17. Liu B, Wu JF, Cui YW, Zhu QQ, Xiao GR, Wu SQ, et al. Superconductivity in hexagonal Nb–Mo–Ru–Rh–Pd high-entropy alloys. Scripta Mater (2020) 182:109. doi:10.1016/j.scriptamat.2020.03.004
18. Wu JF, Liu B, Cui YW, Zhu QQ, Xiao GR, Wang HD, et al. Polymorphism and superconductivity in the V–Nb–Mo–Al–Ga high-entropy alloys. Sci China Mater (2020) 63:823. doi:10.1007/s40843-019-1237-5
19. Liu B, Wu JF, Cui YW, Zhu QQ, Xiao GR, Wang HD, et al. Formation and superconductivity of single-phase high-entropy alloys with a tetragonal structure. ACS Appl Electron Mater (2020) 2:1130. doi:10.1021/acsaelm.0c00108
20. Dew-Hughes D Superconducting A-15 compounds: a review. Cryogenics (1975) 15:435. doi:10.1016/0011-2275(75)90019-3
21. Petricek V, Dusek M, Palatinus L Crystallographic computing system JANA2006: general features. Z Kristallogr (2014) 229:345. doi:10.1515/zkri-2014-1737
22. Tarutani Y, Kudo M Atomic radii and lattice parameters of the A15 crystal structure. J Less Common Met (1977) 55:221. doi:10.1016/0022-5088(77)90196-5
23. Besson R, Guyot S, Legris A Atomic-scale study of diffusion in A15 Nb3Sn. Phys Rev B (2007) 75:054105. doi:10.1103/PhysRevB.75.054105
24. Takano H, Sugiue T, Amakai Y, Momono N, Murayama S Site random supercoductivity of A15 compound Nb3Sn induced by mechanical milling. J Phys Conf Ser (2010) 200:032073. doi:10.1088/1742-6596/200/3/032073
25. Bardeen J, Cooper LN, Schreiffer JR Theory of superconductivity. Phys Rev (1957) 108:1175. doi:10.1201/9780429495700
26. Johnston DC Elaboration of the $\alpha$-model derived from the BCS theory of superconductivity. Supercond Sci Technol (2013) 26:115011. doi:10.1088/0953-2048/26/11/115011
28. Werthamer NR, Helfand E, Hohenberg PC Temperature and Purity Dependence of the Superconducting Critical Field, $H_{\rm c2}$. III. Electron Spin and Spin-Orbit Effects. Phys Rev (1966) 147:295. doi:10.1103/PhysRev.147.295
29. Clogston AM Upper Limit for the Critical Field in Hard Superconductors. Phys Rev Lett (1962) 9:266. doi:10.1103/PhysRevLett.9.266
Keywords: cubic A15 structure, high-entropy alloys, superconductivity, upper critical field, valence electron concentration
Citation: Liu B, Wu J, Cui Y, Zhu Q, Xiao G, Wu S, Cao G and Ren Z (2021) Superconductivity in Cubic A15-type V–Nb–Mo–Ir–Pt High-Entropy Alloys. Front. Phys. 9:651808. doi: 10.3389/fphy.2021.651808
Received: 11 January 2021; Accepted: 28 January 2021;
Published: 31 March 2021.
Edited by:
Jiro Kitagawa, Fukuoka Institute of Technology, JapanReviewed by:
Yoshikazu Mizuguchi, Tokyo Metropolitan University, JapanLi Xiang, Florida State University, United States
Copyright © 2021 Liu, Wu, Cui, Zhu, Xiao, Wu, Cao and Ren. This is an open-access article distributed under the terms of the Creative Commons Attribution License (CC BY). The use, distribution or reproduction in other forums is permitted, provided the original author(s) and the copyright owner(s) are credited and that the original publication in this journal is cited, in accordance with accepted academic practice. No use, distribution or reproduction is permitted which does not comply with these terms.
*Correspondence: Zhi Ren, cmVuemhpQHdlc3RsYWtlLmVkdS5jbg==