 Nahum Xicohténcatl-Hernández
 Adriana Moreno-Ramirez
 Guerda Massillon-JL
- 1Departamento de Matemáticas, Universidad Popular Autónoma del Estado de Puebla, Puebla, Mexico
- 2Instituto de Física, Universidad Nacional Autónoma de México, Mexico City, Mexico
Due to the increase in the survival probability for patients treated with modern radiotherapy techniques to live enough for experimenting the late radiation effect, low dose outside the treatment volume becomes a concern. However, besides the absorbed dose, the beam quality outside the field edge should be taken into account. This work aimed at investigating the photon and electron fluence spectra outside the field edges for several small radiotherapy fields for determining the quality of the beams in order to better evaluate the secondary effect after modern radiotherapy treatments. Phase-space files of a 6 MV X-ray beam produced by a Varian iX linac for eight small fields of 0.7 × 0.7 cm2, 0.9 × 0.9 cm2, 1.8 × 1.8 cm2, 2.2 × 2.2 cm2, 2.7 × 2.7 cm2, 3.1 × 3.1 cm2, 3.6 × 3.6 cm2, and 4.5 × 4.5 cm2 and for the reference 10 × 10 cm2 field at SSD = 100 cm were generated using the BEAMnrc code. The photon and electron fluences in each field were calculated at 0.15, 1.35, and 9.85 cm water depth and several off-axis distances using FLURZnrc. The number of low-energy electrons between 1 and 10 keV at 2 cm outside the field edge increases by 60% compared to the central axis. Due to the relatively high linear energy transfer (LET) of these electrons, the results of this work should help to better evaluate the possible late effect of secondary radiation on healthy organs close to the tumor volume after radiotherapy treatment. We also observed high-energy electrons outside the field edge that are attributed to the leakage of the primary electron beam from the head of the linac. From a standpoint of radiological protection, these electrons should be taken into account when evaluating the dose delivered to the patient’s skin.
Introduction
The use of modern radiotherapy techniques for cancer treatment has been successful. Consequently, the survival probability for patients to live enough for experimenting with late radiation effects has progressively increased [1]. So, knowing the peripheral (outside the field edge) low absorbed dose received by healthy surrounding organs becomes an important issue [2–4], principally if anatomical structures with tolerances to low absorbed dose are involved. From a biological standpoint, it is well known that for a given absorbed dose value, the radiobiological effect varies with the energy beams. Furthermore, the susceptibility to ionizing radiation of each healthy organ or tissue close to the tumor volume depends on the low-energy radiations (electrons and photons) generally present outside the field edge. In terms of dosimetry studies, the dosimeters mostly used in the clinic to evaluate the absorbed dose are regularly energy-dependent [5–10]. Therefore, this might be the reason for which discrepancy is commonly observed on the absorbed dose measured outside radiotherapy fields with different dosimeter types [11–14]. The main issue is the fact that the dosimeters are commonly calibrated within the beam central axis and then used to measure dose outside the field, and subsequently, the measured dose can be misleading due to the energy dependence. Recently, skin QED diodes, optically stimulated luminescent dosimeters, and LiF thermoluminescent dosimeters have been used to measure the absorbed dose outside the field edge, finding notable differences between dosimeters [14]. It was concluded that the dosimeters should be calibrated out-of-field and preferably with bolus equal in thickness to the depth of interest [14]. However, this proposal requires those dosimeters calibrated using a known radiation quality. Unfortunately, the beam quality outside the field edge is not well documented in the literature, especially for small field MV beams.
Several groups have reported electron- and photon-energy spectra for large field sizes [12, 15–17]. Edwards and Mountford [12] have investigated the difference between the energy spectrum outside the field edge and the corresponding spectrum on the central axis near a phantom surface (0.1 cm depth) for a 6 MV X-ray beam. Their study was done on the central axis and at 1, 2, 5, and 10 cm from the edge of one small field of 4 × 4 cm2 and two large fields of 10 × 10 cm2 and 15 × 15 cm2. Information about the average electron and photon energies was not provided since their main interest was to evaluate the sensitivity of two dosimeters situated outside the field edge relative to the central axis [12]. Scarboro and colleagues [15] have scrutinized the mean photon energy in three field sizes of 5 × 5 cm2, 10 × 10 cm2, and 20 × 20 cm2 at several depths and off-axis distances to evaluate the impact on the thermoluminescent dosimeter (TLD) response. They found an over-response up to 12% outside the field relative to the beam central axis, which was associated with the high contribution of the low photon energy within the spectrum outside the field edge. Independently, Jang and collaborators [16] have examined the variations of the electron- and photon-energy spectra in 3D-CRT (three-dimensional conformal radiation therapy) and IMRT (intensity-modulated radiation therapy) photon fields and the subsequent impact on the dosimeter (radiographic films and TLDs) response as well as on the water-to-material stopping-power ratio. The electron- and photon-energy spectra, as well as the mean energies of photons and electrons, were calculated for four open square fields of 5 × 5 cm2, 10 × 10 cm2, 20 × 20 cm2, and 40 × 40 cm2. They found a strong dependence of the photon spectra with the spatial positions and an over-response of the TLD and radiographic films of ∼10 and ∼30%, respectively, and concluded that spatial variations of the electron- and photon-energy spectra should be considered as important factors in 3D-CRT and IMRT dosimetry [16]. On the other hand, Ding [17] has calculated incident photons as well as contaminating electrons and positrons in two radiotherapy energy beams for two field sizes of 10 × 10 cm2 and 40 × 40 cm2, observing for 6 MV X-rays that the incident charged particles contributed 7–21% of to the maximum dose at the surface when the field size increases from 10 × 10 cm2 to 40 × 40 cm2. Concerning the small field size, to the best of our knowledge, there is one study where electron- and photon-energy spectra in liquid water have been evaluated in a Varian Clinac iX 6 MV linear accelerator (linac) for several field sizes from 10 × 10 cm2 down to 0.5 × 0.5 cm2 [19–21]. However, such a study concerns only the spectra within the beam central axis. Also in such a study, the transport parameters used to generate the phase spaces at the water phantom surface were 0.7 and 0.01 MeV for the global ECUT and PCUT, respectively [22], which suggests a hard X-ay spectrum due to the lack of contribution of low photon energies to the phase space. From the revision above, it can be noted that there are no data available about electron- and photon-energy spectra outside the field for small field sizes. Thus, precise knowledge about the beam spectra characteristics—such as mean electron- and photon-energy—outside small radiotherapy fields would allow us to better evaluate the biological effect for healthy organs and make appropriate corrections based on the energy dependence of a given dosimeter used to evaluate the absorbed dose outside the field edges.
This work investigated the electron- and photon-energy spectra outside small radiotherapy fields compared to those within the central axis as a function of water depth to better quantify the possible late effect of secondary radiation on healthy organs close to the tumor volume after radiotherapy treatment. The total electron fluence (TEF: all primary electrons generated by photons plus secondary electrons due to electron–electron interactions) and secondary electron (SE: electrons due to electron–electron interactions) spectra were scored. The interest for the SEs is based on the fact that previous results have shown that 40–90% of the electrons generated by high-energy photons (e.g., 60Co gamma) are SEs of energies below 10 keV [23]. Furthermore, it has been concluded that linear energy transfer (LET) of SEs is a more adequate parameter to describe the effect of ionizing radiation in the matter [23, 24].
Materials and Methods
Based on a drawing provided by the manufacturer under confidentiality, a Varian iX linac has been designed using the BEAMnrc [25] Monte Carlo (MC) code to generate phase-space files (PSFs) of a 6 MV X-ray beam for field sizes of 0.7 × 0.7 cm2, 0.9 × 0.9 cm2, 1.8 × 1.8 cm2, 2.2 × 2.2 cm2, 2.7 × 2.7 cm2, 3.1 × 3.1 cm2, 3.6 × 3.6 cm2, 4.5 × 4.5 cm2, and 10 × 10 cm2. All field sizes were defined at 100 cm SSD (source to surface distance), i.e., the PSFs were generated considering the air volume between the source and the phantom. The energy of the accelerated incident electron impinging the target was 6 MeV. The linac geometry included 60 leaf pairs of multileaf collimators (MLCs), head-shielding, and other structural components. Note that to create the phase space files, the BEAMnrc code allows simulating square fields using the secondary collimators. Nevertheless, the FLURZnrc module of the EGSnrc MC code allows cylindrical geometries only. Thus, to calculate the fluences, the square fields were converted into equivalent circular fields according to the following relation [26]:
where l is the length of the equivalent square field and d is the diameter of the circular field. Compared to the so-called “4 x area/perimeter” method to calculate the equivalent field, Eq. 1 has been considered more reliable and the associated errors are negligible [26]. Ref. 26 reported a table for equivalent square fields down to 0.5 cm length. The diameters of the circular fields corresponding to the square equivalent fields at the phantom surface are given in Table 1. The circular fields are similar to those used by a CyberKnife unit. So, the photon/electron spectra calculated in this work are expected to be applicable to CyberKnife since it is the same 6 MV beam.
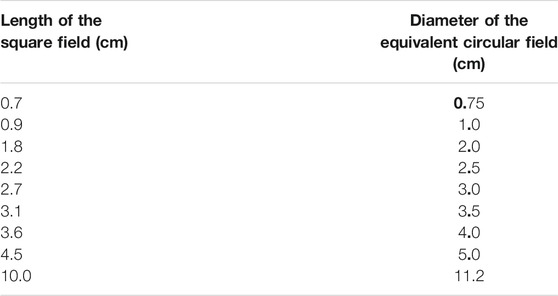
TABLE 1. The different field sizes used in this study.
In the simulations, 5 × 10¹⁰ histories were followed. Contrary to the phase space data reported in the literature for the Varian iX linac [22], in this work, transport parameters for the global electron transport cut-off (ECUT) equal to 512 keV and photon transport cut-off (PCUT) equal to 1 keV were used to generate the PSFs. The maximum fractional energy loss per step (ESTEPE) was 0.01%, and the cross-section database generated by the XCOM package was considered. To benchmark the PSFs, percentage depth dose (PDD) and dose profiles were calculated in a 40 × 40 × 40 cm3 water phantom for 5 × 5 cm2, 5.4 × 5.4 cm2, 10 × 10 cm2, and 20 × 20 cm2 field sizes using the DOSRZnrc [25] module. The PDDs were obtained at 70 cm (the distance used in CyberKnife) and 100 cm SSD, while the dose profiles were obtained at 10 cm water depth. The results were compared with the measurements performed with several ionization chambers in two different Varian iX linacs: For one linac, PDD results were compared with the measurements performed at 70 cm SSD in 5.4 × 5.4 cm2 and 10 × 10 cm2 field sizes using one Exradin A12 and two FC65P Wellhofer Scanditronix ionization chambers. We found differences of less than 0.5%. For the other linac, PDD and dose profile results were compared with the measurements performed at 100 cm SSD in 5 × 5 cm2, 10 × 10 cm2, and 20 × 20 cm2 field sizes using a PTW 30013 ionization chamber. Figures 1A,B display the PDD and the dose profile for the 10 × 10 cm2 field. The results agree within less than 3% in the PDD and 5% maximum in the dose profile within the penumbra region. The excellent agreement between the simulation and the measurements suggests the correctness of the drawing parameters and the energy of the incident electron beam that impinges the target. Consequently, no corrections were required during the benchmarking process against measurements as generally done for linac models used in MC simulations. Afterward, the electron and photon fluences were calculated at 0.15, 1.35, 9.85, and 19.85 cm water depth and several off-axis distances (OADs) using the FLURZnrc module of the EGSnrc [21] MC code considering the same parameters mentioned above, including the size of the water phantom.
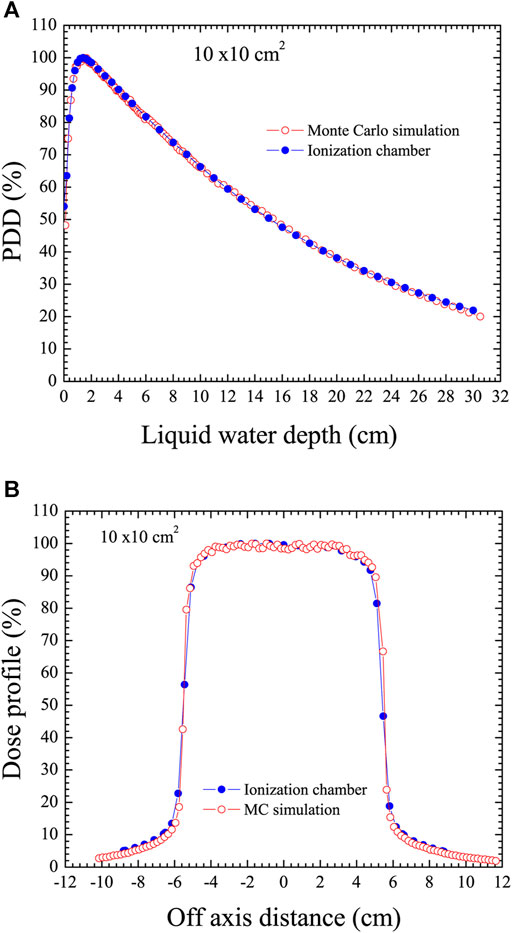
FIGURE 1. (A) PDD calculated by MC simulation compared to that measured with a PTW 30013 ionization chamber for the 10 × 10 cm2 field. (B) Dose profile calculated by MC simulation compared to that measured with a PTW 30013 ionization chamber for the 10 × 10 cm2 field.
The photon spectra, total electron fluence (TEF: all primary electrons generated by photons plus secondary electrons due to electron–electron interactions), and secondary electron (SE: electrons due to electron–electron interactions) spectra were scored within voxel sizes of 0.15 × 0.3 cm2 for field sizes of 0.7–2.2 cm, 0.3 × 0.3 cm2 for field sizes of 2.7–4.5 cm, and 0.5 × 0.3 cm2 for the 10.0 cm × 10.0 cm field.
Results
Photon Fluence Spectra
Figure 2 presents the energy photon fluence normalized to the total fluence of the corresponding voxel for the 4.5 × 4.5 cm2 field. Note the presence of the 511 keV photon energy peak corresponding to positron annihilation, independent of the water depth. As can be seen, the relative contribution of low photon energies below 100 keV increases as the water depth increases and, for a given water depth, augments with the OAD. Such behavior, which is observed for all the FSs studied, is due to the amount of Compton photons scattered as the water volume becomes larger.
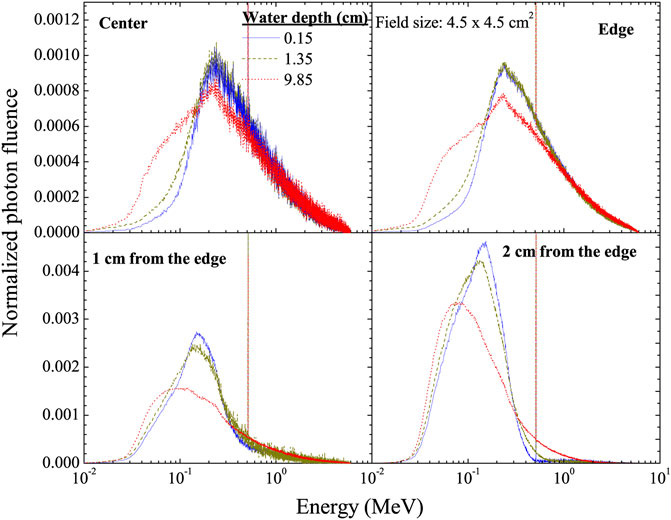
FIGURE 2. Normalized photon fluence as a function of photon energy at several OADs for the 4.5 × 4.5 cm2 field size.
Using all photon spectra, the mean energies were calculated as a function of the FS and OADs. These data are displayed in Figure 3 and Tables 2–5. Figure 3 shows the mean photon energy as a function of the FS for four water depths and OADs. As seen, within the radiation field, the mean photon energy decreases as the FS increases, while outside the field edge, an inverse behavior is observed where the mean photon energy decreases, reaches a minimum, and then increases with the FS. Also shown in Figure 3 are data reported in the literature [21] for the 6 MV Varian iX linac at 10 cm water depth in the central axis of the field, and a notable difference is observed.
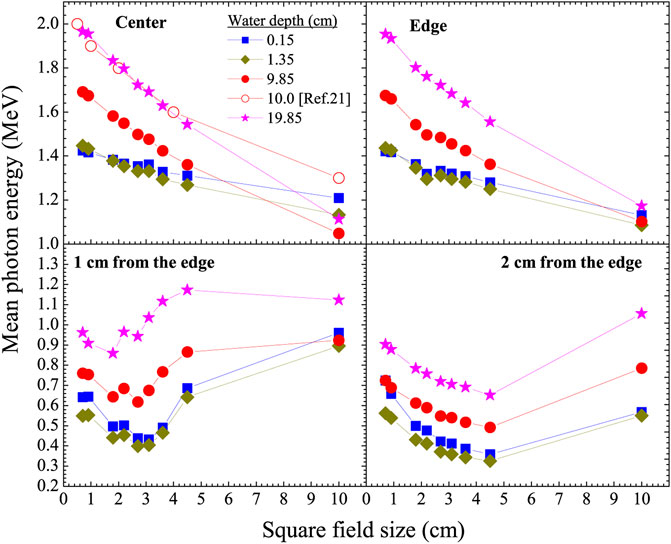
FIGURE 3. Mean photon energy as a function of square FS for four water depths and several OADs.
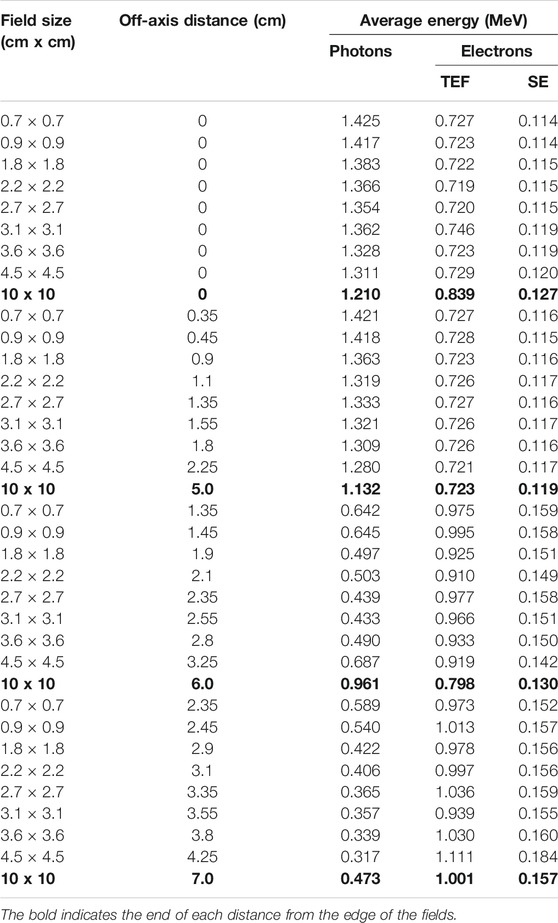
TABLE 2. Mean photon and electron (TEF and SE) energy at water depth = 0.15 cm. The uncertainties are 0.1–0.7% (coverage factor, k = 1) [27].
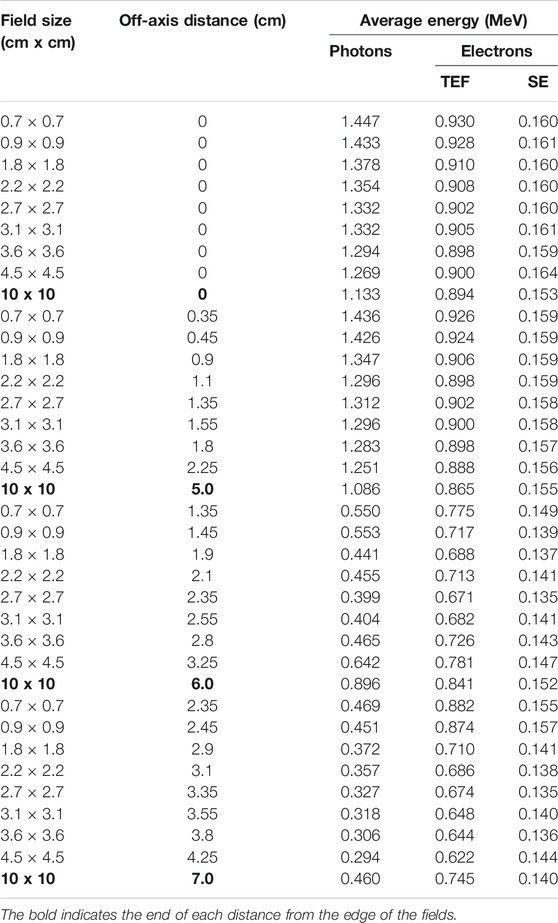
TABLE 3. Mean photon and electron (TEF and SE) energy at water depth = 1.35 cm. The uncertainties are 0.1–0.7% (coverage factor, k = 1) [27].
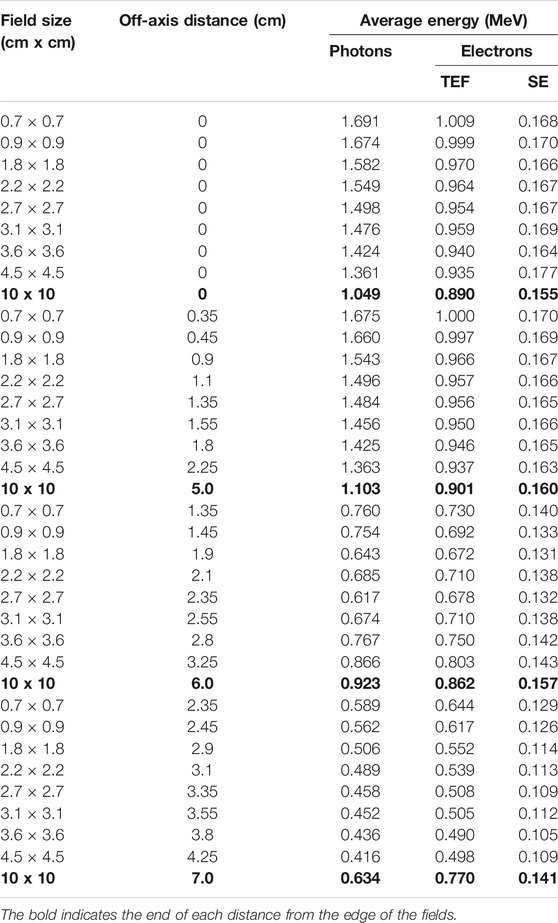
TABLE 4. Mean photon and electron (TEF and SE) energy at water depth = 9.85 cm. The uncertainties are 0.1–0.7% (coverage factor, k = 1) [27].
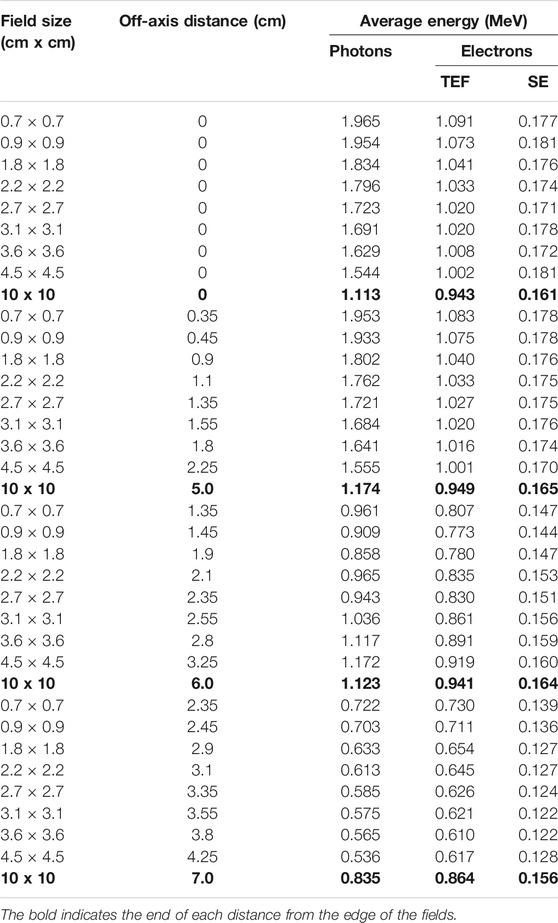
TABLE 5. Mean photon and electron (TEF and SE) energy at water depth = 19.85 cm. The uncertainties are 0.1–0.7% (coverage factor, k = 1) [27].
Electron Fluence Spectra
Using all the electron spectra, the mean energies for the TEF and SE were calculated as a function of the FS and OADs. These data are presented in Figures 4 and 5 and Tables 2–5.
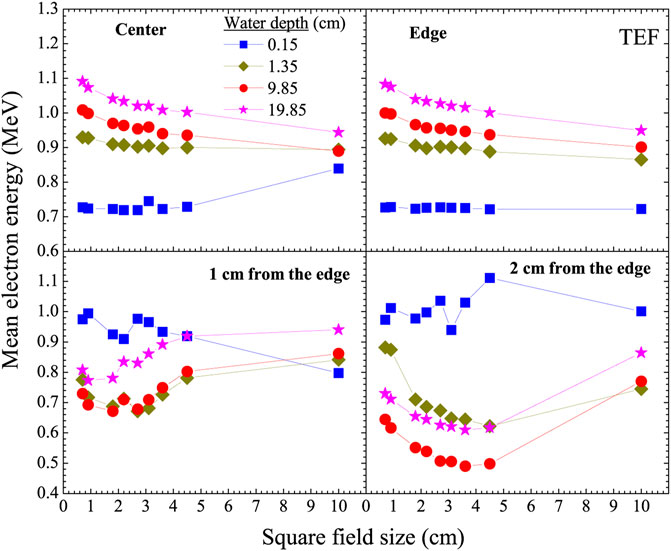
FIGURE 4. Mean electron energy for the TEF as a function of square FS for four water depths and several OADs.
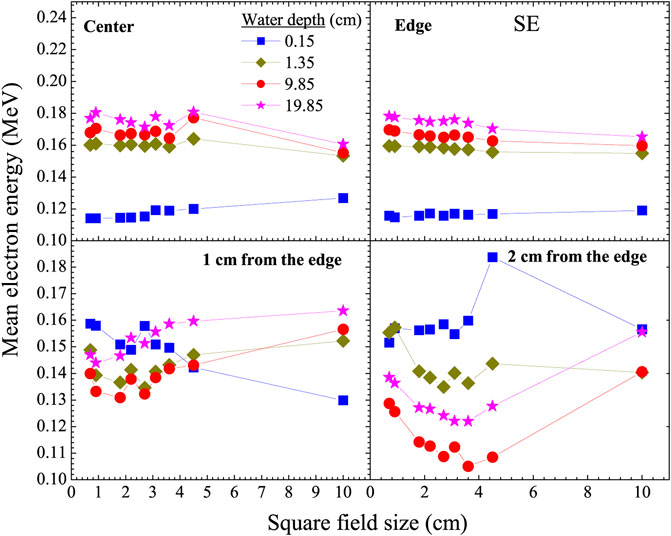
FIGURE 5. Mean electron energy for the SE fluence as a function of square FS for four water depths and several OADs.
It can be seen in Figure 4 that, similar to the photons, the average electron energy for the TEF in the central axis and the edge of the fields decreases as the FS increases, but outside the field, it has different behavior depending on the depth. Also note in Tables 2 and 3 that at 0.15 and 1.35 cm water depths, the mean energies of the electrons are greater than those of the photons independent of the field size. Figure 6 shows the mean energy for photons and electrons as a function of OAD for the 0.7 × 0.7 cm2 field where the mean energy for electrons outside the field edge close to the surface and at 1.35 cm water depth are greater than those of the photons. To understand the origin of these electrons, the electron spectra produced by the phase space, a 6 MV X-ray point source (without the head of the linac), and a 60Co gamma beam for several field sizes and depths in liquid water were investigated.
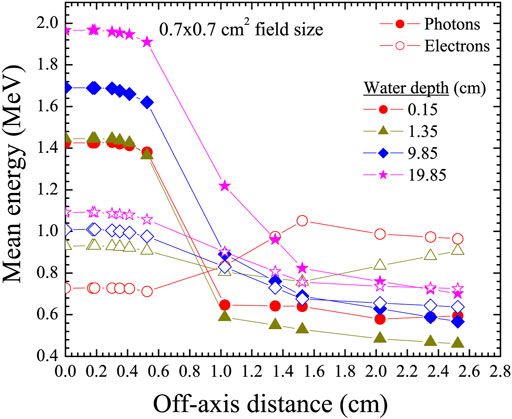
FIGURE 6. Mean energy as a function of OADs for the 0.7 × 0.7 cm2 field at four water depths.
Figure 7 presents the results for the 4.5 × 4.5 cm2 field. As observed, in the central axis, the contribution of high-energy electrons is similar between the phase space and the 6 MV X-ray point source. However, outside the field edge and at 0.15 and 1.35 cm water depth, this contribution is larger for the phase space. Table 6 displays the average energy for each beam.
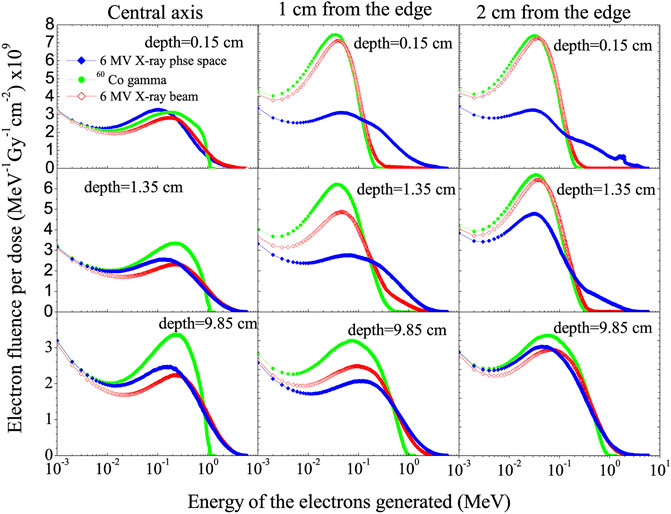
FIGURE 7. Comparison of the electron fluence normalized to the absorbed dose within the voxel obtained for the phase space, a 6 MV X-ray point source, and the 60Co gamma as a function of energy of the electrons generated for the 4.5 × 4.5 cm2 field at three OADs and water depths.
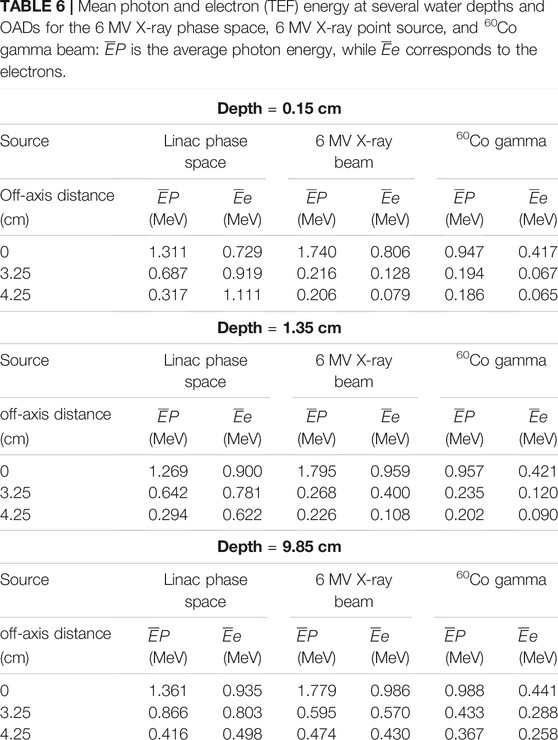
TABLE 6. Mean photon and electron (TEF) energy at several water depths and OADs for the 6 MV X-ray phase space, 6 MV X-ray point source, and 60Co gamma beam:
As shown in Table 6, the average energies of the electron spectra outside the fields for the phase space are up to 3 times larger than the photon energy depending on the distance from the field edge, which decreases with increasing water depth. Nonetheless, for the 6 MV X-ray point source and the 60Co gamma beam, the average energies of the electron spectra outside the fields are always smaller than those of the photons independent of the field size, as expected considering the energy conservation. These results suggest that the high-energy electrons are generated from the head of the linac and did not contribute to X-ray production. Concerning the SE spectra data shown in Figure 5, in the central axis of the beam, the average energy electron varies slightly with FS, depth, and OAD. However, outside the field edge, this variation is more important.
Discussion
Photon Fluence Spectra
Figure 3 and Tables 2–5 reveal that at 9.85 and 19.85 cm water depths, the mean photon energy (MPE) in the central axis and the edge of the fields varies with the FS from 1.691 to 1.965 MeV at 0.7 × 0.7 cm2 down to 1.049 and 1.113 MeV at the 10 × 10 cm2 field (variation ∼61 and 76%). However, at 0.15 cm close to the phantom surface and 1.35 cm close to dmax, MPE diverges from 1.425 to 1.447 MeV at 0.7 × 0.7 cm2 down to 1.210 and 1.133 MeV at the 10 × 10 cm2 field (differences of ∼18–27%). Note that in the central axis and the edge of small field sizes, MPEs at 0.15 and 1.35 cm water depths are very similar (variations of 0.2–3.3%), whereas in the 10 × 10 cm2 field, the differences are ∼4.2–6.4%. The similarity between the photon spectra at these depths can be explained by the fact that there exists not yet charged particle equilibrium (CPE) in the vertical direction of the beams. Also observe that, in contrast to the small fields where MPE in the beam central axis rises as the depth increases, in the 10 × 10 cm2 field, MPE diminishes with the water depth. This could possibly be associated with the relative contribution of low-energy photons scattered that contribute to the spectra at a given depth. That is, as the depth is larger, the divergence of the 10 × 10 cm2 field becomes more important and, consequently, there is more water volume where the primary beam can interact to produce a large number of Compton photons, which, in turn, causes softness of the photon-energy spectrum. Such a result suggests that the contribution of photons scattered within the water phantom at this depth is superior to that from the phantom surface. Also note that inside the field, the MPE decreases with the FS, while outside the field edge, different behavior is observed. That is, inside the field, there is more contribution of scattered photons to the energy spectrum as the FS increases and, consequently, the MPE decreases. However, outside the field edge, the MPE decreases, reaches a local minimum, and thereafter grows as the FS increases. This can be explained as a consequence of the rapid decrease in the low-energy photon fluence with the distance from its origin, i.e., as the field size increases, low-energy photons that originated at a certain distance far away cannot be reached and, therefore, the MPE increases.
Regarding the data published in the literature [20, 21] where the IAEA phase-space database was used [18], Figure 3 shows that MPEs are systematically greater than ours with differences of 14–24%, being larger for the 10 × 10 cm2 field size. This notable difference can be associated with several circumstances: firstly, the 700 and 10 keV transport parameters for the global ECUT and PCUT used in Ref. [22] versus 1 keV for both global energy cut-offs used in this work. As mentioned above, the X-ray spectrum obtained in Ref. [22] is expected to be harder than ours since it disregards the contribution of low photon energies. Secondly, the differences in the drawing parameters used and the initial electron beam that impinges the target considered in each study.
Electron Fluence Spectra
The results for the electron spectra show only one maximum peak (see Figure 7) independent of the depth and OADs, which highlights the electrons generated through the Compton interaction. For the TEF in the central axis of the fields, the peak appears at around 110 keV, whereas for those outside the field edge, it shows up at energies of 30–50 keV. This is due to the increase in the scattering radiation outside the field boundaries. Such a result is particularly important due to the relatively high LET of these electrons, which might have a late effect on the healthy tissue surrounding the tumor volume even though the dose delivered is considered to be small. Besides, we have observed that for a given FS, the TEF outside the field edge increases as the water depth increases. Note that the TEF also diminishes with the FS. For instance, in the central axis of the beams, the difference in the TEF between 4.5 and 0.7 cm fields is roughly 21% at 1.35 cm depth, while at 9.85 cm, this difference is about 30%. In contrast to TEF, the SE shows a continuous slowing down as the electron energy increases, providing no information of the interaction process. This means that secondary electrons do not have a memory of their origin as observed previously [23, 24]. This might explain the reason for which they are almost similar in quantity and quality independent of the field size as observed for the mean energy displayed in Figure 5. It is also observed that the SE fluence decreases as the OAD augments and increases with water depth. For example, an increase of up to 35% is observed at 9.85 cm depth relative to 0.15 cm close to the phantom surface. Contrary to the photon spectra, the mean energy of the TEF spectra in the central axis of the field varies slightly by about 13% with the FS. As displayed in Figure 4, the mean energy of the electron spectra outside the field edge presents a minimum and a maximum dependent on the FS and water depth. For the SE spectra, the mean energy in the central axis at 9.85 cm depth varies by ∼8% as the FS increases, whereas outside the field edge, the mean energy of the SE spectra displays the same feature as the TEF.
Concerning the data shown in Figure 6 and Tables 2 and 3, note that at 1 and 2 cm outside the field edge, the mean electron energies are greater than those for photons, sometimes up to 3 times larger. It is worth mentioning that such comportment has been observed in a previous study [16], but no comments had been made. Nonetheless in this work, such behavior has been investigated by comparing the results using the phase space with those for a 6 MV X-ray point source and 60Co gamma. As shown in Figure 7, in the central axis and independent of the depth, the energy endpoint of the electron spectra is similar for both the phase-space and the 6 MV X-ray point source, whereas outside the field edge and close to the phantom surface and at 1.35 cm depth, a remarkable contribution of the high-energy electrons can be observed for the phase space data, which is not present for the 6 MV X-ray point source. This suggests possible contamination where primary electrons are leaked from the head of the linac without impinging the target and reach the water phantom. Thus, from a standpoint of radiation protection, these electrons should be considered in order to protect the patient’s skin during radiotherapy treatment with linear accelerators.
Conclusions
We have investigated the photon and electron spectra outside a broad range of small radiotherapy field sizes produced by a 6 MV X-ray Varian iX linac. We observed a large number of low-energy electrons with energies between 1 and 10 keV at 2 cm outside the field-edge compared to the central axis. Note that these electrons have a relatively high LET that can affect any healthy organ surrounding the tumor volume during radiotherapy treatment. Thus, the result of this work should help to better evaluate the possible late effect of secondary radiation. Furthermore, the presence of high-energy electrons outside the field edge close to the phantom surface and dmax has been observed, suggesting contamination due to a leakage from the head of the linac where these electrons travel without interacting with the target. So, from a standpoint of radiological protection, one can argue that during radiotherapy treatment, precautions should be taken to prevent any damage to the patient’s skin.
Data Availability Statement
The original contributions presented in the study are included in the article/Supplementary Material; further inquiries can be directed to the corresponding author.
Author Contributions
NX contributed to the linear accelerator design to generate the phase space files, realized part of the Monte Carlo simulation, and contributed to the discussion of the results. AM performed part of the Monte Carlo simulation and contributed to the discussion of the results. GM-JL proposed the idea, contributed to the discussion of the results, and wrote the paper.
Funding
PAPIIT-UNAM grant IN118120 Royal Society-Newton Advance Fellowship grant NA150212.
Conflict of Interest
The authors declare that the research was conducted in the absence of any commercial or financial relationships that could be construed as a potential conflict of interest.
Publisher’s Note
All claims expressed in this article are solely those of the authors and do not necessarily represent those of their affiliated organizations, or those of the publisher, the editors and the reviewers. Any product that may be evaluated in this article, or claim that may be made by its manufacturer, is not guaranteed or endorsed by the publisher.
Acknowledgments
The authors thank Alexis Cabrera-Santiago for technical support during the development of this work. This work was partially supported by PAPIIT-UNAM grant IN118120 and Royal Society-Newton Advance Fellowship grant NA150212.
References
1. Harrison RM. Introduction to Dosimetry and Risk Estimation of Second Cancer Induction Following Radiotherapy. Radiat Measurements (2013) 57:1–8. doi:10.1016/j.radmeas.2013.01.018
2. D’Agostino E, Bogaerts R, Defraene G, Freitas Nascimento L, Van den Heuvel F, Verellen D, et al. Peripheral Doses in Radiotherapy: A Comparison between IMRT, VMAT and Tomotherapy. Radiat Meas (2013) 57:62–7.
3. Yan H, Guo F, Zhu D, Stryker S, Trumpore S, Roberts K, et al. On the Use of Bolus for Pacemaker Dose Measurement and Reduction in Radiation Therapy. J Appl Clin Med Phys (2018) 19:125–31. doi:10.1002/acm2.12229
4. Bencheikh M, Maghnouj A, Tajmouati J, Didi A, Lamrabet A, Benkhouya Y, et al. Study of 6 MV Photon Beam Dose Profiles, Investigation and Evaluation of Scattered Photons and Electrons Contamination Effects on Beam Dose Profiles. Bulg J Phys (2018) 45:67–75.
5. Massillon-Jl G, Chiu-Tsao S-T, Domingo-Munoz I, Chan MF. Energy Dependence of the New Gafchromic EBT3 Film:Dose Response Curves for 50 KV, 6 and 15 MV X-Ray Beams. Ijmpcero (2012) 01:60–5. doi:10.4236/ijmpcero.2012.12008
6. Massillon-Jl G, Muñoz-Molina ID, Díaz-Aguirre P. Optimum Absorbed Dose versus Energy Response of Gafchromic EBT2 and EBT3 Films Exposed to 20-160 kV X-Rays and 60 Co Gamma. Biomed Phys Eng Express (2016) 2:045005. doi:10.1088/2057-1976/2/4/045005
7. Massillon-Jl G, Cabrera-Santiago A, Xicohténcatl-Hernández N. Relative Efficiency of Gafchromic EBT3 and MD-V3 Films Exposed to Low-Energy Photons and its Influence on the Energy Dependence. Physica Med (2019) 61:8–17. doi:10.1016/j.ejmp.2019.04.007
8. Massillon-Jl G, Cabrera-Santiago A, Minniti R, O’Brien M, Soares CG. Influence of Phantom Materials on the Energy Dependence of LiF:Mg,Ti Thermoluminescent Dosimeters Exposed to 20-300 kV Narrow X-ray spectra,137Cs and60Co Photons. Phys Med Biol (2014) 59:4149–66. doi:10.1088/0031-9155/59/15/4149
9. Richter C, Pawelke J, Karsch L, Woithe J. Energy Dependence of EBT-1 Radiochromic Film Response for Photon (10kVp-15MVp) and Electron Beams (6-18MeV) Readout by a Flatbed Scanner. Med Phys (2009) 36:5506–14. doi:10.1118/1.3253902
10. Rink A, Vitkin IA, Jaffray DA. Energy Dependence (75kVp to 18MV) of Radiochromic Films Assessed Using a Real-Time Optical Dosimeter. Med Phys (2007) 34:458–63. doi:10.1118/1.2431425
11. Bordy JM, Bessieres I, d'Agostino E, Domingo C, d'Errico F, di Fulvio A, et al. Radiotherapy Out-Of-Field Dosimetry: Experimental and Computational Results for Photons in a Water Tank. Radiat Measurements (2013) 57:29–34. doi:10.1016/j.radmeas.2013.06.010
12. Edwards CR, Mountford PJ. Near Surface Photon Energy Spectra outside a 6 MV Field Edge. Phys Med Biol (2004) 49:N293–N301. doi:10.1088/0031-9155/49/18/n01
13. Kry SF, Bednarz B, Howell RM, Dauer L, Followill D, Klein E, et al. AAPM TG 158: Measurement and Calculation of Doses outside the Treated Volume from External-Beam Radiation Therapy. Med Phys (2017) 44:e391–e429. doi:10.1002/mp.12462
14. Chan MF, Song Y, Dauer LT, Li J, Huang D, Burman C. Estimating Dose to Implantable Cardioverter-Defibrillator outside the Treatment fields Using a Skin QED Diode, Optically Stimulated Luminescent Dosimeters, and LiF Thermoluminescent Dosimeters. Med Dosimetry (2012) 37:334–8. doi:10.1016/j.meddos.2011.11.007
15. Scarboro SB, Followill DS, Howell RM, Kry SF. Variations in Photon Energy Spectra of a 6 MV Beam and Their Impact on TLD Response. Med Phys (2011) 38:2619–28. doi:10.1118/1.3575419
16. Jang SY, Liu HH, Mohan R, Siebers JV. Variations in Energy Spectra and Water-To-Material Stopping-Power Ratios in Three-Dimensional Conformal and Intensity-Modulated Photon fields. Med Phys (2007) 34:1388–97. doi:10.1118/1.2710550
17. Ding GX. Energy Spectra, Angular Spread, Fluence Profiles and Dose Distributions of 6 and 18 MV Photon Beams: Results of Monte Carlo Simulations for a Varian 2100EX Accelerator. Phys Med Biol (2002) 47:1025–46. doi:10.1088/0031-9155/47/7/303
18. Mohamed B, Maghnouj A, Tajmouati J, Didi A. Study of the Volume Reduction Impact on Secondary Photons Emergent from Flattening Filter for High Radiotherapy Quality. Pol J Med Phys Eng (2019) 25:23–8 .
19. Benmakhlouf H, Sempau J, Andreo P. Output Correction Factors for Nine Small Field Detectors in 6 MV Radiation Therapy Photon Beams: A PENELOPE Monte Carlo Study. Med Phys (2014) 41:041711. doi:10.1118/1.4868695
20. Benmakhlouf H, Andreo P. Spectral Distribution of Particle Fluence in Small Field Detectors and its Implication on Small Field Dosimetry. Med Phys (2017) 44:713–24. doi:10.1002/mp.12042
21. Andreo P. The Physics of Small Megavoltage Photon Beam Dosimetry. Radiother Oncol (2018) 126:205–13. doi:10.1016/j.radonc.2017.11.001
22. Hedin E, Back A, Chakarova R. PHASESPACE in IAEA Format for Varian Clinac iX at 6 MV (2006). Availableat: www-nds.iaea.org/phsp/photon/, https://www-nds.iaea.org/phsp/photon1/VarianClinaciX_6MV-readme.pdf.
23. Cabrera-Santiago A, Massillon-Jl G. Track-average LET of Secondary Electrons Generated in LiF:Mg,Ti and Liquid Water by 20-300 kV x-ray,137Cs and60Co Beams. Phys Med Biol (2016) 61:7919–33. doi:10.1088/0031-9155/61/22/7919
24. Massillon-Jl G. Track and Dose-Average LET Dependence of Gafchromic EBT3 and MD-V3 Films Exposed to Low-Energy Photons. Sci Rep (2020) 10:2361–70. doi:10.1038/s41598-020-59233-7
25. Kawrakow I, Mainegra-Hing E, Rogers D, Tessier F, Walters BRB. The EGSnrc Code System: Monte Carlo Simulation of Electron and Photon Transport, NRCC Report PIRS-701 (2016).
Keywords: low-energy electrons, Monte Carlo simulation, EGSnrc, linear accelerator, small field dosimetry, secondary radiation effect, mean photon energy, radiation outside the field-edge
Citation: Xicohténcatl-Hernández N, Moreno-Ramirez A and Massillon-JL G (2021) Electron and Photon Energy Spectra Outside of 6 MV X-ray Small Radiotherapy Field Edges Produced by a Varian iX Linac. Front. Phys. 9:656922. doi: 10.3389/fphy.2021.656922
Received: 07 May 2021; Accepted: 17 August 2021;
Published: 30 September 2021.
Edited by:
Christer Frojdh, Mid Sweden University, SwedenReviewed by:
Abdessamad Didi, National Energy Center of Nuclear Science and Technology, MoroccoMaria F. Chan, Memorial Sloan Kettering Cancer Center, United States
Copyright © 2021 Xicohténcatl-Hernández, Moreno-Ramirez and Massillon-JL. This is an open-access article distributed under the terms of the Creative Commons Attribution License (CC BY). The use, distribution or reproduction in other forums is permitted, provided the original author(s) and the copyright owner(s) are credited and that the original publication in this journal is cited, in accordance with accepted academic practice. No use, distribution or reproduction is permitted which does not comply with these terms.
*Correspondence: Guerda Massillon-JL, bWFzc2lsbG9uQGZpc2ljYS51bmFtLm14
†These authors have contributed equally to this work and share first authorship