 Chen Wang
 Xiaoming Liu
 Lu Gan
 Qing Cai
- 1School of Physics and Electronic Engineering, Anhui Normal University, Wuhu, China
- 2Anhui Provincial Engineering Laboratory on Information Fusion and Control of Intelligent Robot, Wuhu, China
- 3Shanghai Institute of Measurement and Testing Technology, Shanghai, China
A dual-band non-destructive dielectric constant sensor based on the complementary split ring resonators is presented. The resonators for both bands use the complementary split ring structure of different sizes. Numerical simulation demonstrates that the resonating frequency and quality factor is dependent on the variation of dielectric constant and loss tangent, making it a potential structure for dielectric measurement. To search for the optimal thickness for measurement, parametric study is conducted and the retrieval expressions are obtained for both bands. The measured results indicate an accuracy of 1.5% in comparison with the data in the literature. In addition, the effect of air gap has been analyzed, showing that it is an important error source and eliminating such effect can improve the measurement accuracy.
Introduction
Dielectric constant is fundamental physical property for dielectric or insulating materials [1]. It is also a critical parameter in many engineering areas. For instance, in the design of microwave and millimeter wave planar circuits, the dielectric constant of the substrate material has to be known as a priori. With the fast evolving of electronic technologies, materials are involved in many areas such as manufacturing processing, antenna design, and aerospace technology [2–5]. Therefore, precision measurement of the dielectric constant is becoming more and more critical.
Many methods for dielectric constant measurement have been developed, such as the free space method, the transmission line method, and the resonant cavity method. The free space method uses free space as transmission medium, and is suitable for dielectric measurement in the millimeter wave range [6, 7]. In addition, this method requires a slab of large area planar sample for measurement. The transmission line method requires the material to be placed inside a part of the enclosed transmission line during measurement [8]. The dielectric constant of the material is calculated from the reflected coefficients (S11) and the transmission coefficients (S21). However, the transmission line method requires the sample precisely fabricated to be fitted in the transmission line [9]. In addition, it is not good enough for measurement of low loss materials.
The resonant cavity method is a precision method for low loss material measurement. The dielectric constant is extracted from the resonant frequencies and quality factors [10–12]. The traditional resonating method requires sample placed inside the chamber of a cavity, which inevitably makes the operation less convenient [13, 14].
In recent years, micro strip line based planar resonator sensors have been developed [15–17]. One of the resonators is so called the complementary split ring resonator (CSRR) sensor. It can measure the dielectric constant of a material with high sensitivity [18]. An improved circular CSRR structure is reported in Ref. [19], where higher quality factor and sensitivity has been reached than the single slit CSRR structure. These sensors, however, are still working in a single band. Nowadays, the communication system with dual-band or multiband operation has been widely deployed. In this connection, multi-band measurement of dielectric property is preferred.
This paper investigated the feasibility of dual-band CSRR structure for dielectric constant measurement. Theoretically, the resonant frequency of a CSRR structure is proportional to its size. Being inspired by this property, two CSRR structures of different dimensions are built on a single substrate aiming at creating two resonating frequencies. In order to verify this design, theoretical model is built and extensive simulation analysis is conducted. Based on the analysis, the circuit model is built, the optimal thickness for measurement is obtained numerically, and retrieval expressions are also reached. Finally, the air gap effect is discussed.
In order to convey the concept as well as demonstrate the feasibility of this work. The following parts of this paper are organized as follows: Section II introduces the fundamental theories of resonator sensor and the CSRR sensor; Section III is devoted to the methods covering simulation, modeling and dielectric retrieve; Section IV presents the measurements and error analysis; and Section V concludes this work.
Fundamental Theories for Resonator and CSRR
Dielectric Measurement Based on Resonator
For a conventional resonator sensor, the relationship between the change of resonant frequency Δfr/fr and the dielectric constant and permeability of the sample can generally be expressed by [20].
where, Vc is the cavity volume, Δε is the change in complex permittivity, Δμ is the change in complex permeability, ε0 and μ0 are the free space permittivity and permeability, respectively. The electric and the magnetic fields of the empty cavity are denoted asE0 and H0, while E1 andH1 represent the electric and the magnetic fields under loaded condition, respectively. For electrically small samples, the electric and the magnetic fields inside the resonator, before and after loading the sample, are assumed to be unchanged. For dielectric materials, the change in complex permeability μ may be assumed to be zero. Also, the electric energy must be equal to the magnetic field energy stored in the resonant structure at the resonant frequency. Under these conditions, the frequency shift can be simplified as
where, Vs is the sample volume.
This is a general description of resonator for dielectric measurement. Such a method, however, is in practice only suitable for well-defined structure and field distribution (or mode). For a structure of a bit more complicated, closed form for frequency shift is usually difficult to find. With the rapid development of numerical techniques, simulation methods have been widely used in the calculation of complicated structures. In addition, more details can be derived from the simulation results.
Dielectric Measurement Based on CSRR Resonator
Several geometries based on the CSRR structure have been proposed in the Literature [21–24]. In material characterization, the sensitivity of the planar sensor is of the primary concern, which is further associated with the electric and the magnetic field intensity present across the planar architecture. It has been recognized that circular resonator may provide better accuracy [25].
The CSRR structure is illustrated in Figure 1A. The quasi-static electrically small resonators are usually designed with a loop and a gap separating the loop into two parts. The electrically small structure resonates due to inductance induced by circulating current in the loop and the effective capacitance developed across the gap between the loops. The change in capacitance of CSRR usually depends on the change in the permittivity of the material under test (MUT), whereas the inductance of the CSRR is considered to be unchanged in case of dielectric materials.
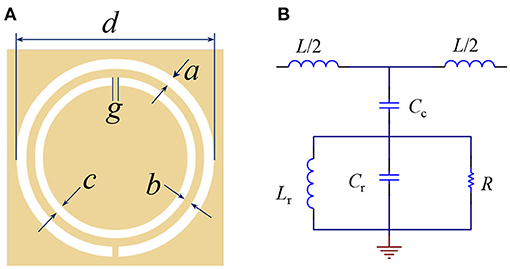
Figure 1. Structure and equivalent model of the CSRR sensor. (A) The schematic structure; (B) Equivalent circuit model.
This structure can be modeled using an equivalent circuit, as shown in Figure 1B, where, Lr, Crrepresent the inductance and capacitance of CSRR, respectively, Lis the line inductance, Cc is the coupling capacitance between micro strip line and CSRR. To extract the exact values of these components, full wave simulation using HFSS in couple with ADS simulation has to be conducted [26].
After these parameters are determined, it can be drawn from Figure 2 that the relationship between the resonant frequency can be written as
This is a fast way to estimate the resonating frequency and the dimension. In the previous publications, only one operation band was achieved. In order to obtain dual-band operation, two identical CSRR structures of difference sizes are used, as shown in Figure 2A. The larger CSRR structure works in lower frequency band, and the smaller one in higher frequency band. These two structures are separated by a certain distance in order to reduce mutual coupling.
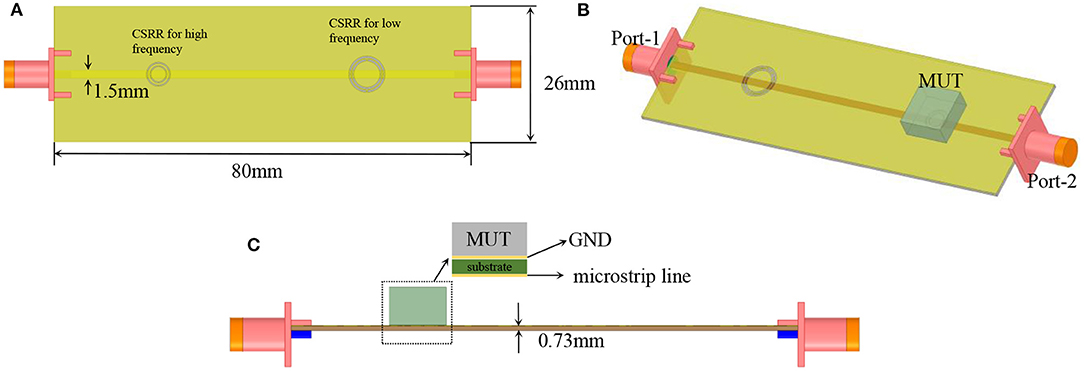
Figure 2. Double circular CSRR structure (A) Top view with substrate; (B) MUT is placed on the CSRR surface; (C) side view of the structure.
Two circular CSRR structures are etched out from the GND layer. MUT is placed on top of the CSRR and covers it completely. Field will be coupled to the sample though the circular slots, therefore, it is expected that such field-matter interaction will be reflected in the transmission coefficient of this structure.
The Simulation Results for Unloaded Dual-Band CSRR
Before any measurement can be conducted, the dual-band CSRR has to be designed. In this work, we choose 1.8GHz-2.8GHz and 3.5GHz-5GHz as two separate working bands for measurement. By placing two CSRRs on the same sensor, and through optimization, the following parameters as shown in Table 1 are reached. In this design, the substrate is FR4 with the dielectric constant being 4.9. The extracted lumped parameters for each component in Figure 1B are presented in Table 2.
Table 1. The main parameters for the two operation bands.
Table 2. The lumped parameters for the equivalent circuits.
In this work, the full wave simulation was conducted using HFSS. And the circuit simulation was done using ADS. The full wave simulation is to precisely predict the response of the design and the ADS simulation is to fast pinpoint the resonating frequencies. The simulated results for unloaded situation are plotted in Figure 3. The reason for using S21 as representative data is that S21 is closely related to the resonating frequency and the quality factor. It is clearly seen that the simulated results using HFSS and ADS demonstrated very good agreement in terms of resonating frequencies. The discrepancy in the transmission coefficient outside the resonating frequencies is due to the fact that the circuit theory only reflects the resonating frequency. More complicated modeling has to be built to fully model the structure.
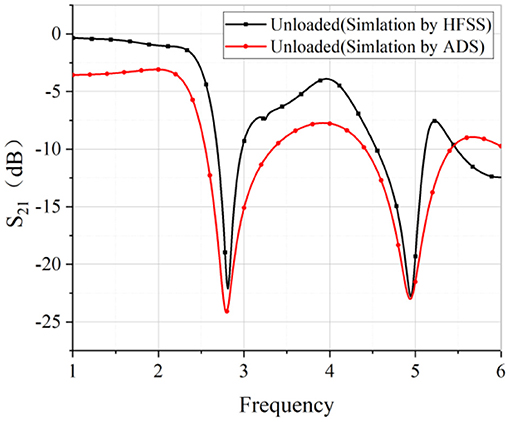
Figure 3. The transmission coefficient on unloaded cases.
After mounting the sample to the top of each CSRR resonator, the resonating frequency undergoes shift, and the quality factor will also show variation with the loss tangent. It is seen from Figures 4A,B, when the sample is placed at the low-frequency CSRR, the first resonance changes accordingly with εr, while the position of the second resonance remains unchanged. Keepεrunchanged, varying the loss tangent will not change the resonating frequencies of either band, however, the quality factor (the depth of the resonance) will be changed noticeably. Placing the sample at the second CSRR, the same observations can be made, as shown in Figures 4C,D. It is also noticed that the quality factor is also dependent on the dielectric constant. Such phenomenon is evident by that the Resonate depth is varying with the dielectric constant. In summary, such properties can be made for use of dielectric constant measurement as single value functions can be derived, as shown in Figure 5.
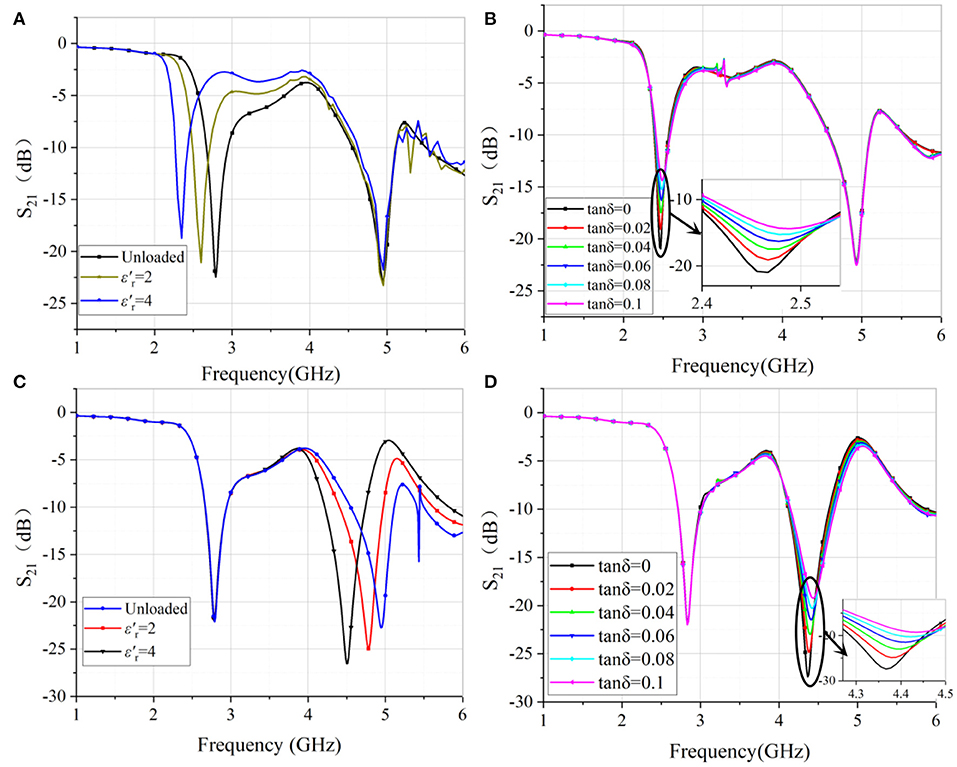
Figure 4. S21 parameters of samples (A) with different dielectric constants at 1.8GHz-2.8GHz; (B) with different loss tangent when the at 1.8GHz-2.8GHz (sample thickness = 6mm); (C) with different dielectric constants at 3.5GHz-5GHz; (D) with different loss tangent when the at 3.5GHz-5GHz (sample thickness = 4 mm).
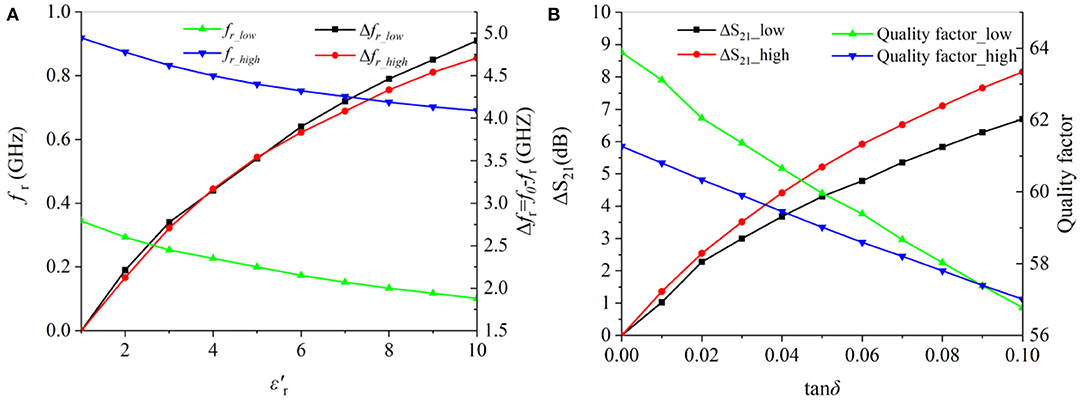
Figure 5. S21 parameters of samples (A) with different dielectric constants1.8GHz-2.8GHz; (B) with different loss tangent 3.5GHz-5GHz.
Methods
Up to now, we have demonstrated that the transmission coefficient S21 does reflect the changing of dielectric constant and loss tangent. To extract the parameter from S21, a method has to be developed. Also, some practical aspects, such as the optimal thickness of the sample has to be considered. In next section, quantitative analysis on the variation of the resonating frequency and quality factor with the dielectric property will be analyzed, aiming to reach a reliable expression for dielectric constant extract.
Variation of Resonating Frequency and Quality Factor With Dielectric Constant
The resonating frequency at each is recorded, and Δfr is calculated using Δfr = f0−fr. As the dielectric constant changes, the resonant frequency also gradually increases in a nonlinear manner. This indicates that the variation of the frequency is a single value function of the permittivity and loss tangent.
It is found during the analysis that the sample thickness will affect the measurement results. To search for the optimal thickness for measurement, parametric study over a range of thickness is conducted. The analysis results are plotted in Figure 6.
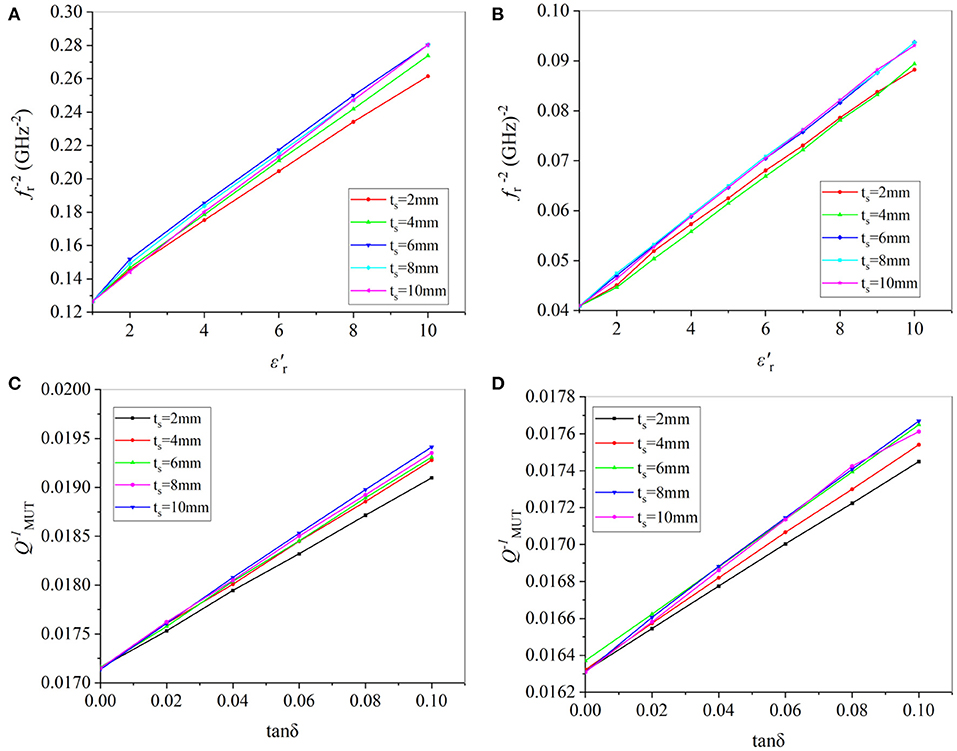
Figure 6. Thickness effects. (A) vs. for different thickness at 1.8GHz-2.8GHz; (B) vs. for different thickness at 3.5GHz-5GHz; (C) vs. tanδ for different thickness at 1.8GHz-2.8 GHz; (D) vs. tanδ for different thickness at 3.5GHz-5GHz.
It is seen from Figures 6A,B, for the lower frequency band, both the dielectric constant and the loss tangent present good linearity when the sample thickness is 6 mm. Therefore, it is best to prepare 6 mm thick sample for measurement in the low frequency band. And one has
Similar, the optimal sample thickness for the higher frequency band is 4 mm, and one has
It is reasonable that the lower frequency requires larger sample and the higher frequency needs smaller one. This is closely related to the electrical size of each resonator.
Theoretically, the dielectric constant of the MUT in two different frequency bands can be calculated separately by Equations (4) and (5), which are very close to relationship of .
It can be seen from Figures 6C,D that the relationship between and tanδ is a linear function for the tested sample of selected thickness. The specific calculation method of is related to its QU at unloaded and the S21 parameter coefficient after adding load [27].
QU is the quality factor of the sensor at unload. It is calculated from the center frequency and the frequency at−3dB. The loaded quality factor will be used for retrieval of the loss tangent. However, Equation (6) does not take into account the mutual effect of involving dielectric constant and loss tangent. In this regard, new fitting formulae will be derived in later section to retrieve the loss tangent more accurately.
Building the Permittivity Retrieval Function of Resonating Frequency and Quality Factor
The samples with dielectric constants and loss tangents are simulated in two Frequency bands, and two sets of curves are obtained, as shown in Figure 6. It is seen from Figure 6, the numerical models in the two frequency bands can be fitted separately. In many cases, the permittivity is also expressed using dielectric constant and imaginary part. The imaginary part of the complex permittivity of the MUT can be expressed by the loss tangent value, and the loss tangent value can be calculated by the QMUT and . The formula can be written as [28].
Two models of Rational Taylor [29] and Extreme Cum [30] are used to fit the functions corresponding to the two frequency bands. In the Rational Talor model, both nominator and denominator are polynomial of the dielectric constant and the quality factor. For the Extreme Cum model, the fitting Function are exponential polynomial. The Goodness of fitting of a statistical model describes how well it fits simulation data [31], and is denoted by R2. It is equal to the ratio of the regression sum of squares to the total sum of squares. The closer the R2 of the function model is to 1, the better the fit of the function established by the model. Fitting the data in Figure 7 using the two models, the following equations can be obtained for low and high frequency bands, respectively. For the low-frequency band, the imaginary part can be calculated using
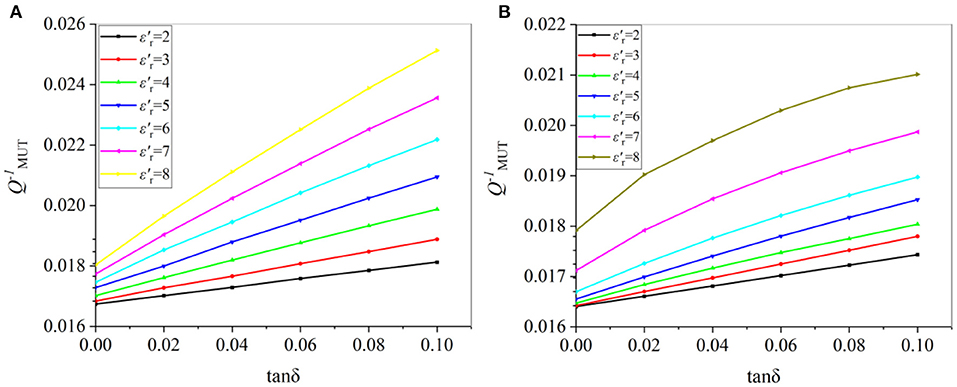
Figure 7. The linear relationship between the reciprocal of the factor and tanδ under different εr′ values in the band of (A) 1.8GHz-2.8GHz; (B) 3.5GHz-5GHz.
where
And for the high-frequency band
where
and
Putting and into these equations, the loss tangent under the two frequency bands can be calculated. Here, the R2 of Rational Taylor and Extreme Cum is 0.9977 and 0.9752, respectively. They are sufficiently good for data retrieve.
Measurements and Results
Measurements
The sensor is manufactured using planar PCB technology, as shown in Figure 8. The substrate is 0.8 mm thick FR4 substrate with 4.9 dielectric constant. A pair of 50 Ω SMA connectors are soldered onto both ends of the sensor. Measurement was done using a vector network analyzer (VNA) Ceyear AV3672D. The VNA is calibrated using a standard short-load-open-thru (SLOT) method with a 3211-3.5mm calibration kit. The measurement frequency was 1 GHz - 6 GHz.
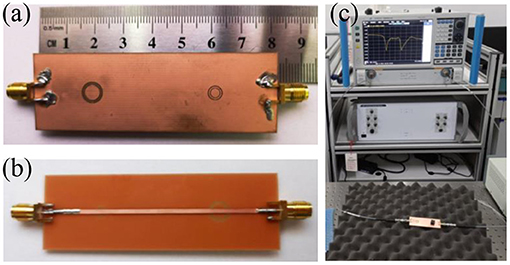
Figure 8. Experimental verification. (a) Top view of the CSCR; (b) Bottom view of the CSRR; (c) Experiment set up.
After calibrating the system, the S21 of unloaded situation was first measured. Then, several samples were measured by placing these samples at the two CSRRs consecutively. The transmission coefficients S21 are plotted in Figure 9. From the measured data, the resonating frequency and the quality fact can be deduced. And therefore, the dielectric constant and loss tangent can be calculated by using the simulated results. The retrieved results are tabulated in Table 3, with comparison with the data in the literature [32, 33].
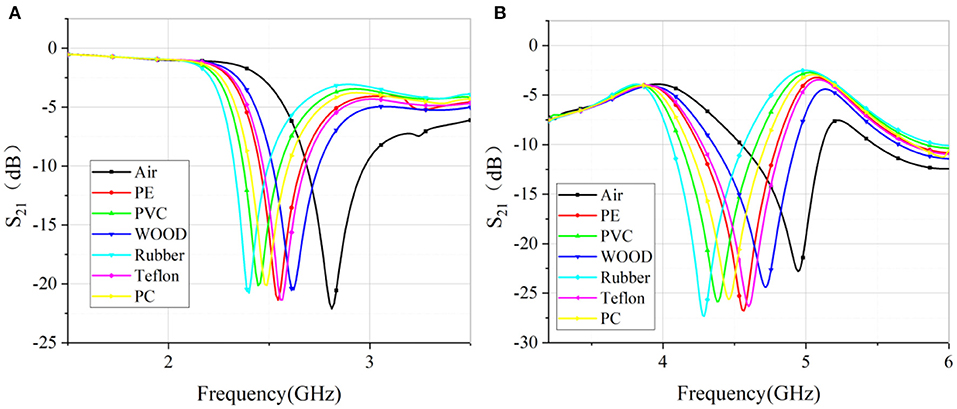
Figure 9. (A) Measured S21 (dB) for various dielectric samples at 1.8GHz-2.8GHz. (B). Measured S21 (dB) for various dielectric samples at 3.5GHz-5GHz.
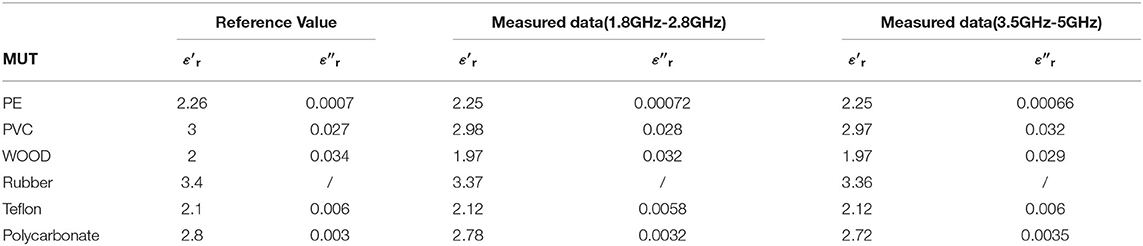
Table 3. Comparison between measured results of this work and data in the literature.
It is seen from the results that the agreement between the simulation and measurement is pretty good. For most samples, the accuracy of the dielectric constant is smaller than 1.5%. The only exception is Polycarbonate, the discrepancy is 5%. The loss factor is also very close to the provided value in the literature. For the polycarbonate, the discrepancy is very much dependent on the difference in the sample since polycarbonate has very broad range of permittivity.
The Effects of Air Gap
When using a sensor with a CSRR structure to accurately measure the complex permittivity, the air gap between the GND layer and the sample surface is an important factor affecting the measurement results. In this paper, an approximate model of the air gap is set up through HFSS. The thickness of the air gap is set to be 0 to 80μm, and various dielectric constants in the range of 1 to 10 are simulated. The material is polypropylene. The relationship between and in different frequency bands is shown in Figure 10. It is clearly seen that the slope of the curve decreases as the thickness of the air gap increases. This is reasonable since with the increase of the air gap, more energy will be stored in the air gap so that the effective dielectric constant is reduced. This will in turn reduce the frequency shift. The air gap effect is a challenge for micro strip based dielectric measurement. To account for this effect, a realistic way is to consider the air gap as part of the structure. By so doing, more precise value can be obtained.
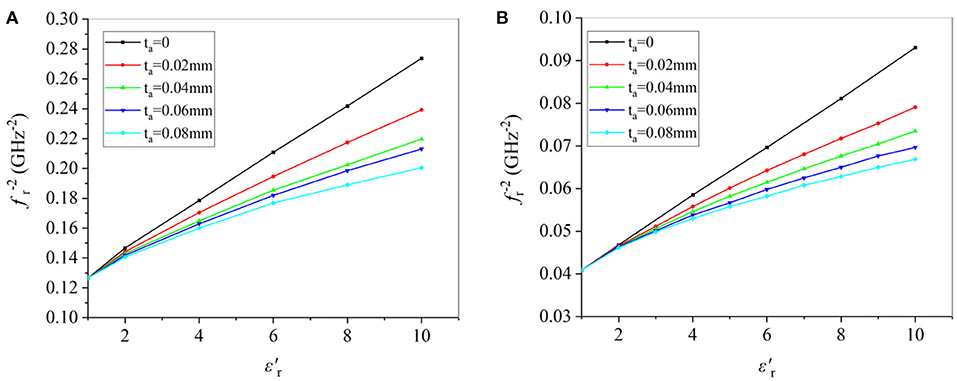
Figure 10. Plot of with real permittivity at different air gap ranging from 0 to 80μm at (A) 1.8GHz-2.8GHz; (B) 3.5GHz-5GHz.
Fitting the data in Figure 10, the relationship between the dielectric constant and the air gap can be obtained.
Both Equations (13) and (14) are fitted with Poly2D models [30], and their R2 are 0.9916 and 0.9895 respectively.
To apply these formulae, the air gap has to be precisely measured. And the frequency shift has to be measured using either a VNA or a spectrum analyzer. This method can be used separately, but they are not general ones that can be used to other structures. However, this method can be instructive to dielectric measurement.
Taking the wood in Table 3 as an example. Measure the degree of adhesion between the wood and the CSRR surface by microscope micrometer, the air gap is 3um. Corrected by Equations (13) and (14), the dielectric constants are 2 and 1.99 in the two frequency bands respectively. The corrected values are much closer to the values in the literature.
Conclusion
A dual-band non-destructive dielectric measurement sensor based on complementary split-ring resonator has been studied and experimentally verified. By pacing two complementary split-ring resonators with a proper separation distance on the same sensor, dual-band operation has been realized with excellent isolation. The measured results demonstrated very good agreement with the data in the literature. In addition, the air-gap effects have been analyzed and better agreement can be obtained.
Data Availability Statement
The raw data supporting the conclusions of this article will be made available by the authors, without undue reservation.
Author Contributions
CW did the simulation and measurement. XL proposed the idea and designed the measurement and finalized the edition. CW and XL prepared the draft. LG and QC did investigation. All authors contributed to the article and approved the submitted version.
Funding
This work was supported by the National Natural Science Foundation of China under Contract 61871003, and the open project of the State Key Laboratory of complex electromagnetic environment effects on electronics and information system under Grant CEMEE2021Z0201B, and the open-ended Foundation of National Radar Signal Processing Laboratory under Grant 61424100105.
Conflict of Interest
The authors declare that the research was conducted in the absence of any commercial or financial relationships that could be construed as a potential conflict of interest.
References
1. Kirichek A, Chassagne C, Ghose R. Predicting the dielectric response of saturated sandstones using a 2-electrode measuring system. Front Phys. (2019) 6:148. doi: 10.3389/fphy.2018.00148
2. Adamietz R, Desmulliez MPY, Pavuluri SK, Tilford T, Bailey C, Schreier-Alt T, et al. Reliability testing and stress measurement of QFN packages encapsulated by an open-ended microwave curing system. ieee transactions on components, packaging and manufacturing technology. IEEE Transcations on components, packaging and manufacturing technology. (2019) 9:173. doi: 10.1109/TCPMT.2018.2859031
3. Zhou Z, Feng W, Chen Y, Ge N. Adaptive scheduling for millimeter wave multi-beam satellite communication systems. J Commun Inf Netw. (2016) 1:42. doi: 10.1007/BF03391569
4. Liu X, Yu S, Gan L, Yu J. Broadband quasi-optical dielectric spectroscopy for solid and liquid samples. Int J Inf Mill Ter Waves. (2020) 41:810. doi: 10.1007/s10762-020-00710-5
5. Gowrish B, Mansour RR. A novel bandwidth reconfigurable waveguide filter for aerospace applications. IEEE Mic Wir Comp Lett. (2020) 30:577. doi: 10.1109/LMWC.2020.2989283
6. Tosaka T, Fujii K, Fukunaga K, Kasamatsu A. Development of complex relative permittivity measurement system based on free-space in 220–330-ghz range. IEEE Trans Ter Sci Tech. (2014) 5:102 doi: 10.1109/TTHZ.2014.2362013
7. Rashidian A, Shafai L, Klymyshyn D, Shafai C. A fast and efficient free-space dielectric measurement technique at mm-wave frequencies. IEEE Ant Wir Pro Lett. (2017) 16:2630. doi: 10.1109/LAWP.2017.2737632
8. Fontana N, Canicattì E, Monorchio A. An Application of the Virtual Transmission Line Model of an Open-Ended Coaxial Probe for Dielectric Properties Characterization of Biological Tissues. Atlanta, GA: 2019 IEEE International Symposium on Antennas and Propagation and USNC-URSI Radio Science Meeting (2019). p. 341.
9. Szostak K, Słobodzian P. Broadband dielectric measurement of PCB and substrate materials by means of a microstrip line of adjustable width. IEEE Mic Wir Comp Lett. (2018) 28:945. doi: 10.1109/LMWC.2018.2864196
10. Jha AK, Akhtar MJ. A generalized rectangular cavity approach for determination of complex permittivity of materials. IEEE Trans Inst Meas. (2014) 63:2632. doi: 10.1109/TIM.2014.2313415
11. Tiwari NK, Jha AK, Singh SP, Akhter Z, Varshney PK, Akhtar MJ. Generalized multimode SIW cavity-based sensor for retrieval of complex permittivity of materials. IEEE Tran Micro The Tech. (2018) 66:3063. doi: 10.1109/TMTT.2018.2830332
12. Boybay MS, Ramahi OM. Material characterization using complementary split-ring resonators. IEEE Tran Ins Meas. (2012) 61:3039. doi: 10.1109/TIM.2012.2203450
13. Muqaibel AH, Safaai-Jazi A, Riad SM. Fork-coupled resonators for high-frequency characterization of dielectric substrate materials. IEEE Trans Ins Meas. (2006) 55:2216. doi: 10.1109/TIM.2006.884390
14. Waldron I, Makarov SN, Biederman S, Ludwig R. Suspended ring resonator for dielectric constant measurement of foams. IEEE Micro Wir Comp Lett. (2006) 16:496. doi: 10.1109/LMWC.2006.880708
15. Mohd Bahar AA, Zakaria Z, Ab Rashid SR, Isa AAM, Alahnomi AR. High-Efficiency microwave planar resonator sensor based on bridge split ring topology. IEEE Micro Wir Comp Lett. (2017) 27:545. doi: 10.1109/LMWC.2017.2701338
16. Zarifi MH, Daneshmand M. Monitoring solid particle deposition in lossy medium using planar resonator sensor. IEEE Sens J. (2017) 17:7981. doi: 10.1109/JSEN.2017.2757027
17. Lim S, Kim C, Hong S. Simultaneous measurement of thickness and permittivity by means of the resonant frequency fitting of a microstrip line ring resonator. IEEE Micro Wir Comp Lett. (2018) 28:539. doi: 10.1109/LMWC.2018.2833202
18. Ansari MAH, Jha AK, Akhtar MJ. Design and application of the CSRR-based planar sensor for noninvasive measurement of complex permittivity. IEEE Sens J. (2015) 15:7181. doi: 10.1109/JSEN.2015.2469683
19. Tiwari NK, Tiwari Y, Akhtar MJ. Design of CSRR-based electronically tunable compact RF sensor for material testing. IEEE Sens J. (2018) 18:7450. doi: 10.1109/JSEN.2018.2861365
20. Chen LF, Ong CK, Neo CP, Varadan VV, Varadan VK. Microwave Electronics: Measurement and Materials Characterization New Jersey: John Wiley & Sons (2004).
21. Duran Sindreu M, Naqui J, Bonache J, Martin F. Split rings for metamaterial and microwave circuit design: a review of recent developments. Int J RF Micr Comp Aided Eng. (2012). 22:439 doi: 10.1002/mmce.20635
22. Gan HY, Zhao WS, He L, Yu Y, Xu K, Wen F, et al. A CSRR-loaded planar sensor for simultaneously measuring permittivity and permeability. IEEE Micro Wir Comp Lett. (2020) 30:219 doi: 10.1109/LMWC.2019.2957657
23. Saadat-Safa M, Nayyeri V, Khanjarian M, Soleimani M, Ramahi M. A CSRR-based sensor for full characterization of magneto-dielectric materials. IEEE Trans Micro Theory Tech. (2019) 67:806. doi: 10.1109/TMTT.2018.2882826
24. Oliveira João GD, Pinto EN, Silva Neto VP, D'Assunção AG. CSRR-based microwave sensor for dielectric materials characterization applied to soil water content determination. Sensors. (2020) 20:255. doi: 10.3390/s20010255
25. Govind G, Tiwari NK, Agrawal KK, Akhtar MJ. Microwave subsurface imaging of composite structures using complementary split ring resonators. IEEE Sens J. (2018) 18:7442. doi: 10.1109/JSEN.2018.2859228
26. Ebrahimi A, Withayachumnankul W, Al-Sarawi SF, Abbott D. Dual-mode behavior of the complementary electric-LC resonators loaded on transmission line: analysis and applications. J Appl Phys. (2014) 116:439. doi: 10.1063/1.4893751
27. Kai C, Hsieh L. Microwave ring circuits and related structures second edition. Cir Dev Mag IEEE. (2004) 22:36. doi: 10.1109/MCD.2006.1708387
30. Yongjiu S, Wei S, Yuanqing W, Yi L, Yue X. The Pressure Distribution of Insulating Glass Unites Under Thermal Gradient. Lushan: 2011 International Conference on Electric Technology and Civil Engineering (2011). p. 862.
31. Liu Q, Lee JD, Jordan MI. A kernelized stein discrepancy for goodness-of-fit tests. International conference on machine learning. Pro Mach Lear Res. arXiv:1602.03253 (2016) 276.
32. Ansys HFSS Material Library. (2020) Available online at: https://www.ansys.com/products/electronics/ansys-hfss (accessed March 28).
33. The Engineering Tool Box. Relative Permittivity-Dielectric Constant. (2015). Available online at: http://www.engineeringtoolbox.com/relative-permittivity-d_1660.html (accessed March 28).
Keywords: dielectric constant, dual band, loss tangent, resonate frequency, quality factor, complementary split ring resonator
Citation: Wang C, Liu X, Gan L and Cai Q (2021) A Dual-Band Non-destructive Dielectric Measurement Sensor Based on Complementary Split-Ring Resonator. Front. Phys. 9:669707. doi: 10.3389/fphy.2021.669707
Received: 19 February 2021; Accepted: 18 March 2021;
Published: 14 April 2021.
Edited by:
Jinjin Li, Shanghai Jiao Tong University, ChinaReviewed by:
Lingtao Kong, Hefei Institutes of Physical Science (CAS), ChinaZhen Peng, Chaohu University, China
Copyright © 2021 Wang, Liu, Gan and Cai. This is an open-access article distributed under the terms of the Creative Commons Attribution License (CC BY). The use, distribution or reproduction in other forums is permitted, provided the original author(s) and the copyright owner(s) are credited and that the original publication in this journal is cited, in accordance with accepted academic practice. No use, distribution or reproduction is permitted which does not comply with these terms.
*Correspondence: Xiaoming Liu, eGlhb21pbmcubGl1QGFobnUuZWR1LmNu