Abstract
Electrowetting display (EWD) device is a new type of reflective optoelectronic equipment with paper-like display performance. Due to the oil backflow phenomenon, it is difficult for pixels to be maintained a stable aperture ratio, so the grayscale of EWDs cannot be stabilized. To reduce the oil backflow in EWDs, a driving waveform composed of a driving signal and a periodic reset signal was proposed in this paper. A direct current (DC) signal was designed as the driving signal for driving pixels. The aperture ratio of pixels was determined by the amplitude of the DC signal. The periodic reset signal was divided into a charge release phase and a driving recovery phase. During the charge release phase, the driving voltage was abruptly dropped to 0 V for a period to release trapped charges. In the driving recovery phase, the driving voltage was rapidly increased from 0 V to a maximum value. To reach the same grayscale of EWDs, the driving waveform was returned to the driving signal at the end of the driving recovery phase. Experimental results showed that the aperture ratio of EWDs was unchanged when the driving waveform was applied. However, the aperture ratio of pixels was gradually decreased with the conventional driving waveform. It was indicated that the charge trapping effect and the oil backflow phenomenon can be effectively inhibited by the proposed driving waveform. Compared with the conventional driving waveform, the speed of oil backflow was reduced by 90.4%. The results demonstrated that the proposed driving waveform is beneficial for the achievement of stable grayscale in EWDs.
Introduction
As a reflective display technology, the electrophoretic display (EPD) technology [1] has been successfully applied in fields such as e-readers [2], electronic tags, and billboards. However, due to limitations of EPDs in response time [3] and color display [4], it is difficult to be used in application scenarios where rich colors and video display [5] are required.
The mentioned shortcomings of EPDs can be made up by the EWD technology [6] based on the electrowetting effect [7]. As a novel reflective display technology, the EWD has a response speed of milliseconds and can maintain high contrast and reflectivity in a strong light environment. In addition, the power consumption and the thickness of the device can be significantly reduced [8]. Therefore, the power consumption of EWDs is much lower than liquid crystal display (LCD) of equivalent size and solution. As the new generation of display technology, the driving system for EWDs has received wide attention [9, 10]. However, the charge trapping phenomenon can cause an asymmetric electrowetting effect [11], contact angle saturation, and oil backflow [12]. These problems not only directly lead to dielectric failure [13], but also make a challenge for the stable display and precise control of grayscales. The strength of the charge trapping effect is related to the polarity of the driving voltage, type, and pH value of the solution. It has been found that increasing the size of ions in the solution could reduce the risk of charge trapping effects [14]. According to the previous research, it was possible to reduce the charge trapping effect by introducing an oil layer [15], but this hypothesis has not yet been confirmed. Research results demonstrated that the saturation effect of contact angle could be suppressed by driving waveform modulation [16]. However, the maximum voltage of proposed driving waveform was up to 200 V. In addition, some driving waveforms of EWDs with a low voltage were designed, whereas the effect of hysteresis in EWDs was not considered by these driving waveforms [17, 18]. Even so, these excellent research results provided valuable experience and an important reference for reducing the charge trapping effect.
A well-designed driving waveform is an important method to improve the display performance of displays [19, 20]. Therefore, we analyzed the formation mechanism of oil backflow caused by the charge trapping effect. And then a new driving waveform for suppressing the charge trapping was proposed. To reduce the charge trapping effect, a reset signal was introduced into the driving waveform. This method could provide a new idea for achieving stable and precise control of grayscales for EWDs.
Principles of EWDs
Principle of Electrowetting-on-Dielectric
Electrowetting is to change the surface tension between solid-liquid interface by applying a voltage between conductive liquid and electrode. The related dynamics of electrowetting and the concept of EWDs were proposed in 1981 [7, 21]. With the introduction of a dielectric layer between the conductive liquid and the metal electrode, the problem of electrolysis of the electrode has been solved [22]. And the electrowetting model with a dielectric layer introduced is called electrowetting-on-dielectric (EWOD) [23]. The structure diagram of an EWOD model was shown in Figure 1. The conductive liquid is placed on the surface of the dielectric layer with hydrophobic properties. One of the electrodes was immersed in the conductive liquid drop, and the other electrode was under the dielectric layer substrate. When a voltage was applied between two electrodes of a pixel, the wettability of conductive liquid droplet can be increased. In this case, the solid-liquid interface and the dielectric layer can be taken as a parallel plate capacitor.
Figure 1
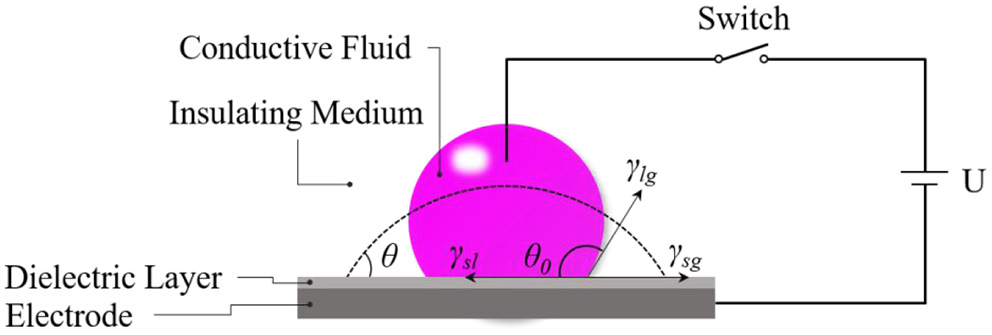
Schematic diagram of an EWOD. When no external voltage was applied, the conductive fluid was in a contracted state, as shown in the red part. When an appropriate driving voltage was applied, the contracted conductive droplet can be spread out, as shown by the dotted line.
When no voltage was applied between the conductive liquid and the metal electrode, the conductive liquid droplet can form an angle θ0 between the three-phase contact line and the hydrophobic dielectric layer with the action of surface tension. The angle θ0 is called the electrowetting contact angle. Since the size of a droplet is very small, the effect of gravity is negligible relative to the surface tension of the droplet. In the initial state, the relationship described by Formula (1) can be obtained according to the mechanical equilibrium along the surface of the hydrophobic insulating layer.
Then, the contact angle in the initial state can be expressed by the Formula (2).
In Formulas (1) and (2), θ0 is the contact angle of the solid-liquid interface. γsl, γsg, and γlg represent the surface tension of the solid-liquid, solid-gas, and liquid-gas interface, respectively.
When a voltage U was applied between the conductive liquid and the electrode, the surface tension γsl at the solid-liquid interface could be decreased. The relationship between the surface tension γsl and the voltage U can be described by the Lippmann equation, as shown in Formula (3).
Where, is the surface tension between the hydrophobic insulating layer and the conductive liquid when the voltage was applied. ε0 is the vacuum dielectric constant, εr is the relative dielectric constant of the dielectric layer. d is the effective thickness of the hydrophobic medium layer. Combined with Young's equation, the relationship between the contact angle of the solid-liquid interface and the applied voltage can be described by Formula (4), namely the Lippmann-Young equation.
According to Formulas (2) and (4), the relationship between contact angle and voltage can be written as Formula (5).
Where, θu was the solid-liquid contact angle when U was applied.
Principle of EWDs
EWOD is widely used in many fields such as digital microfluidics (DMF) [24–26], lab-on-chip [27, 28], micro-lens [29–31], and EWDs. In 2003, a reflective display based on the principle of EWOD was proposed [6].
The basic structure of EWDs was shown in Figure 2A. The optical laminated structure of the display device is composed of a white reflective substrate, a hydrophobic insulating layer, an indium tin oxide (ITO) electrode, oil film, and water. The white reflective substrate at the bottom of the device is an electrode coated with a hydrophobic insulating layer, and the hydrophobic insulating layer is covered with a layer of the colored oil. The transparent conductive liquid is connected to the water electrode, and the oil film is confined inside the surrounding pixel grid by pixel wall.
Figure 2
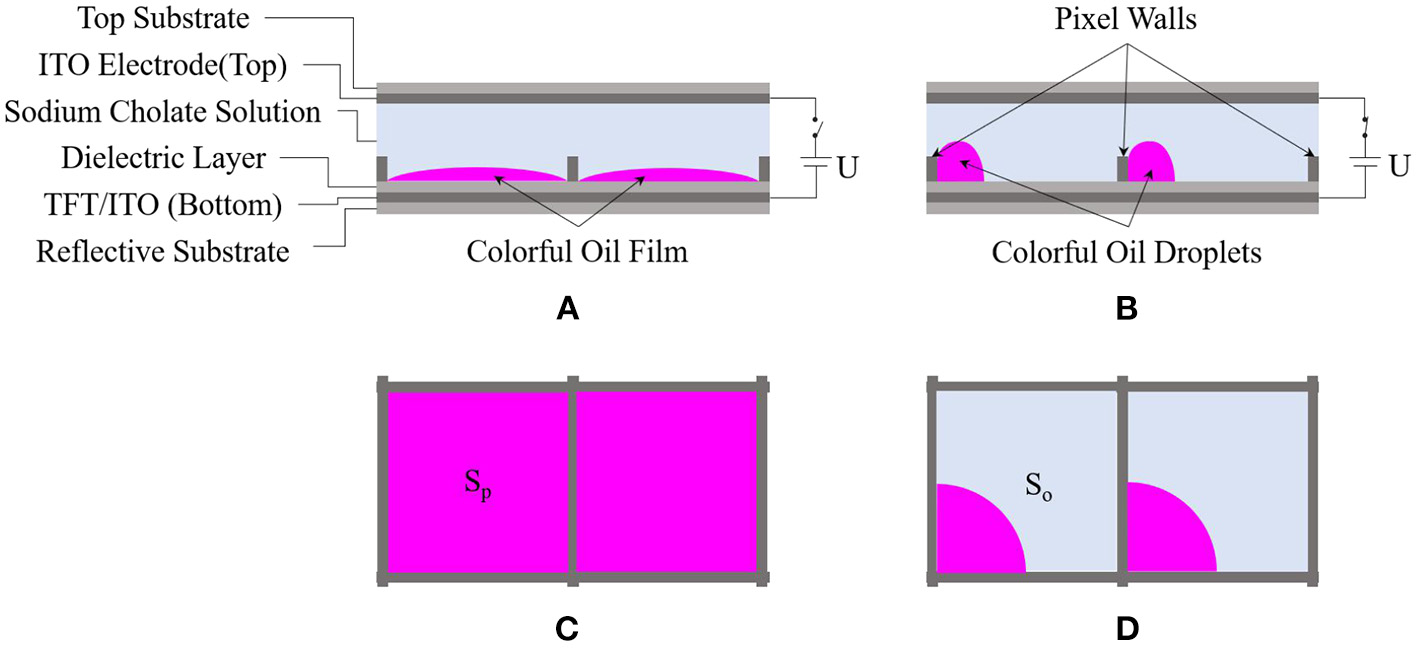
Schematic diagram of EWDs. When no voltage was applied, the colored oil was evenly spread out in the pixel grid, (A) is a side sectional view, (C) is a top view. When a voltage was applied, the spread oil film was squeezed to a corner of the pixel grid, (B) is the side cross-sectional view, (D) is the top view.
When no voltage was applied between the upper and lower substrates, the sum of interfacial tension at the oil-water interface and interfacial tension at the oil-solid interface is less than the interfacial tension at the water-solid interface. According to the principle of the lowest energy of a stable system, oil droplets can naturally stretch into an oil film and spread between the transparent conductive liquid and the hydrophobic insulating layer. At this time, the pixel grid was in a closed state, and the color of oil film was displayed, as shown in Figures 2A,C.
When a voltage was applied between the upper and lower substrates, the original equilibrium state of the system was broken, and the solid-liquid contact angle can be gradually decreased. With the action of an external electric field, the transparent conductive liquid was deformed and displaced. And then the hydrophobic insulating layer was infiltrated by the liquid. With the push of the transparent conductive liquid, the stretched oil film can shrink to a corner in a pixel grid. The contact area between the shrinking oil and the hydrophobic insulating layer was gradually decreased, and eventually, the entire system can reach a new equilibrium state. With the action of an external electric field, the shape of the opened pixel grid was shown in Figures 2B,D. The magnitude of the applied voltage determines the balance position of the corresponding electrostatic force and capillary force. Thus, the opening degree of the pixel grid was determined by the voltage applied between the upper and lower electrodes. Therefore, the grayscale of EWDs can be controlled by adjusting the magnitude of the applied voltage. The opening degree of the pixel grid can be characterized by the aperture ratio. The aperture ratio is defined as the ratio of the aperture area So to the total area of a pixel grid Sp, which can be described by the Formula (6).
Charge Trapping Effect and Oil Backflow Phenomenon
According to the Lippmann-Young equation, the change of the electrowetting contact angle in an ideal state is related to the square of U. Theoretically, the change in contact angle is only related to the magnitude of the applied voltage. The polarity of the applied voltage (positive or negative voltage) makes no difference in the change of a contact angle. However, it has been found that the change of contact angle during the electrowetting process showed a dependence on the polarity of driving voltages. The asymmetric electrowetting effect can be exacerbated because of the polarity dependence. The previous study has shown that the charge at the solid-liquid interface could be trapped by asymmetric electrowetting points with voltage polarity dependence [15]. To take the captured charges into account, a modification could be made to the Lippmann-Young equation. The modified Lippmann-Young equation can be described by Formula (7).
Where, UT represents the magnitude of the voltage generated by the trapped charges. σT represents the density of trapped charges, as shown in Formula (8). It has been found that there was indeed a charge trapping phenomenon during the electrowetting process [32]. According to the modified Lippmann-Young equation, a local reverse electric field can be formed at the interface between the dielectric and the water because of the charge trapping effect. The effective electric field at the three-phase contact line was weakened by the reverse electric field. The reverse electric field could be continuously strengthened by the accumulated charges. Therefore, the effective driving voltage between electrodes of pixel was indirectly reduced with the increasing of time. With a constant voltage applied, the electrowetting force would be reduced by the charge trapping effect. At the same time, the hydrophobicity of the medium layer was enhanced. In this situation, it is difficult for the three-phase contact line to be maintained in a fixed position. Therefore, the contracted oil droplets cannot be maintained in a stable state, and the oil droplets would be gradually spread out on the medium layers.
Experimental Methods
Experimental System
For evaluating the performance of the proposed driving waveform, an experimental platform was developed to measure the brightness of EWDs. The block diagram of experimental system was shown in Figure 3, and the picture of experimental platform was shown in Figure 4. The proposed experimental platform was composed of a waveform design module, a driving module, and a detection module. In the waveform design module, the waveform data generated by MATLAB was imported into the host software to obtain the corresponding waveform file. The driving module was composed of an arbitrary waveform generator and a power amplifier. The generated waveform files can be transferred to the arbitrary waveform generator by Universal Serial BUS (USB) interface. Since the amplitude of the driving waveform was limited by the arbitrary waveform generator, a power amplifier was used to amplify the driving waveform. To ensure that the designed driving waveform can be output correctly, an oscilloscope was added to observe the amplified driving waveform in real-time. Then, the amplified driving waveform was used to drive an EWD panel. The detection work was undertaken by the detection module composed of a reflection colorimeter and its host software. To characterize the performance of the EPD panel, the reflective colorimeter was placed on the EWD panel during the experiment. The brightness data of EWDs was collected by the host software of colorimeter with the USB interface.
Figure 3
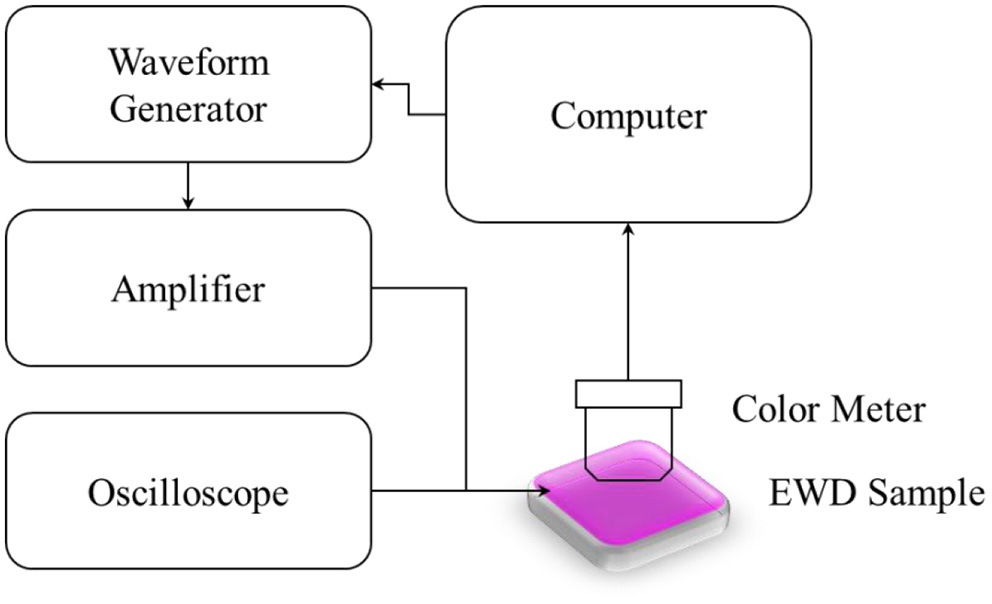
System diagram of the experimental platform. The experimental platform was mainly composed of an arbitrary waveform generator, an amplifier, an oscilloscope, and a colorimeter. The magenta EWD panel was used in experiments.
Figure 4
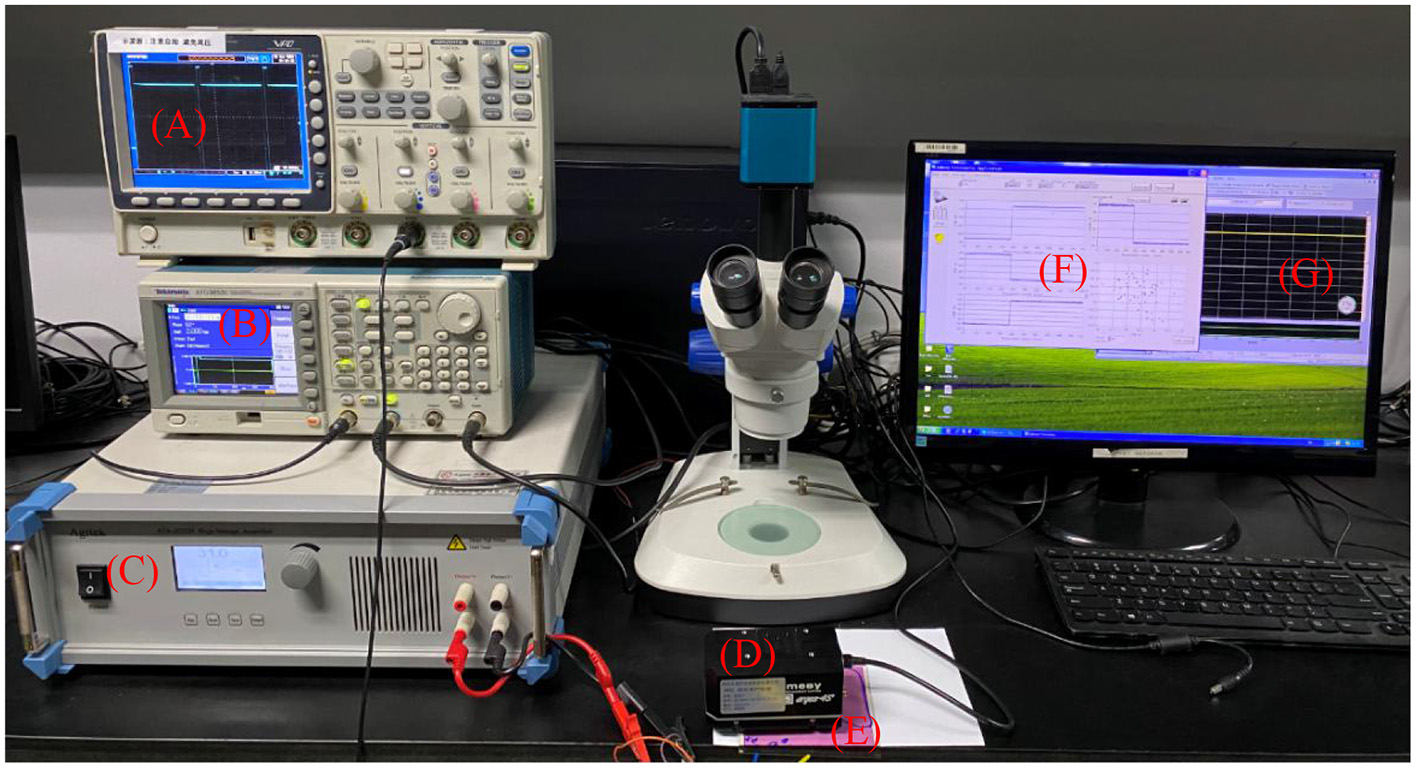
The experimental platform for driving EWDs. (A) Oscilloscope. (B) Arbitrary waveform generator. (C) Power amplifier. (D) Colorimeter. (E) EWD panel. (F) Host software of colorimeter. (G) Host software of waveform generator.
Measurement of Hysteresis Characteristic Curve of EWDs
According to the Lippmann-Young equation, the relationship between contact angle and applied voltage was not linear. Due to the contact angle hysteresis of EWDs, the state of EWDs was different at the different stages with the same driving voltage. To intuitively observe the non-linear relationship, a stepwise voltage was applied between electrodes of pixel. The driving waveform for the measurement of the hysteresis curve was shown in Figure 5.
Figure 5
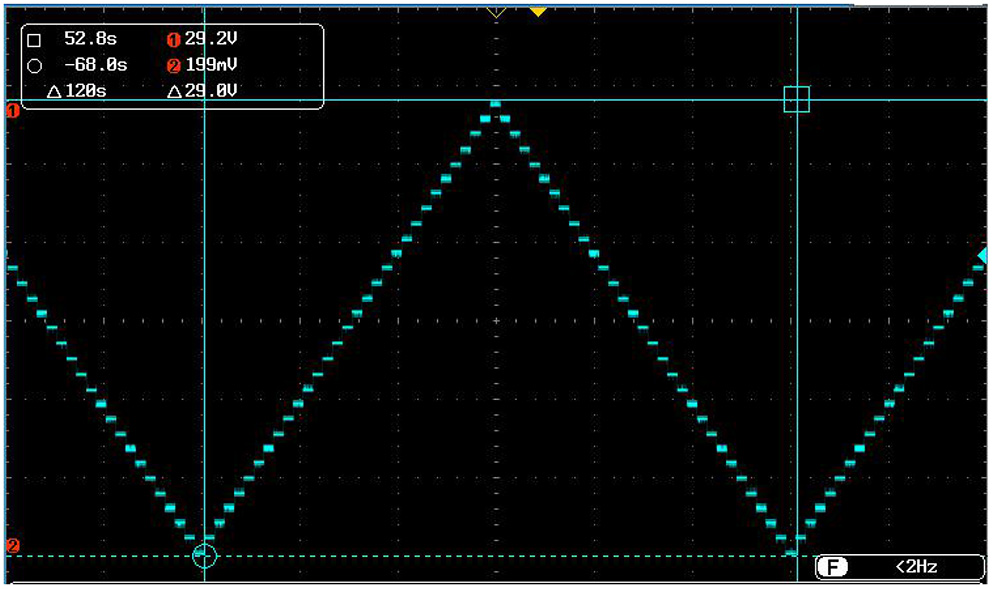
The driving waveform used to measure the hysteresis curve of an EWD. When a stepwise changing voltage was applied to an EWD, the brightness value of the EWD was measured by a reflection colorimeter in real-time.
It can be seen from Figure 5 that the driving waveform was consists of a rising phase and a falling phase. In the rising phase, the initial voltage applied to the EWD panel was 0 V, and then the voltage was increased by 0.5 V per second. When the voltage reached the maximum driving voltage of 30 V, the driving waveform was turned into a falling phase. In the falling phase, the voltage was reduced by 0.5 V per second until 0 V. The relationship between the luminance and driving voltage is shown in Figure 6.
Figure 6
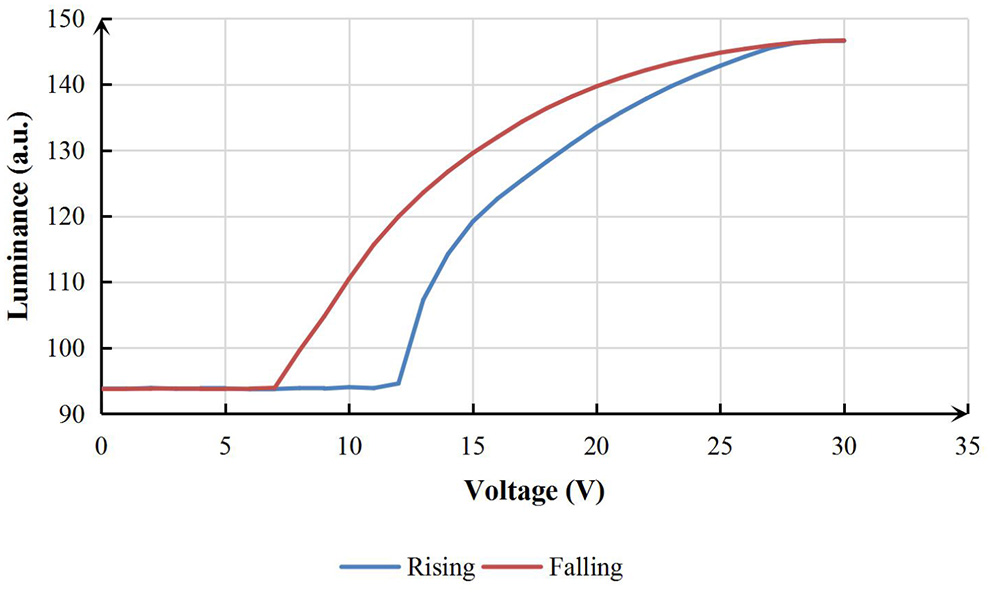
Hysteresis characteristic curve of EWDs.
It can be seen from Figure 6 that the brightness of the EWD during the voltage rising phase could not be overlapped with the brightness during falling phase at the same voltage. A non-negligible difference between two curves could be observed in most voltage ranges, especially when pixels were turned on. With the same driving voltage, the brightness of an EWD in the falling phase was higher than that in the rising stage. The hysteresis effect of EWDs was mainly caused by the inconsistency between the advancing contact angle and the receding contact angle [33]. Due to the hysteresis effect of EWDs, aperture ratio in the rising phase and the falling phase were different with the same driving voltage. Similar differences have appeared in the brightness and reflectivity of EWDs. To obtain a repeatable grayscale with the same driving voltage, the influence of the hysteresis effect of EWDs cannot be ignored. The impact of the hysteresis effect on grayscales should be minimized by the design of driving waveform. Considering that the curve of luminance-voltage in the falling phase was smoother, the voltage of relatively flat area was always used to drive EWDs in this paper.
Design of Driving Waveform
Due to the phenomenon of oil backflow, the state of oil film in pixels was difficult to be maintained. To achieve a stable grayscale of EWDs, a reset signal was introduced to the driving waveform. The shape of the proposed reset signal can be shown by the red line in Figure 7. The introduction of the reset signal was aimed at reducing the influence of oil backflow caused by the charge trapping effect.
Figure 7
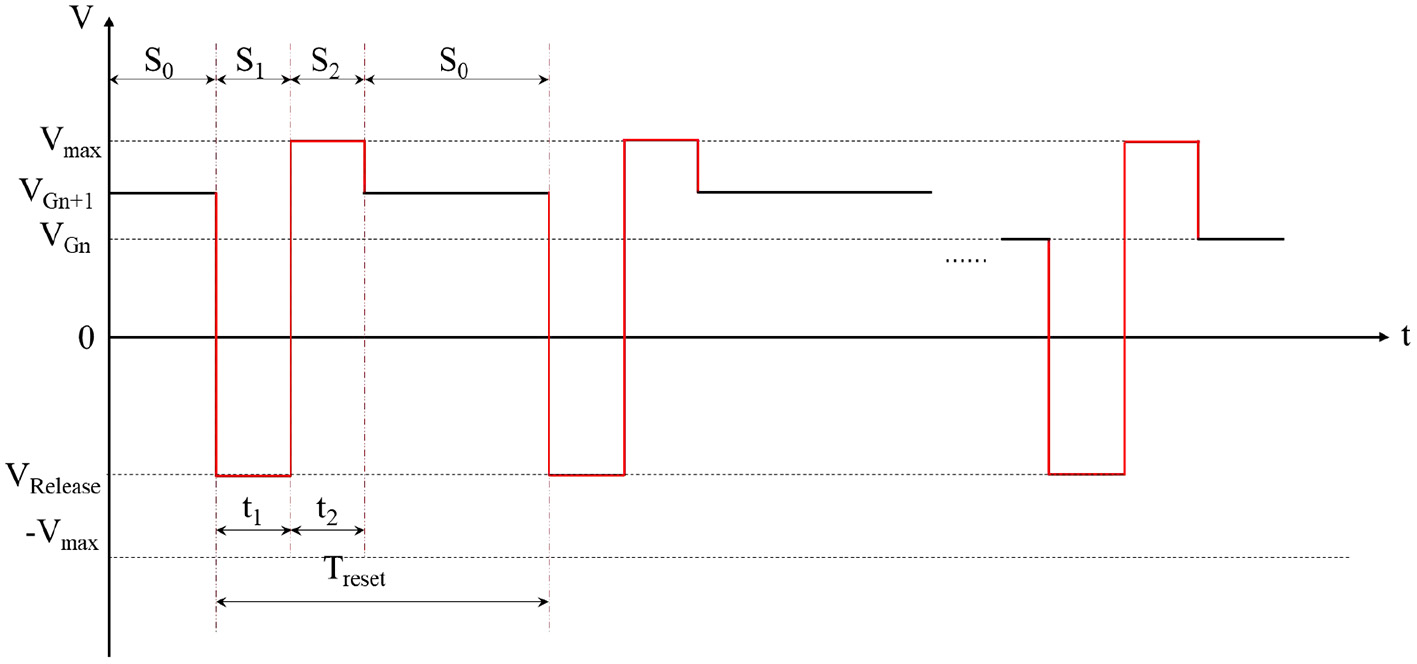
The diagram of driving waveform with a reset signal introduced. It can be used to reduce the influence of oil backflow in EWDs.
As shown in Figure 7, the proposed driving waveform can be divided into two parts: a driving signal S0 and a reset signal. The driving signal was used to turn on pixels, and the reset signal was used to release trapped charges. The effective driving voltage between electrodes of pixel could be maintained by discharging captured charges on time. In this way, the current equilibrium state of the oil film in pixel grids could be maintained. The reset signal can be divided into a charge release phase S1 and a driving recovery phase S2. Vmax represented the maximum driving voltage. VGn and VGn+1 represented the target voltage that was required to drive pixels to a grayscale. VRelease represented a driving voltage used in the charge release phase. Treset represented the period where the reset signal was applied. Durations of the charge release phase and the driving recovery phase in the reset signal were represented by t1 and t2, respectively. t1 + t2 represented the duration of the reset signal in one driving cycle.
The driving signal S0 was a DC signal. The DC signal was used to drive the EWD to the target grayscale. The amplitude of the driving voltage of the target grayscale can be determined by the hysteresis characteristic curve of EWDs. The reset signal was used to release captured charges. In the charge release phase of the reset signal, the release efficiency of the trapped charge was related to VRelease and t1. In the driving recovery phase of the reset signal, the maximum voltage Vmax was applied to obtain a better grayscale response. In an ideal state, a reset signal should be applied immediately before the oil backflow phenomenon appeared.
Experimental Results and Discussion
The Brightness Change of EWDs With DC Driving Voltage
To obtain the brightness curve of an EWD with the DC voltage, several different DC driving voltages were sequentially applied to EWDs. The time-varying curve of the brightness of an EWD driven by different DC voltages as shown in Figure 8.
Figure 8
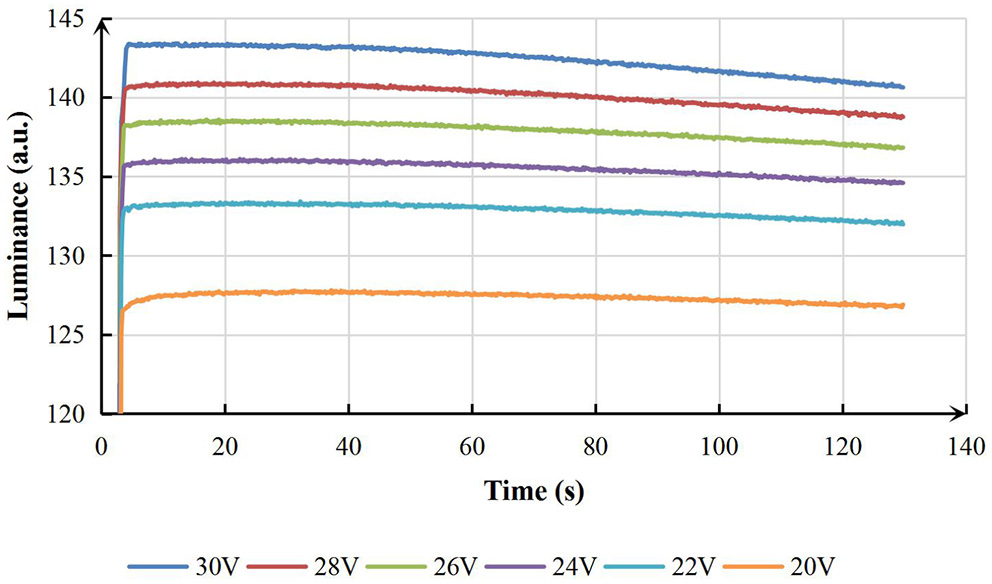
The relationship between brightness and driving time when an EWD panel was driven by different DC voltages.
It can be seen from Figure 8 that a higher brightness could be detected by the reflective colorimeter with a larger driving voltage. However, the state of EWDs cannot be maintained when the brightness reached the maximum value. The brightness value was gradually decreased at a certain rate as the driving time was increased. When the driving time was long enough, the brightness would be gradually decreased to a minimum value. When the amplitude of DC signal was reduced from 30 to 20 V, the decrease value of brightness was reduced from 2.770 to 0.729 a.u. within 109.4 s. The result showed that the drop gradient of brightness was faster with the higher driving voltage.
The Influence of Driving Waveforms With a Reset Signal on EWDs
According to the results of the DC driving experiment, it was found that the brightness of EWDs has different degrees of decline with different DC driving voltages due to the charge trapping effect. To suppress the charge trapping effect, a reset signal was introduced in the DC driving waveform. It can be seen that the shape of reset signal was determined by Treset, VRelease, t1 and t2. The driving voltage of target grayscales in phase S0 was set to 24 V. The brightness value of the EWD driven by different driving waveforms was used to characterize the performance of driving waveforms.
The brightness curve of an EWD at different frequencies was shown in Figure 9. Many peaks were observed in the curve of brightness when the driving frequency was set to 1 or 5 Hz. It was indicated that the brightness of the display had a large jitter. At this point, a strong flicker of EWDs can be directly observed. When the frequency of driving waveform was increased to 10 Hz, the number and amplitude of peaks were significantly decreased. At the same time, the obvious flicker cannot be observed on EWDs. When the frequency was increased to 50 Hz, there was no peak. It was shown that the high driving frequency was conducive to the stability of brightness or gray scales. However, the brightness of EWDs was decreased with the increase of driving frequency. In addition, an obvious downward trend has appeared when the driving frequency was increased to about 600 Hz. That's because the duration of the reset signal phase was shortened when the driving frequency was increased. If the duration of the reset signal was not enough, the target of suppressing charge trapping cannot be achieved. In this situation, it was difficult for EWDs to maintain a stable state. When the driving frequency was set to 50 Hz, the brightness can be stabilized at a higher value. In addition, the fluctuation cannot be directly observed. So, the frequency of the proposed driving waveform was set to 50 Hz.
Figure 9
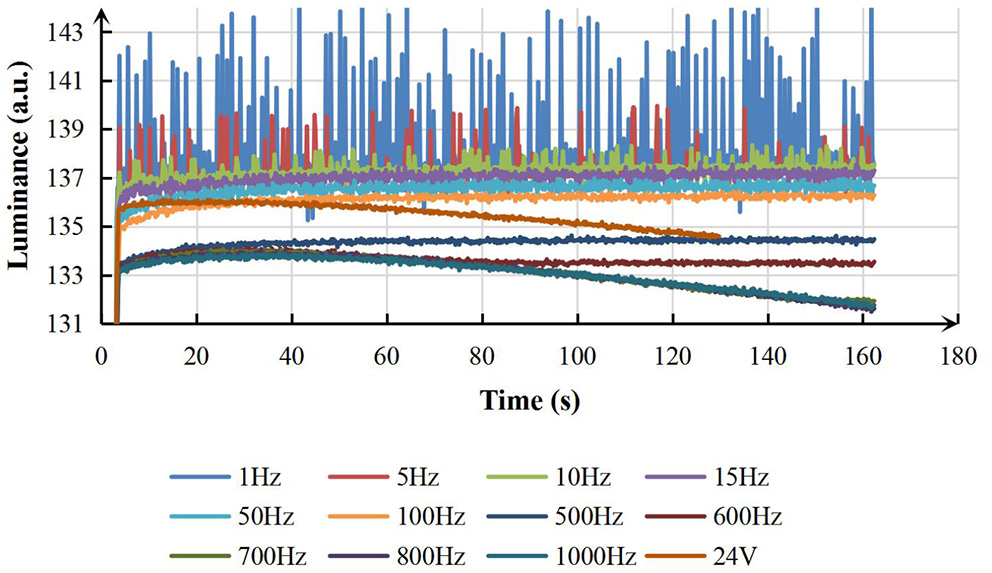
The brightness curve of an EWD driven by driving waveform at different frequencies (VRelease = −30 V, Vmax = 30 V, t1 = t2, Preset = 10%.).
With the same frequency of driving waveform, the proportion of the reset signal in a whole driving cycle also had an influence on the stability of grayscales. The definition of proportion Preset can be described as Preset = (t1+t2)/TReset. The brightness curve of an EWD at different Preset was shown as Figure 10.
Figure 10
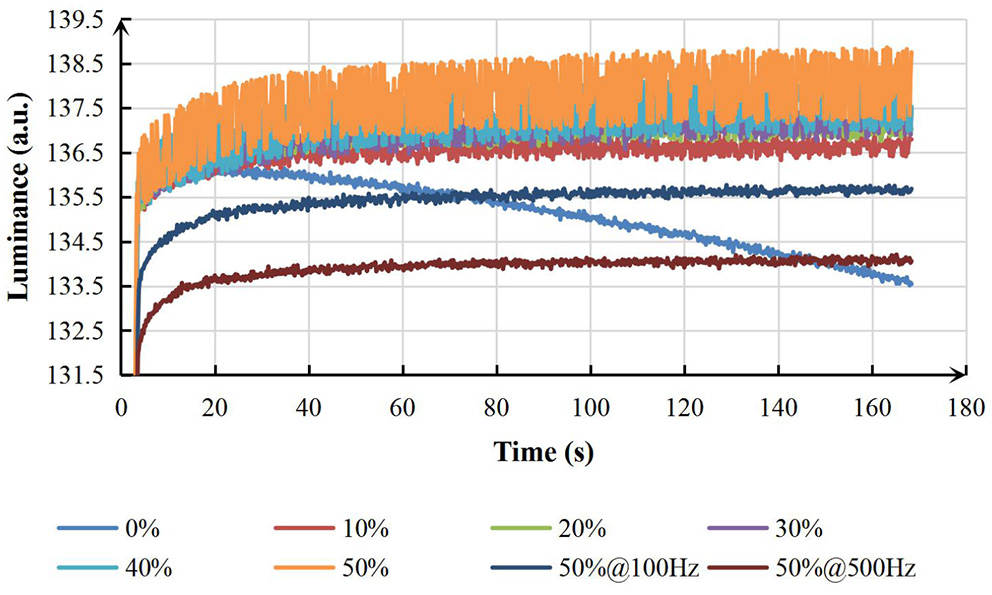
The brightness curve of an EWD driven by reset signals with different proportions Preset (F = 50 Hz, VRelease = −30 V, Vmax = 30 V, t1 = t2.).
When the driving frequency was set to 50 Hz, all driving waveforms except Preset = 0% (equivalent to DC driving waveform without a reset signal) can be used to keep the stability of brightness. With the increase of Preset in a whole driving cycle, the brightness value was increased. However, the fluctuation amplitude of brightness was significantly increased at the same time. To reduce the fluctuation of brightness, the frequency of driving waveform was increased to 100 and 500 Hz. It turned out that the maximum brightness value of EWDs was decreased. Experimental rsults show that EWDs could reach a higher brightness with the lower fluctuation when Preset was set to 10%. Therefore, the proportion Preset was set to 10% and the frequency was still set to 50 Hz.
The voltage applied in the release phase was also an important factor for the stability of EWDs. It can be seen from Figure 11 that the brightness and stability of the EWD were significantly improved with the increase of VRelease. That's because a larger reverse voltage was beneficial to the release of trapped charges. Therefore, the effective driving voltage between electrodes of a pixel can be stabilized. Once the effective voltage was stabilized, the brightness of EWDs could be maintained.
Figure 11
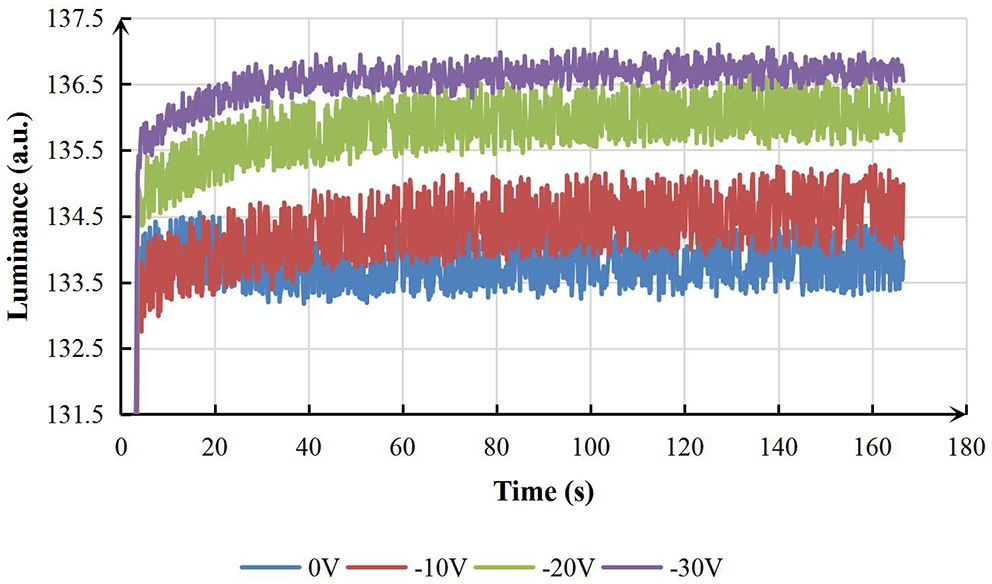
Luminance curves of an EWD driven by reset signals with different release voltages (F = 50 Hz, Vmax = 30 V, t1 = t2, Preset = 10%.).
In addition, the brightness stability of an EWD could be affected by the ratio of t1 to t2, which can be defined as . Curves of brightness-time with different Rreset was shown in Figure 12. Experimental results showed that the brightness was decreased and the fluctuation range of brightness was increased with the increase of Rreset. An obvious downward trend of the brightness curve was shown when the value of Rreset was set to 1/9 or 3/7. It was demonstrated that the charge trapping effect cannot be well-suppressed when the duration of the release phase was less than half of t1 + t2. So, the brightness of EWDs was decreased as the driving time increased. On the other hand, it was difficult for pixels to reach the maximum brightness when the duration of the release phase was more than half of t1 + t2. Therefore, the decrease and fluctuation of the brightness can be noticed on EWDs. The experimental results showed that the best inhibition effect on the charge trapping can be obtained when t1 was equal to t2.
Figure 12
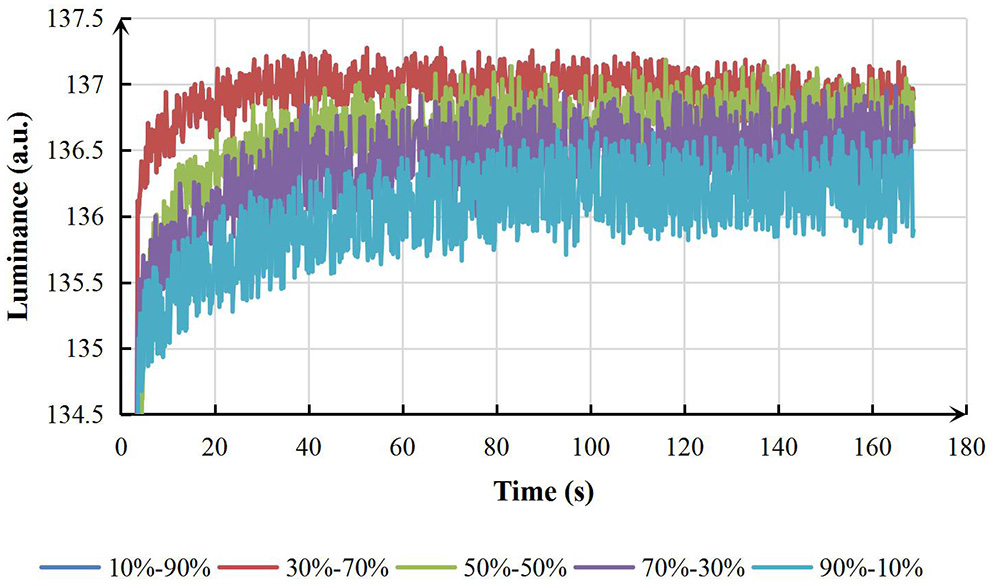
The curve of brightness-voltage of an EWD with the different ratio of t1/t2 (F = 50 Hz, Vmax = 30 V, VRelease = −30 V, Preset = 10%.).
With the DC voltage was applied, the brightness of EWDs was decreased by 3.280 a.u. in 145 s. However, the brightness only decreased by 0.315 a.u. in the same period by applying the proposed driving waveform. To quantitatively analyze the display performance of EWDs, the speed of oil backflow can be defined as the falling value of the brightness within unit time. It was demonstrated that the speed of oil backflow was reduced by 90.4% when the EWD was driven by the proposed driving waveform.
Conclusions
To suppress the influence of the charge trapping effect in EWDs, a driving waveform based on a reset signal was proposed. The reset signal was composed of a charge release phase and a driving recovery phase. The performance of driving waveform was evaluated by the brightness of EWDs. Experiments were conducted to investigate the influence of reset signal on the oil backflow. By applying the proposed driving waveform, the speed of oil backflow can be reduced by 90.4%, and the charge trapping effect can be suppressed by the periodic reset signal. Therefore, the proposed driving waveform could be applied for achieving stable grayscales.
Statements
Data availability statement
The original contributions presented in the study are included in the article/supplementary material, further inquiries can be directed to the corresponding author/s.
Author contributions
TZ and YD devised the project and experiments. TZ conceived the planned experiments and wrote the manuscript in consultation with YD. YD helped supervise the findings of this work. All authors discussed the results and contributed to the final version of the manuscript.
Funding
This research was funded by the National Key Research and Development Program of China (No. 2016YFB0401501), Science and Technology Program of Guangzhou (No. 2019050001), Program for Guangdong Innovative and Enterpreneurial Teams (No. 2019BT02C241), National Natural Science Foundation of China (No. 22008156), Guangdong Provincial Key Laboratory of Optical Information Materials and Technology (No. 2017B030301007), Guangzhou Key Laboratory of Electronic Paper Displays Materials and Devices (201705030007), MOE International Laboratory for Optical Information Technologies and the 111 Project.
Conflict of interest
The authors declare that the research was conducted in the absence of any commercial or financial relationships that could be construed as a potential conflict of interest.
References
1.
Bai P Hayes R Jin M Shui L Yi Z Wang L Zhang X G Zhou . Review of paper-like display technologies. Progr Electromagn Res. (2014) 147:95–116. 10.2528/PIER13120405
2.
Wang Z Liu Z . The key technology of ereader based on electrophoretic display. In: 2nd International Conference on Software Technology and Engineering, San Juan, PR (2010) pp. V1-333–V1-336. 10.1109/ICSTE.2010.5608873
3.
Zhang Y Zhen B Al-Shuja'a S Zhou G Li X Feng Y . Fast-response and monodisperse silica nanoparticles modified with ionic liquid towards electrophoretic displays. Dyes Pigments. (2018) 148:270–5. 10.1016/j.dyepig.2017.09.014
4.
Hiji N Yoshinori M Yasuo Y Yoshihide S Shigeaki O Tadanobu S et al . Novel color electrophoretic E-paper using independently movable colored particles. SID Symp Digest Tech Papers. (2012) 43:85–7. 10.1002/j.2168-0159.2012.tb05716.x
5.
Kao W Liu S Chang W . Signal processing for playing videos on electrophoretic displays. In: IEEE 55th International Midwest Symposium on Circuits and Systems (MWSCAS), Boise, ID (2012) pp. 872–5. 10.1109/MWSCAS.2012.6292159
6.
Hayes R Feenstra B . Video-speed electronic paper based on electrowetting. Nature. (2003) 425:383–5. 10.1038/nature01988
7.
Beni G Tenan M . Dynamics of electrowetting displays. J Appl Phys. (1981) 52:6011–5. 10.1063/1.329822
8.
Li W Wang L Zhang T Lai S Liu L He W et al . Driving waveform design with rising gradient and sawtooth wave of electrowetting displays for ultra-low power consumption. Micromachines. (2020) 11:145. 10.3390/mi11020145
9.
Yi Z Liu L Wang L Li W Shui L Zhou G . A driving system for fast and precise gray-scale response based on amplitude–frequency mixed modulation in TFT electrowetting displays. Micromachines. (2019) 10:732. 10.3390/mi10110732
10.
Yi Z Shui L Wang L Jin M Hayes R A Zhou G . A novel driver for active matrix electrowetting displays. Displays. (2015) 37:86–93. 10.1016/j.displa.2014.09.004
11.
Yi Z Feng W Wang L Liu L Zhou G . Aperture ratio improvement by optimizing the voltage slope and reverse pulse in the driving waveform for electrowetting displays. Micromachines. (2019) 10:862. 10.3390/mi10120862
12.
Chevalliot S Dhindsa M Kuiper S Heikenfeld J . Experimental validation of the invariance of electrowetting contact angle saturation. J Adhes Sci Technol. (2012) 26:1909–30. 10.1163/156856111X599580
13.
Dong B Tang B Groenewold J Li H Zhou R Henzen A et al . Failure modes analysis of electrofluidic display under thermal ageing. R Soc Open Sci. (2018) 5:181121. 10.1098/rsos.181121
14.
Raj B Dhindsa M Smith NR Laughlin R Heikenfeld J . Ion and liquid dependent dielectric failure in electrowetting systems. Langmuir. (2009) 25:12387–92. 10.1021/la9016933
15.
Verheijen H Prins M . Reversible electrowetting and trapping of charge: model and experiments. Langmuir. (1999) 15:6616–20. 10.1021/la990548n
16.
Li X Tian H Shao J Ding Y Chen X Wang L et al . Decreasing the saturated contact angle in electrowetting-on-dielectrics by controlling the charge trapping at liquid-solid interfaces. Adv Funct Mater. (2016) 26:2994–3002. 10.1002/adfm.201504705
17.
Yi Z Huang Z Lai S He W Wang L Chi F et al . Driving waveform design of electrowetting displays based on an exponential function for a stable grayscale and a short driving time. Micromachines. (2020) 11:313. 10.3390/mi11030313
18.
Chen Y C Chiu Y H Lee W Y Liang CC . A charge trapping suppression method for quick response electrowetting displays. SID Symp Digest Tech Papers. (2010) 41:842–5. 10.1889/1.3500607
19.
Yi Z Bai P Wang L Zhang X Zhou G . An electrophoretic display driving waveform based on improvement of activation pattern. J Central South Univ. (2014) 21:3133–7. 10.1007/s11771-014-2285-9
20.
Wang L Yi Z Jin M Shui L Zhou G . Improvement of video playback performance of electrophoretic displays by optimized waveforms with shortened refresh time. Displays. (2017) 49:95–100. 10.1016/j.displa.2017.07.007
21.
Beni G Hackwood S . Electro-wetting displays. Appl Phys Lett. (1981) 38:207–9. 10.1063/1.92322
22.
Xie N Zhang N Xu R . Effect of driving voltage polarity on dynamic response characteristics of electrowetting liquid lens. Jpn J Appl Phys. (2018) 57:052201. 10.7567/JJAP.57.052201
23.
Yi Z Feng H Zhou X Shui M . Design of an open electrowetting on dielectric device based on printed circuit board by using a parafilm. Front Phys. (2020) 8:193. 10.3389/fphy.2020.00193
24.
Gong J Kim C . All-electronic droplet generation on-chip with real-time feedback control for ewod digital microfluidics. Lab Chip. (2008) 8:898–906. 10.1039/b717417a
25.
Samiei E Tabrizian M Hoorfar M . A review of digital microfluidics as portable platforms for lab-on a-chip applications. Lab Chip. (2016) 16:2376. 10.1039/C6LC00387G
26.
Feng H Yi Z Yang R Qin X Shen S Zeng W et al . Designing splicing digital microfluidics chips based on polytetrafluoroethylene membrane. Micromachines. (2020) 11:1067. 10.3390/mi11121067
27.
Srinivasan V Pamula V Fair R . An integrated digital microfluidic lab-on-a-chip for clinical diagnostics on human physiological fluids. Lab Chip. (2004) 4, 310–5. 10.1039/b403341h
28.
Torabinia M Asgari P Dakarapu U Jeon J Moon H . On-chip organic synthesis enabled using an engine-and-cargo system in an electrowetting-on-dielectric digital microfluidic device. Lab Chip. (2019) 19:3054–3064. 10.1039/C9LC00428A
29.
Yang S Krupenkin T Mach P Chandross E . Tunable and latchable liquid microlens with photopolymerizable components. Adv Mater. (2003) 15:940–3. 10.1002/adma.200304745
30.
Berge B . Liquid lens technology: principle of electrowetting based lenses and applications to imaging. In: 18th IEEE International Conference on Micro Electro Mechanical Systems, 2005. MEMS 2005. Miami Beach, FL (2005). p. 227–230. 10.1109/MEMSYS.2005.1453908
31.
Hu X Zhang S Qu C Zhang Q Lu L Ma X et al . Ionic liquid based variable focus lenses. Soft Matter. (2011) 7:5941–3. 10.1039/c1sm05585b
32.
Wu H Dey R Siretanu I Ende D Shui L Zhou G et al . Electrically controlled localized charge trapping at amorphous fluoropolymer–electrolyte interfaces. Small. (2019) 16:1905726. 10.1002/smll.201905726
33.
Van Dijk R Feenstra BJ Hayes RA Camps IGJ Boom RGH Wagemans MMH et al . Gray scales for video applications on electrowetting displays. SID Symp Digest Tech Papers. (2006) 37:1926–9. 10.1889/1.2433427
Summary
Keywords
electrowetting display, oil backflow, grayscale, charge trapping, driving waveform
Citation
Zhang T and Deng Y (2021) Driving Waveform Design of Electrowetting Displays Based on a Reset Signal for Suppressing Charge Trapping Effect. Front. Phys. 9:672541. doi: 10.3389/fphy.2021.672541
Received
26 February 2021
Accepted
06 April 2021
Published
29 April 2021
Volume
9 - 2021
Edited by
Feng Chi, University of Electronic Science and Technology of China Zhongshan Institute, China
Reviewed by
Yulin Shi, Shihezi University, China; Jingjing Yang, Nanjing Xiaozhuang University, China
Updates
Copyright
© 2021 Zhang and Deng.
This is an open-access article distributed under the terms of the Creative Commons Attribution License (CC BY). The use, distribution or reproduction in other forums is permitted, provided the original author(s) and the copyright owner(s) are credited and that the original publication in this journal is cited, in accordance with accepted academic practice. No use, distribution or reproduction is permitted which does not comply with these terms.
*Correspondence: Yong Deng yong.deng@guohua-oet.com
This article was submitted to Optics and Photonics, a section of the journal Frontiers in Physics
Disclaimer
All claims expressed in this article are solely those of the authors and do not necessarily represent those of their affiliated organizations, or those of the publisher, the editors and the reviewers. Any product that may be evaluated in this article or claim that may be made by its manufacturer is not guaranteed or endorsed by the publisher.