 Keerthi Adusumilli1Bradford Brown2Joey Harrison3
 Matthew Koehler1*
 Jason Kutarnia4Shaun Michel1Max Olivier1Craig Pfeifer5
 Zoryanna Slater4William Thompson1Dianna Vetter6
 Renee Zacharowicz7
- 1Model-Based Analytics Departement, The MITRE Corporation, McLean, VA, United States
- 2Government Administration and Judiciary Division, The MITRE Corporation, McLean, VA, United States
- 3Simulation, Experimentation, and Gaming Department, The MITRE Corporation, McLean, VA, United States
- 4Data Science Department, The MITRE Corporation, McLean, VA, United States
- 5Human Language Technology Department, The MITRE Corporation, McLean, VA, United States
- 6IT and Architecture Engineering Department, The MITRE Corporation, McLean, VA, United States
- 7Open Health Services Department, The MITRE Corporation, McLean, VA, United States
The structure and dynamics of modern United States Federal Case Law are examined here. The analyses utilize large-scale network analysis tools, natural language processing techniques, and information theory to examine all the federal opinions in the Court Listener database, containing approximately 1.3 million judicial opinions and 11.4 million citations. The analyses are focused on modern United States Federal Case Law, as cases in the Court Listener database range from approximately 1926–2020 and include most Federal jurisdictions. We examine the data set from a structural perspective using the citation network, overall and by time and space (jurisdiction). In addition to citation structure, we examine the dataset from a topical and information theoretic perspective, again, overall and by time and space.
Introduction
This paper examines the structure and emergent dynamics of United States Federal Case Law over time and across jurisdictions. The motivation of this work is twofold. First, we wish to demonstrate analysis of the legal corpus at-scale: to the best of our knowledge this is the largest study by case count to date. Second, we wish to conduct a sociolegal meta-analysis to explain the legal corpus’ network properties and behavior as endemic to the legal system.
To justify the need for a big data approach to studying law, take, for example, the analysis of transcripts from the Old Bailey court of London showing an increasing intolerance of violence over time [1]. Unfortunately, like the corpus from the Old Bailey court, this corpus is far too large for any single individual or team to review and analyze. Therefore, we must develop automated, computational methods to explore and understand this set of artifacts from a society’s significant institutions. This way we may be able to quantitatively understand how the legal system functions, how it changes, and how it relates to the society within which it is embedded.
As information scientists first, we study the citation network using graphical analysis and information theory to investigate the novelty and attachment dynamics of incoming cases, exposing self-reinforcing citation hubs as well as sparsely-connected loci. In parallel, we categorize and interrogate corpus content using topic modeling and natural language processing techniques. We then overlay the topical space with the citation network using a DeepWalk Graphical Neural Network to demonstrate the correlation between citation and topical dimensions in navigating the legal corpus. Finally, we model law over time, assessing the developing importance of cases and how circuit cases scale with population growth to inform classification of the legal system as a social structure. With the requisite amount of storage and computing power at our disposal, we use this constellation of information theoretical perspectives to shed light on the contours of the legal landscape.
By no means is this composite picture a comprehensive study; this work’s intention is to quantify and qualify assumptions of a network generated not randomly but on principles of stare decisis and subject to precedential constraints of a hierarchical court structure. We hope these insights signal avenues for innovation in legal technologies and set the stage for broad-ranging data-driven sociolegal commentary as previous examinations of the records created by a nation’s judicial system have done.
Prior Work
A large and growing body of literature borrows from graph theory, information theory, and physics to systemically analyze the body of law. The edited volume Law as Data [2] represents a recent compilation of much of this work. The reader is referred to [3]; [4]; [5]; [6]; [7,8] for ground laying work here but specifically to Liebon et al. [9] whose work is closest to this paper in concept as well as Smith [10] and Coupette et al. [11] whose work is closest to this paper in scope. With the exception of Smith and Coupette et al., all aforementioned work hones in on subsets of the data analyzed in the ensuing paper. Smith and Coupette et al. respectively offer structural hypotheses and make inroads toward a generalized analytic framework. Finally, while not an application to publish opinions, Katz et al. [12] proved an example of the use of these techniques to help answer a specific research question: namely, what is driving the growth of the law and its complexity in the United States and Germany.
Dataset Scope and Handling
The data set used for this analysis was obtained from Court Listener (www.courtlistener.com) which supports a nearly complete set of federal cases from 1926 and onward and a virtually complete set of United States Supreme Court cases prior to 1926. We use the modifier “modern” for this work, given that the dataset is dense for all federal courts’ published opinions as of 1926 (see infra). We leveraged Court Listener’s bulk download option to obtain a data set of 1,317,233 federal judicial opinions spanning the Supreme Court, the Appellate Courts, District Courts, Bankruptcy Courts, and most courts of special jurisdiction. Citations to corpora not a part of the Court Listener database, for example state court opinions, statutes, regulations, law reviews, etc., were removed, leaving 11,451,351 citations from federal case to federal case for network construction.
The dataset was stored both in corpus form as well as a citation network representation with document identifiers. We supported a MongoDB database, optimized for storing documents, and a Neo4J database, optimized for storing graph networks. In-text citations define directed edges which form the citation graph network. Given the size of the network (Table 1), we utilized NetworKit [13], a python package which runs distributed across multiple central processing unit (CPU) cores for reasonably fast processing speeds in a high-performance computing (HPC) environment. NetworKit computed betweenness and centrality metrics for all nodes in parallel. These computations measured 164 days of core-wall time but just under 6 days in MITRE’s HPC environment.
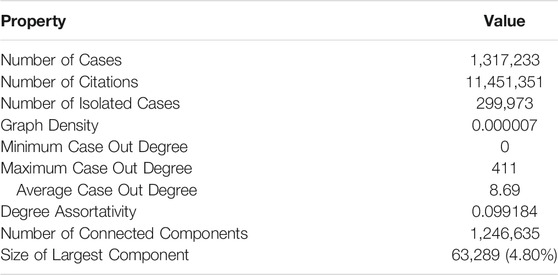
TABLE 1. Judicial opinion network properties.
Prior Assumptions and Preliminary Analysis
Given the hierarchical structure of the judicial system and the importance it places on the concepts of stare decisis and precedence, we hypothesize our analyses should show, inter alia:
• Sparsity, because some cases have more precedential importance than others; the more-important cases should be preferentially cited at the expense of less-precedentially-important cases.
• Highly skewed (possibly power-law distributed) degree centrality among cases; we expect a Proportional Attachment [14] dynamic is at play here (also known as a Preferential Attachment dynamic [15]). We expect this near-scale-free dynamic to anneal to a power-law distribution of node centrality as law settles over time, though it may truncate the extreme tail of a true power-law distribution.
• Cases from the Supreme Court should be most central, followed by appellate courts, then district courts. Generally, nodes’ degree centrality to be proportional to the hierarchy of courts represented.
• Given that cases express specific legal concepts that build upon each other, we should be able to use these concepts to trace the development of legal doctrine through time.
• There is an intuition that jurisdictions tend to specialize over time, if that is the case, then we should find consolidation in the topical distribution associated with a particular jurisdiction.
Finally, law is a product of social interaction (this is especially true in the United States where courts are constrained by the “cases and controversies” clause of the United States Constitution; this being the case, we should find legal productivity is correlated with social systems scaling dynamics.
These assumptions serve as the starting point of preliminary empirical analysis to expose network effects of hierarchy and precedence.
Throughout of the present examination, we use the term “Federal Case Law” to mean the ideas and statements contained within the published opinions of the Article III, United States Federal Courts. We make no assertion as to the force of law of federal opinions or whether they constitute a federal common law in the same way as state common law relates to state statutes, only that they are part of a judicial system and express the ideas of the courts across time and space while being subject to a hierarchical structure and the constraints of stare decisis and precedence.
In what follows we discuss our initial work analyzing this large corpus and highlight some of our significant findings. Some findings confirm our intuition about the judicial system, while others raise additional questions and point to what analyses should be performed next. First, we discuss the structural features of the citation graph defined among the court opinions. Next, we discuss the topical analyses of the corpus. Third, we explore the relationship between the citation network and the semantic information of topic fits by training a Graphical Neural Network to learn structural embeddings which predict topical embeddings. Fourth, we turn to into an information-theoretic deep dive of the corpus using our topical analyis. Finally, we conclude our analyses with a discussion of how the legal system fits into broader social dynamics.
Federal Judicial Opinions Citation Graph
To examine the structure of federal judicial opinions, we first treat the corpus as a citation network, in which in-text citations from opinion-to-opinion form directed links. The corpus analyzed contains 1,317,233 opinions and 11,451,351 citations between them. As discussed, supra, given the size of the graph, we utilized the python package NetworKit [16], which runs distributed across multiple central processing unit (CPU) cores, allowing us to perform the analyses of the structural properties of the Court Listener data set in a reasonable period of time. Basic network statistics are given in Table 1. Of note is the sparsity of the graph and that there are isolated cases and more than 1.2 million individual “islands” of interconnected cases. These features are consistent with the structure and function of the judicial system, namely, that only cases on point and with precedential value are cited by a given case. It is also interesting to note that there is not a citation path between all pairs of cases. This could be a feature of distinct legal concepts that are not dependent upon each other. This will be discussed further infra.
Next, we employed a high-performance computing (HPC) environment to compute centrality measures for each case in the network; the NetworKit python package supports parallel centrality measure calculations. Note that NetworKit has two algorithms that approximate the betweeness centrality of all nodes in a graph, as well as an algorithm that directly computes it. Using the HPC environment we were able to run the direct computation in just under 6 days (using nearly 164 days of core-wall time). The centrality distributions are shown in Figure 1.
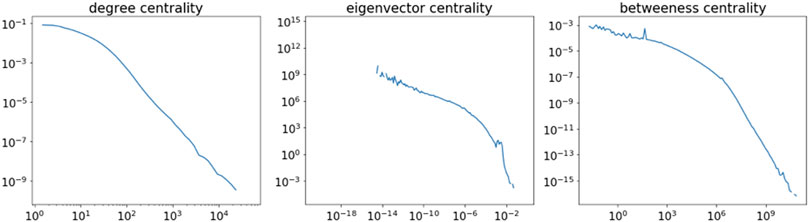
FIGURE 1. Centrality measures.
Node Centrality
In order to validate some of our primary assumptions, we computed Betweeness, Degree Centrality, and Eigenvector Centrality scores for each case-node. Each case received a ranked score between 0 and 1,317,233 for each metric and a composite rank score to measure its overall node centrality. The composite rank score was created by summing the three rankings together to create a single, ordinal scale ranking which, in essence, served as a convenient method to normalize the centrality metrics. As expected, the top central cases are Supreme Court opinions (Table 2) with the most highly-cited Supreme Court case, Anderson v. Liberty, exhibiting the highest score for each metric and composite centrality score.
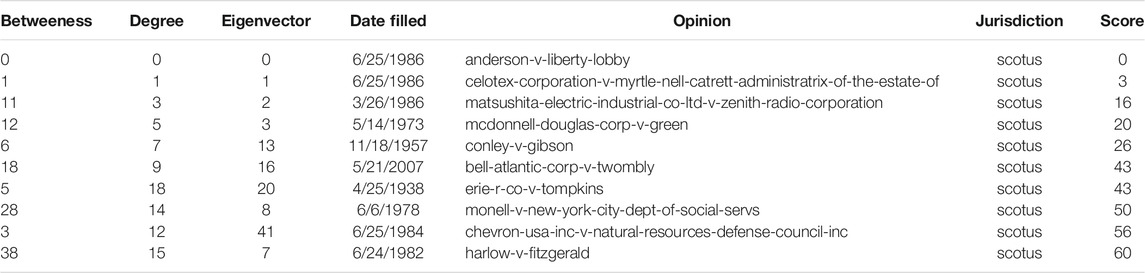
TABLE 2. Most central opinions.
In order to comprehensively assess the hierarchical influence on node centrality, we gathered the top 1,000 nodes and grouped them by jurisdiction. This data is shown in Figure 2.
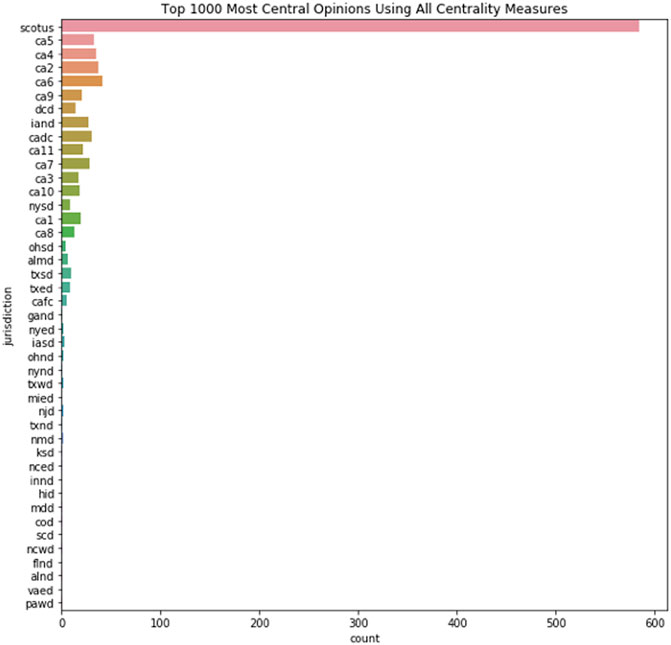
FIGURE 2. Jurisdiction of most central options.
Of note is the striking predominance of Supreme Court case decisions. These empirical data underscore the hierarchical structure of the legal system and the role of stare decisis and precedence. As a whole, this initial structural analysis of the citation network among judicial opinions largely conformed with our hypotheses: exhibiting sparsity, highly skewed degree centrality among cases, and centrality proportional to courts’ hierarchy. These points are consistent with the results of prior work and how the judicial system functions. In the next section we discuss our results of an analysis of the text of the opinions by creating a set of topic models of the judicial opinions.
Federal Opinion Topic Modeling
A topic model identifies groups of words that meaningfully co-occur to represent topics latent in a data set of documents. Topics are represented as probability distributions over the data set’s vocabulary, while a probability distribution over topics is learned for each document [see [16] for a conceptual introduction]. Topic models learn topics in an unsupervised manner, enabling both inferential analysis and improved utilization of the data set, without the cost and bias of human labeling. Thematic topics that emerge from a distribution over salient words can be explicitly labeled by post-hoc analysis or may persist as unidentified groupings of words for downstream tasks on the data set.
Various implementation approaches are taken to capture latent ideas in a data set’s bag-of-words (BoW) representation. Of note for its high popularity is Latent Dirichlet Allocation (LDA) [17], a probabilistic topic model that smooths its distributions by Dirichlet concentration parameters. As a generative model, LDA does not assign but draws topics and word-identities from probability distributions. With distributional sparsity, LDA encourages a constraint of perhaps more than one but not too many topics discussed in a document, and perhaps more than one but not too many uses for a given word.
LDA has been implemented in multiple ways: sampling, optimization, and trained models. Initial implementations used Gibbs sampling as implemented in MALLET [18]. Gibbs sampling is a Markov Chain Monte Carlo sampling technique that allows for sampling a distribution with a large number of variables. Instead of sampling from all variables at once, each variable is sampled in turn, conditioned on the samples of the preceding variables. Gibbs sampling is computationally expensive and non-deterministic; processing larger data sets requires approximation methods formed as an optimization problem.
Online variational Bayes [19] as implemented in sci-kit learn [20] converts the sampling problem into an optimization problem that can be solved via stochastic gradient descent. The algorithm alternates between subsampling the data and adjusting the hidden structure based on the subsample [21].
Here we utilize the Topic Modeling Neural Toolkit (TMNT) (https://tmnt.readthedocs.io/, paper forthcoming), an open-source topic modeling toolkit designed to compute topic models on large text collections using a neural network variational autoencoder (VAE) [22]; [23]. It is similar in approach to the Autoencoded Variational Inference for Topic Model (AVITM) as described in [24]. A neural network is trained as an inference network that maps a document directly to a distribution of topics. This is useful because it allows one to utilize a computer’s graphical processing unit (GPU) to perform many of the necessary calculations. Efficiency is important here as we need to build the topic model for all 1.3 million documents in our corpus, thus using all opinions and jurisdictions contained in the Court Listener database.
Topical Granularity
In order to stress-test the number of useful topics supported by the legal corpus, we trained models on the Court Listener data set constrained to three different counts of latent topics: 20, 40, 80. Upon evaluating the highest performers for each topic-count, we discovered that model variants constrained to a larger number of topics were splitting topics of lower-count models: increasing the number of latent topics did not simply encourage the model to find more distinct topics but encouraged the model to find increasingly granular subtopics. To demonstrate this, we will trace a single legal issue through the 20-, 40-, and 80-topics models to show how it trickles down into topics and subtopics as the number of topics increases. In the following example, we chose intellectual property topics as they seemed particularly clear, however similar dynamics were seen across the discovered topics.
In our 20-topics model, Topic 11 is focused broadly on intellectual property as can be seen from its salient terms which includes property-protection word-forms of “copyright,” “patent,” and “trademark,” while balancing economic legal issues of “infringement” and “monopoly” in the context of “trade” and “competition” (Figure 3). While the 20-topics model’s Topic 10 also contains salient terms “invention” and “patent” as relevant terms, it contains more terms dealing with environmental topics, specifically “nepa” (national environmental protection act), “eis” (environmental impact statement), “specification,” “environmental,” and “epa.” As such, it is not focused on intellectual property but on environmental policy and processes. Therefore, we comfortably assess one and only one of the model’s 20 topics to be dealing with intellectual property.
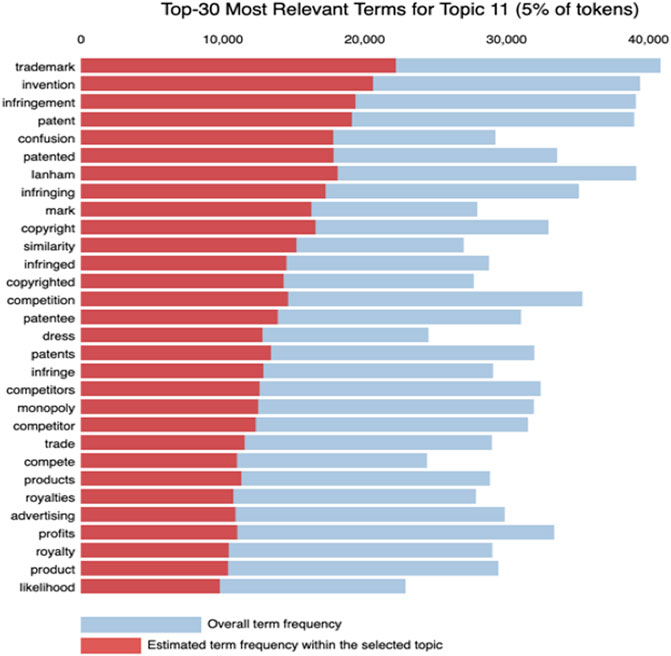
FIGURE 3. Most relevant terms for Topic 11 of 20-tpoic model.
In our 40-topics model we find two topics semantically-similar to the 20-topics’s model Topic 11: Topics 6 and 29 (Figure 4). These topics show the single intellectual property topic has been split into two topics, with each further specialization. Topic 6 is focused on trademark and copyright, as evidenced by the words “trademark,” “copyright,” and “mark,” while Topic 29 centers around patents as shown by the words “invention,” “patent,” and “patented.”
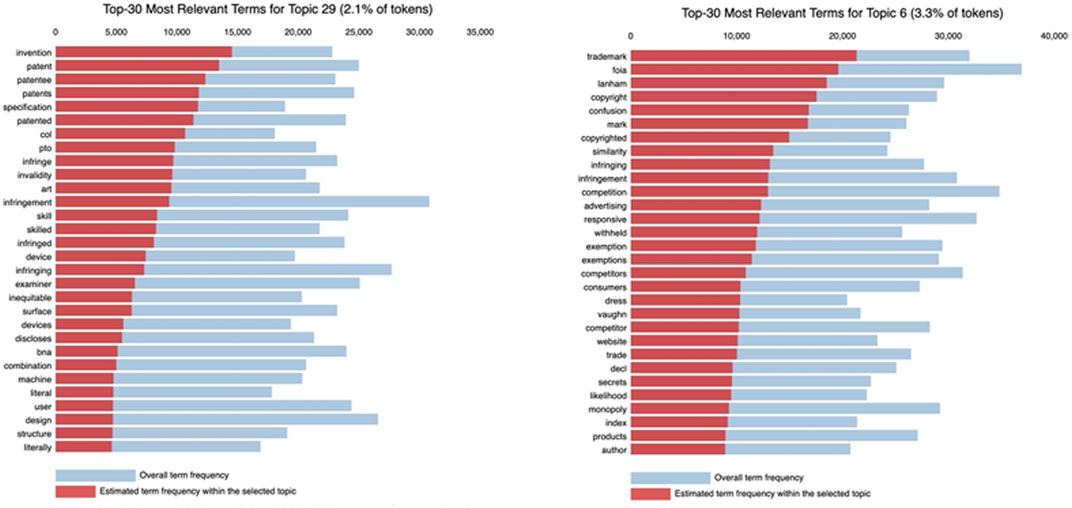
FIGURE 4. The most relevant terms from Topics 29 and six from the 40-topic model.
Moreover, increasing the number of topics increases the idea granularity. For instance, the 40-topics model becomes increasingly specific in its ideas: “foia” processes, “similarity” and “confusion” issues, and “advertising” and “website” context. In turn, the 80-topics model’s1 topics derivative of “intellectual property” includes for example a product-driven topic with salient terms “features,” “device,” and “design.” Thus, though we see an increase in diversity of concepts as the number of topics increase, these seem to emerge as finer points of their broader topic headers with fewer topics and coarser classification.
Extending the Topic Model to Include Structure
Card et al. [25] incorporate metadata into their VAE-TM implementation to guide an otherwise unsupervised clustering process [25]. The authors differentiate “labels” that were jointly generated with their document (in the generative story) from “covariate” priors that influence the topics latent in their ensuing document. With artful demonstration as to the value and effectiveness of tracing topics along a covariate structure or embedding topics together with their labels, Card et al. (2018, p. 2037–2038) motivate Structural Topic Modeling (STM) for the legal corpus with the expectation that metadata such as a case’s year or jurisdiction could influence or bring to focus a case’s latent topics.
Setup
Though standard vanilla LDA does not make use of priors, VAE’s latent representation medium lends itself to enmeshing metadata priors together with the document’s BoW. VAE-based TMNT is built on top of popular machine learning libraries such as AutoGluon [26] for plug-and-play usability as well as parameter grid-search and pyLDAvis [27] for topic model visualization and qualitative analysis (Figures 3, 4, 7, 8). TMNT also supports covariance incorporation and is, therefore, a tool of choice for STM efforts.
We start with a subnet of the connected citation hub between Plessy v. Ferguson, 163 United States 537 (1896) and the case that began to chip away at its decision: Brown v. Board of Education, 347 United States 483 (1954). This 1,808 document-sized component incorporates each central node’s first-edge citation neighborhood. Considering Brown v. Board of education cites Plessy v. Ferguson directly, each belongs to the other’s first-edge citation network, resulting in a tightly connected component with a maximum distance of three citation-edges between any two nodes. Given the historically-progressive nature of this component then, we might expect themes to emerge when conditioned on year, with perhaps further complexities presenting when year interacts with another covariate, jurisdiction, and topics are conditioned on the compounded covariate.
Potential Drawbacks
Though the topically-connected nature of the Plessy-Brown component enables local testing with tight experimental control, such a training set could carry significant extrapolative limitations. Foremost, we might expect loss in topic coherence and perplexity if the fully-connected citation component is separated into more topics than it can support. Furthermore, the training set (1,265 documents with a 70 percent -15 percent—15 percent train-validation-test split) may be too small to meaningfully represent tokens with vectors instantiated by random assignment. Card et al. (2018, p.2037) suggests training using pretrained word embeddings to represent tokens. TMNT supports pretrained word embeddings including word2vec [28], GloVe [29], and fasttext [30] and will be used in future work.
Incorporating Covariate Priors
To mirror aforementioned work on topical granularity, we ran TMNT on a range of topics, with 20 topics as its lower search bound and 80 topics as its upper bound. The vanilla run converged on 22 topics with topics lying along an interaction line between its two principal components. Salient topic terms include ideas of education and (de)segregation as expected from an unsupervised modeling of a Plessy-Brown (BoW) subnet.
With compelling need to pull apart the topics, we conditioned the Plessy-Brown training set on the compound covariate of case jurisdiction and year (decade). With 400 compound covariate options, the network forcefully separated its topics but converged on 50 topics, far too many latent topics than could be supported by our small connected data set. “Too many” was assessed by a dramatic drop in Normalized Pointwise Mutual Information score between training and testing, implying an overfit to statistical artifacts.
With a closer look at the principal components within Plessy-Brown’s Topics’ distribution, some linear progression from tolerance to criminalization becomes apparent: topics in the second quadrant (Figure 5) dispassionately relate to “elementary,” “attendance,” “zones,” “neighborhood,” and “desegregation” while a progression along the identity line reaches topics of “criminality” and “prosecution.” With a second attempt at structural topic modeling but this time conditioned just on its decade (14 decades in total), the topic model incorporating a “decade” covariate only ever so slightly pulls apart the topics but converges back to 22 topics, mitigating concern of over-imposed conditionality. Noticeably, the Decade variant seems to project the Vanilla model’s topics’ distribution onto a lower-dimensional space. While there is a retention of progression from unobjected acceptance to prosecutorial offense, from this projection there seem to emerge broader ideas of rights and liberty, including women’s (reproductive) rights (Figure 6), which historically emerged alongside the civil rights movement2. Thorough investigation and analysis are required to meaningfully pull apart the legal corpus while maintaining the integrity of its underlying statistics. As our work advances, we will slowly move outward from focusing on a singular connected component toward topic modeling the full legal corpus for improved structural network analysis and utilization. However, these initial analyses demonstrate the ability to find social change and legal doctrine development within a corpus utilizing NLP and statistical methods.
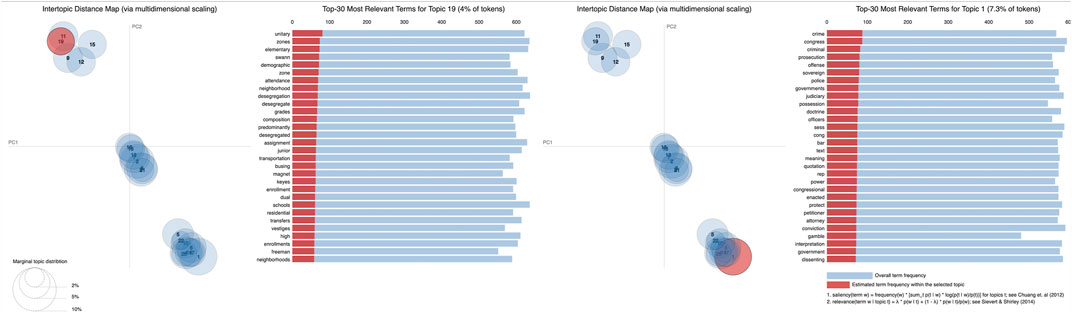
FIGURE 5. Sentimental progression in topic space of the Plessy-Brown subnet, vanilla topic model.
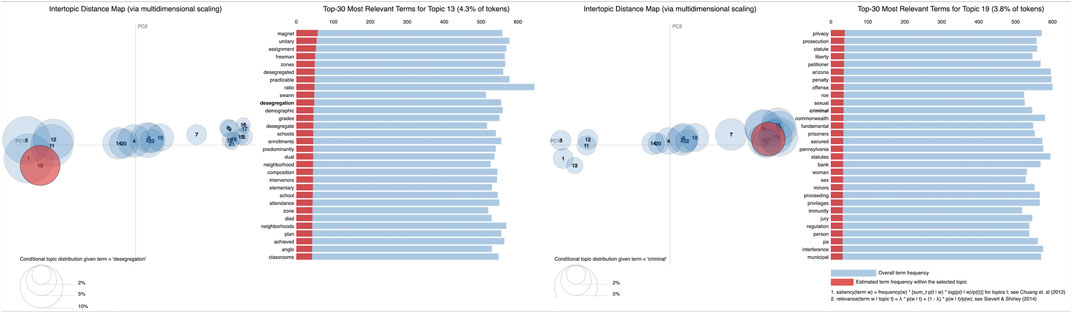
FIGURE 6. Sentimental progression in topic space of the Plessy-Brown topic model conditioned on case decade.
The topic model, while insightful by itself, also provides us with additional data we can then assign to each opinion in the corpus and make use of in conjunction with the citation network. Similar to Leibon, et al. (2018), we can now analyze the relationship between network structure and the topics contained within each opinion. We first turn to these results and follow that analysis with an information theoretic analysis of the Federal Case law across time and space (jurisdiction).
Linking the Citation Network and Topic Model
Another way to investigate the link between citation network and topic space is to employ graph-based machine learning techniques where the goal is to learn a structural node embedding. This embedding, also known as a feature vector, is then used as input into a statistical model trained to infer topic from embedding. While the 20-topics model identifies major legal areas in the Court Listener dataset useful for broad classification, the 40 and 80 topics models are able to elicit more fine-grained issues. As such, document-vectors produced from the 20-topics model were used downstream as graph neural network embeddings which provide a structural overview of the corpus. The accuracy of this model is proportional to the strength of the link between the citation space and the topic space. It answers the question of whether it is possible to use an opinion’s location in the citation network to accurately infer its topic.
In our experiments we choose the DeepWalk algorithm [31] to learn the structural embedding of the federal opinion citation network, due to its impressive performance with some benchmark multi-label classification problems performed on a graph. The algorithm is also highly scalable, which makes it ideal for a network of this size. DeepWalk is an unsupervised feature learning technique that generalizes proven research on word embeddings originating from the natural language processing (NLP) community. The intuition being that random walks on a graph are analogous to the sentences that feed the NLP methods—we transition from sequences of words to considering short random walks along the graph. This approach enables the features learned by DeepWalk to encode community structure and neighborhood similarity. The node degree distribution of many social networks follows a power law; consequently, the appearance of vertices in a short random walk will also follow a power law. The original paper points out that word frequency in natural language follows a power law as well, and because the techniques from NLP account for this fact, it is intuitive that approaches based on NLP methods would also achieve impressive performance here. The DeepWalk algorithm is based around the following optimization problem:
Where
Figure 7A demonstrates DeepWalk’s ability to distinguish between the neighborhoods of 10 landmark Supreme Court cases using only two of its 128 dimensions. Each dot in the figure represents an opinion, and the landmark case cited is identified by the dot’s color. Separation is already apparent using just two dimensions, and the full embedding encodes much more-nuanced structural information that was fully leveraged in the machine learning models discussed supra.
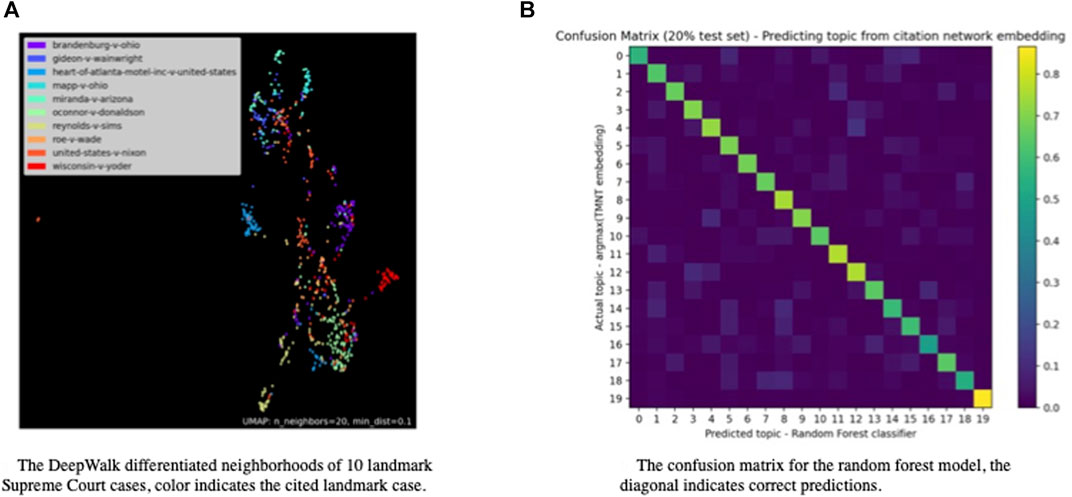
FIGURE 7. DeepWalk prediction results for 10 Landmark Supreme Court cases: (A) A reduced dimensional scatter plot of cases showing relative neighborhood (spatial location), and case relationship via color; (B) the confusion matrix for the random forest model, correct prediction is shown as the lighter color diagonal.
It turns out it is possible to infer the topic of an opinion (argmax of the TMNT embedding) accurately using just the citation network embedding (output from DeepWalk). It’s not unexpected that the link between the structural embedding and the textual embedding would be strong. The classification target for each opinion was the largest contributing topic from the 20-topics model, and the input features were the 128 values from the structural embedding produced using DeepWalk. We trained a multinomial logistic classifier and a random forest, with the random forest doing approximately two percent better on the 20 percent hold-out set. Figure 7B shows the confusion matrix from the random-forest model. The diagonal indicates correct predictions, and we see that the link between DeepWalk’s structural embedding and TMNT’s topical embedding is very strong.
Information Theory Methods
Upon completion of the topic modeling (discussed supra), we had additional information about each opinion (node) in the citation graph in the form of a vector of numbers representing how likely each discovered topic was present in the opinion. This, in addition to information about the opinion, such as date published and jurisdiction, provided additional ways to explore the dynamics of the United States federal courts. In this analysis we leveraged techniques from Information Theory to quantify changes among the opinions in time and space. First, we will discuss the methods and then move to results. As discussed infra, some discovered dynamics have plausible explanations, while others will require additional, follow-on analyses to adequately understand.
Novelty, Transience, and Resonance
The number of citations and other centrality measures are commonly used to quantify the importance and influence in citation networks. These measures rely on the presence of a citation network, however. We attempt to quantify the influence of an opinion purely semantically, without reference to the citation network.
The structure of the United States courts makes United States Federal Case Law a uniquely interesting corpus in which to study semantic influence. The precedential doctrine of stare decisis, along with the hierarchical structure of the court system, imply that a single opinion from a high court can profoundly affect the future opinions of lower courts. Moreover, the influence is asymmetric; a single decision in a lower court is not likely to exert the same influence on higher courts or even courts in other districts. Here an exogenous structure specifies the manner and flow of influence, unlike a corpus on academic papers that have, in theory, a weaker exogenous structure.
To quantify semantic influence, we begin with the information theoretic quantity of Kullback-Leibler divergence (KLD). Broadly speaking, KLD measures the difference between two probability distributions. Results in cognitive science support the interpretation of KLD as a measure of surprise [32]. Others have previously employed KLD, in combination with topic modeling, as a measure of surprise in the context of natural language [33,34]. Here, we use an 80-topic model trained on the entire corpus to infer a topic probability distribution for each document. We perform all subsequent analysis on these document vectors.
To further quantify semantic influence, we employ three measures defined by Barron et al.: novelty, transience, and resonance [35]. These measures rely on the per-document topic probability distributions produced by the aforementioned topic model. Novelty measures how surprising a document is, given the topic distributions of the preceding documents. High-novelty documents introduce new topics or combinations of topics into the corpus. Likewise, transience measures the surprise of a document, given the subsequent documents. High-transience documents contain topics or combinations of topics that do not persist within the corpus. Finally, resonance is the difference between the novelty and the transience. A document with high resonance introduces new topics that persist, while low resonance is indicative of documents that introduce new topics that do not persist.
The formal mathematical specification of our measures follows:
We use a topic model to generate a topic probability distribution for each document in the corpus. This distribution can be thought of as an N-dimensional vector
The KLD between two document vectors is defined as follows:
For two opinions i and j, the KLD between their corresponding document vectors
Note that KL divergence is asymmetric. This implies that:
Then we define the set of all cases in the same circuit published within the previous and subsequent w years as
We then compute the centroid vector by computing the mean of all the vectors within the set.
The centroid vector represents a typical opinion in each circuit in each window of time. We define the novelty as:
And transience as:
Finally, resonance is simply the difference between the novelty and the transience:
Given the structure of the United States judiciary, and that courts are most influenced by cases within their jurisdiction, we calculate the novelty and transience of each opinion with a window of 10 years and compare opinions to opinions within the same circuit.
Information Theoretic Results
Transience Versus Novelty
We begin by examining the relationship between novelty and transience. One would expect to find a strong correlation between novelty and transience; opinions with a high novelty tend to have a correspondingly high transience. What is new is often forgotten. For the most part, the opinions in the corpus follow this trend very closely. Figure 8 plots the relationship between novelty and transience. We see highly novel opinions do not tend to leave a lasting impact on the jurisprudential landscape. The slope of a linear regression indicates the bias toward novelty or transience. A fit with a slope <1 indicates a novelty bias, whereas a fit with a slope >1 indicates a transience bias. A linear regression preformed on the corpus yields a slope of 0.97, close to 1. Figure 8 also plots the slope of the regression line for each circuit as well as the Supreme Court. All circuits have a slope of slightly less than 1. This indicates a slight bias toward novelty. The Supreme Court is the closest to 1, with a slope of 0.97. The 10th Circuit has the largest novelty bias, with a slope of 0.87. Overall, the United States court system lacks a strong novelty or transience bias. This strongly implies that change moves slowly within the court system, as implied by stare decisis. Furthermore, the novelty bias is consistent with the notion that law becomes settled over time and individuals tend to bring new cases and controversies to a court.
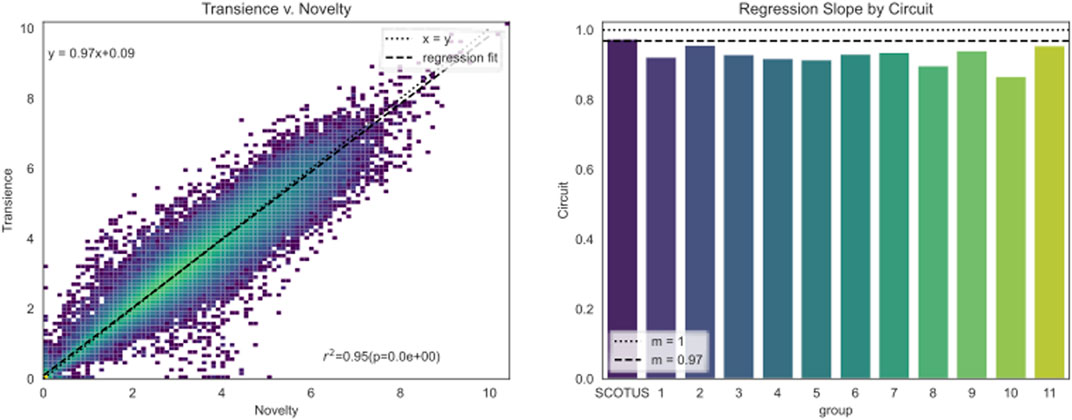
FIGURE 8. The relationship between transience and novelty.
Novelty Over Time
Looking at novelty over time, we see two effects: the mean novelty increases over time, and the 95-percent bootstrapped confidence interval shrinks over time. Figure 9 plots the mean novelty for all cases over time. Each circuit follows a similar pattern. From 1920 to 1970 the mean novelty increases over time and has a large confidence interval, meaning the data is scattered. After 1970 the mean novelty has a much lower confidence interval and stops increasing. The significance of these trends were tested using the standard Mann-Kendall test with level set to 0.05 and were found to be significant, matching our assumptions from examining the graph. The presence of a statistically meaningful trend suggests that the decreasing confidence interval results from a larger number of opinions per year, not from a true variance in the mean novelty.

FIGURE 9. Mean case novelty by year.
This finding that novelty increases over time perhaps suggests an acceleration in the pace of law. The low-mean novelty in the early 20th century suggests that the pace of law was comparatively slow; new opinions did not stray from what came before. Does this suggest the pace of law is increasing? Why would this be? Perhaps law scales with population, the pace of life increases with the size of a city. This is explored in more detail, infra.
ArticleRank and Resonance
Another way to quantify the influence of an opinion is to use ArticleRank. ArticleRank is a centrality measure closely related to Google’s PageRank algorithm. The ArticleRank algorithm has proven useful in the analysis of citation measures. Unlike the traditionally used measure of times cited, ArticleRank does not weight all citations equally. Citations from other influential opinions are weighted more heavily [36].
Do our purely semantic influence measures correlate with the ArticleRank?
We find that the ArticleRank and resonance are largely orthogonal measures. Table 3 shows the Pearson correlation between ArticleRank and Novelty, Transience, and Resonance. There appears to be no meaningful correlation between citation-based measures of influence and semantic measures of influence within our corpus. A high ArticleRank does not imply an opinion will have a high or low resonance.
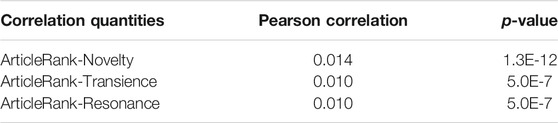
TABLE 3. Correlation between ArticleRank and semantic measures.
Jensen Shannon Distance
In the analyses above, we compared trends within circuits. In the subsequent sections we want to examine trends between circuits. To quantify the distance between circuits, we compute the Jensen-Shannon distance (JSD) between pairs of circuits. Unlike KLD, which is a type of f-divergence, JSD distance is true distance metric and is therefore symmetric. The JSD between two vectors p and q is defined as the square root of the mean of the KLD between each vector and their mean vector. We use JSD here rather than KLD because there is less of a sense of “direction” between circuits. With, for example, novelty, there is a directionality to the question, so there is a specific way to apply KLD. However, when comparing the 6th Circuit to the 7th Circuit, there is no specific directionality to the analysis, thus the need to use JSD rather than KLD. The specific JSD calculation is:
Distance Between Circuits
To examine how the circuits change over time we compute the mean JSD between each pair of circuits for each year. This data is displayed in Figure 10A. Once again, the trend is checked using the Mann-Kendall test and found to be significant to a level of 0.05. The results indicate a significant increase in the distance between courts over time. The distance begins to increase more slowly in the 1970s.
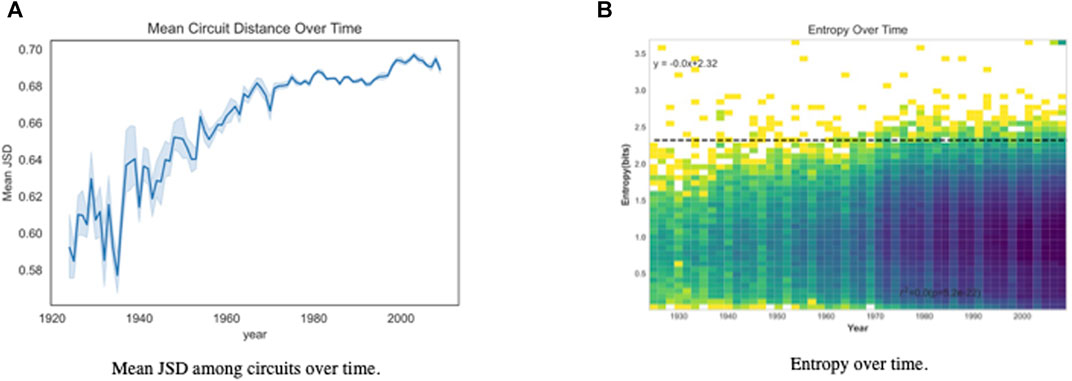
FIGURE 10. Mean JSD among circuits over time and associated entropy: (A) Shows increasing mean JSD and decreasing variance over time among circuits; (B) Show relatively little change in entropy over time among circuits.
The most obvious cause of an increase in semantic distance would be specialization. Many have noted specialization occurs among judges, even those on courts without special jurisdiction, see generally Baum [37,38] and Wasserman and Slack [39]. This hypothesis seems reasonable since circuits loosely correspond to geographic location and as societies specialize in activities geospatially (for example, banking and equity trading in New York City), the courts will disproportionately hear cases associated with these social activities. Given this dynamic among individual judges and the role of precedence and stare decisis, one might expect this to cause a more generalized specialization over time within a jurisdiction. If this were the case, one would also expect the mean opinion entropy to drop over time. However, Figure 10B shows the entropy over time remains, essentially, constant. The Pearson correlation between the year and the entropy is −0.022 with a p-value of 5.2E-22. No correlation exists between the entropy and time, and therefore no evidence exists of any increasing specialization.
We can also see this lack of specialization for circuits over time by looking at the frequency of the most common topics within circuits. In the context of the topic model, a court specializing in a particular type of case should appear as a specific topic having a high value in the document probability vectors for a progressively larger proportion of cases over time. To investigate this possibility, for each case in a circuit we identified the topic that had maximum probability in the topic probability vector and then plotted the distributions of most likely topics over the period between 1950 and 2010. Figure 11 shows these distributions for the 9th circuit. The distributions are grouped by decade and displayed for each of the 20-, 40-, and 80-topic models. From the graphs it is apparent that no single topic is ever the most likely for more than 25% of cases in that decade, and for the 40- and 80-topic models it was extremely rare for a single topic to be most likely in more than 10% of cases in that decade. Graphs of the other 10 circuits demonstrate broadly similar behavior to the to Figure 11.
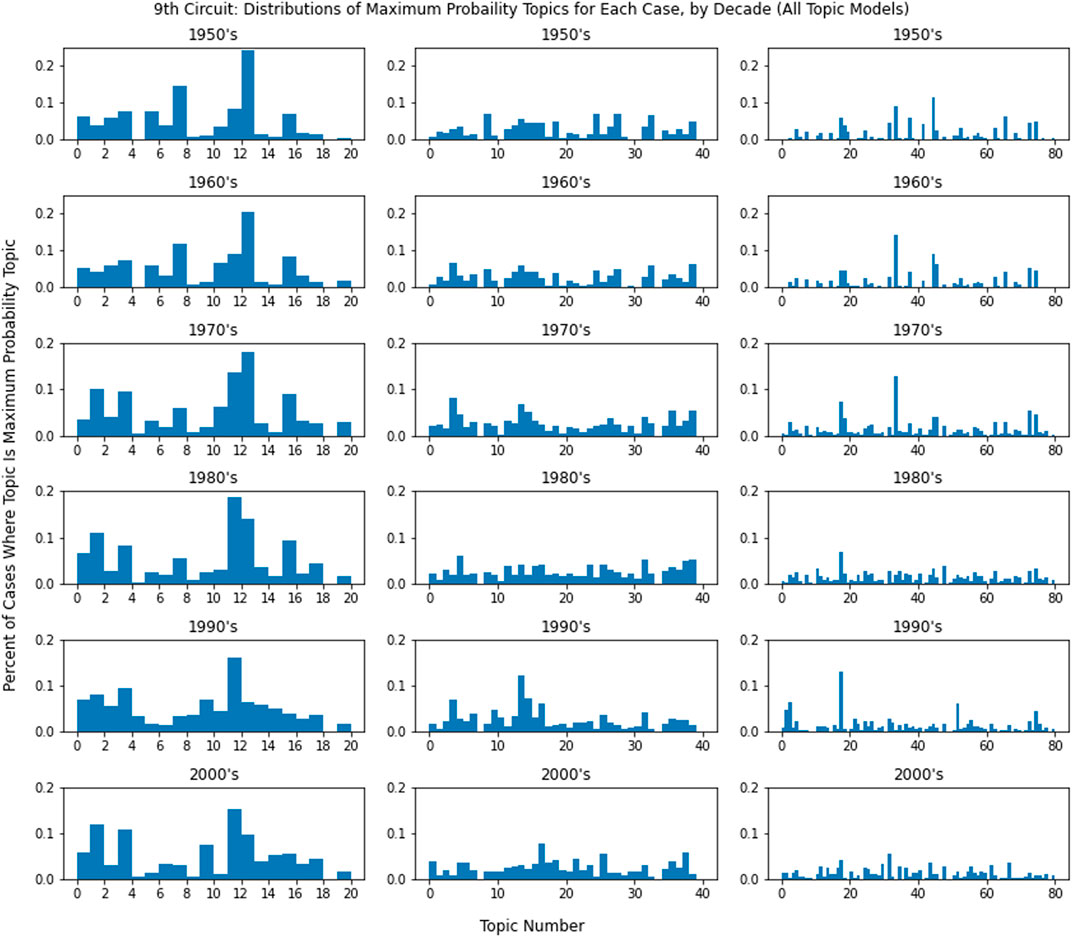
FIGURE 11. Distributions of max probability topics by decade for each topic model.
The lack of consolidation within the topical distributions of jurisdictions demonstrates a lack of specialization over time, but that still leaves the question of what is causing the increasing distance between circuits. One possibility is that the increasing circuit distance is a result of what Smith labels “legal clustering.” The cause for clustering in the citation network is evident. He writes: “A court is likely to cite what is jurisdictionally relevant. The judge will prefer to cite a case from his own court or from a higher court in its jurisdiction than from some remote jurisdiction” [10]. High correlation exists between distance in the citation network and semantic distance. It is not unreasonable to conclude that judges also tend to use jurisdictionally relevant language and concepts. The increasing semantic distance between circuits could be explained by an increase in the amount of clustering within the network. This hypothesis could be tested in several ways. The correlation between the inter-circuit semantic distance and the clustering within the citation network could be measured. Additionally, if semantic clustering is the cause of the increasing semantic distance, one would expect the semantic distance between lower courts and higher courts in the same jurisdiction to be consistently lower than the semantic distance between lower courts in different jurisdictions. These are analyses queued up for our next study.
Investigating Scaling and the Pace of Law
Many complex systems have been shown to exhibit power-law scaling relationships. These relationships have been found in biological systems, like the scaling of metabolic rate with weight [40]. Importantly, the scaling relationships within biological systems are sublinear, larger organisms metabolize more efficiently. We find scaling laws in social systems like cities, as well. Some aspects of cities related to infrastructure scale sub-linearly [41]. Larger cities exploit efficiencies and require less infrastructure per resident than smaller cities. Unlike biological systems, social and economic aspects of cities scale super linearly. Research by Bettencourt, West, and others indicates that these super-linear scaling relationships result from the properties of cities’ social networks and the increased interaction among the residents.
Next, we investigate the scaling properties of the United States legal system. On the one hand the United States legal system acts like infrastructure, a publicly funded institution intended to provide justice for its citizens. From this perspective one might imagine the legal system scales sub-linearly like other pieces of infrastructure. On the other hand, the law is a deeply social activity, and the cases it sees arise from the social interactions between individuals. In this case we would expect the law to scale super-linearly. It should also be noted that we limited the dataset used for this analysis to the United States Supreme Court (as the most influential) and Circuits 1–11 (as having some geospatial connection via jurisdictional boundaries). Jurisdictions based upon subject were removed as they have very little geospatial connection to a particular region.
We use two different metrics to quantify the scaling of the legal system. The first is the total number of opinions filed per year. This simply measures the productivity of a circuit. We also consider the ArticleRank, which quantifies the amount of influence a given jurisdiction has over the legal system. We begin by examining the dynamics of the case count by year and the population separately. For population data we used United States Census Annual Estimates for the United States population by state.3 Not surprisingly, the state population grows quite differently than the opinions of the surrounding judicial jurisdiction.
Scaling–Linear Regressions
We use linear regressions to quantify these scaling properties. We plot the number of cases published in each state district court versus the population of the state, both on linear axes as well as on a log-log scale. If the linear regression explains the data well on the log-log plot, with a > 1, this will lend credence to the idea that the number of cases scales exponentially with the state population. If the data is better explained by a regression on the data with linear axes, or if neither regression explain the data well, one may conclude the data does not follow a power-law like scaling relationship. Figure 12 plots an example of the caseload versus population data on a log-log plot; the regression is displayed as the blue line. The regression suggests the scaling relationship is almost linear, with a slope of 0.97, which indicates that law scales somewhere between social infrastructure and social interaction.
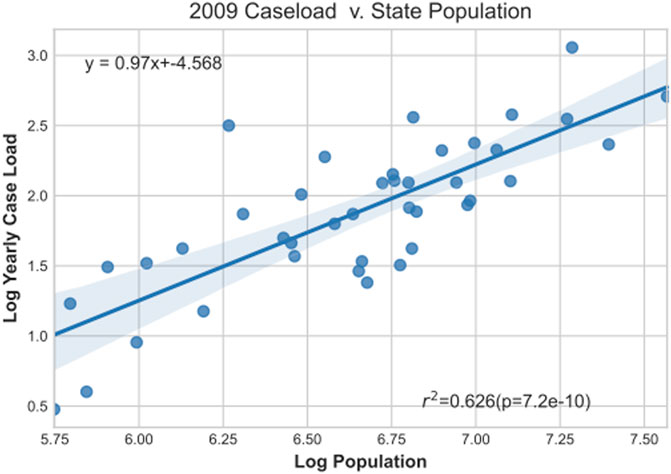
FIGURE 12. Example case load versus population plot for 2009.
We perform this same analysis of the data for every year in the data set, from 1926 to 2020, on both linear as well as log-log axes. The linear regressions on linear axes result in slopes that increase significantly over time from near 0 to over 1.7. The log-log axes linear regression slopes suggest a relationship between population and caseload that changes over time from highly sublinear, with slopes near 0.4, to close to linear. The r-squared values of the linear axes regressions begin to decrease in the 1970s while the r-squared values of the log-log regressions begin to steadily increase at the same rate. These results, taken together, suggest the linear scaling properties of the United States Federal Case Law only begin to emerge in the 1970s. The near-linear scaling suggests that the law as whole does not benefit from efficiencies as would infrastructure that scales sub-linearly. Neither does the law benefit from the snowballing effect of social interaction. Furthermore, one might expect the largest jurisdictions to produce a disproportionate number of opinions. Instead, the number of opinions appears to be directly proportional to the population of the state. Again, this suggests law is a “hybrid.” Meaning, it is both an outgrowth of social interaction, as well as infrastructure supporting the general functioning of society.
Temporal Scaling by Circuit
Previously we examined the scaling relationship between a state’s population and the number of opinions authored. These scaling relationships are static, examining the relationship between states at a single moment in time. Next, we examine the scaling of each circuit over time. We group the states by circuit and sum the population of each state within a circuit to find the total historical population of each circuit. Figure 13 plots the results and shows the statistics for each fit. We find that the scaling of each circuit is super-linear. The minimum and maximum slopes of the linear regression are 1.9 and 7.3, with a mean of 3.96. The r-squared values range from 0.52 to 0.94, with a mean of 0.8. The only true outlier is Circuit 10. The distribution for circuit 10 visually does not fit the regression line, and an r-squared value of 0.52 lends further support. What is different about circuit 10? Circuit 10 contains much of the American west and southwest and has a small population relative to its size. Perhaps this lower population density causes fewer sociolegal collisions and interactions, thereby making this circuit an outlier.
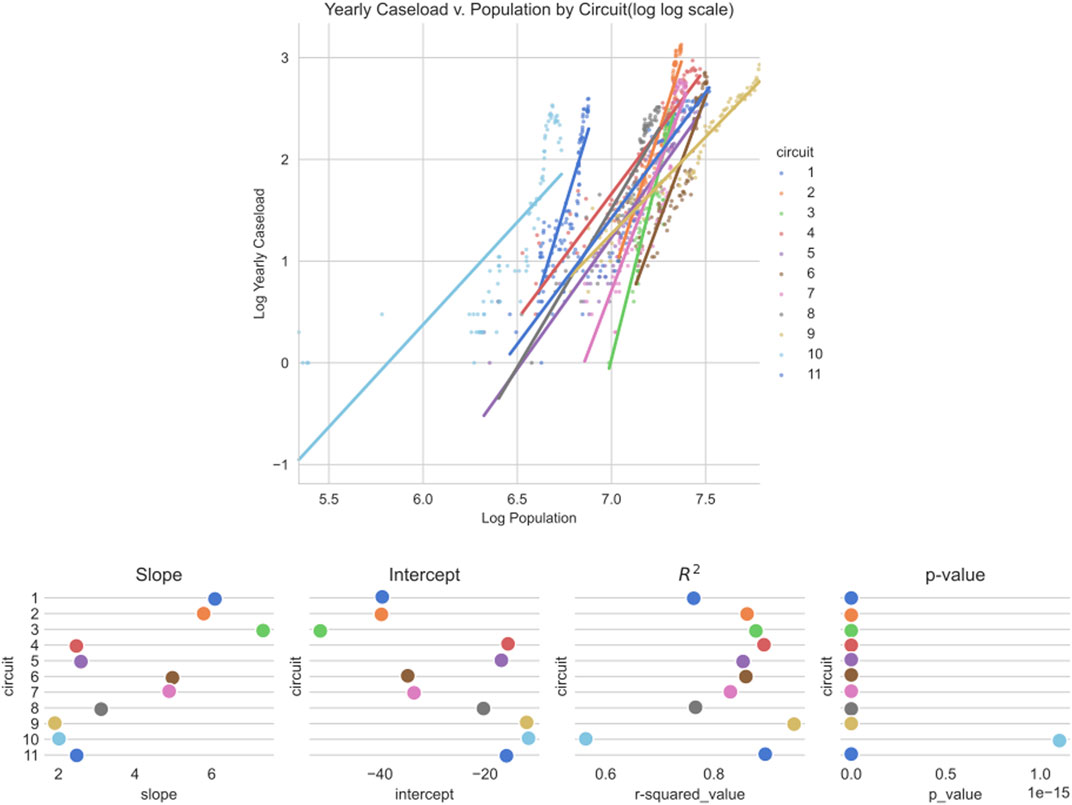
FIGURE 13. Graph of yearly caseload versus population by circuit and statistics for linear regression fits of yearly caseload versus population by circuit.
Interestingly, when examined as a whole, i.e., aggregating across all circuits, one finds sublinear scaling. These results, when coupled with the previous results, paint a strange picture. The scaling relationship across states at a given moment in time is sub-linear. The scaling relationship within the same circuit over time is super-linear. The same super-linear relationships that exist withing circuits over time exist within individual states over time as well. This is likely a function of the level of aggregation used within the analysis, an example of the Simpson’s Paradox. Comporting with the “cases and controversies” clause, one would expect court productivity to be closely related to social activities contained within its jurisdiction and, thus, scale super-linearly. In addition to meeting this prior expectation, intra-circuit activity rather than inter-circuit activity controls precedence. Thus, though circuit jurisdiction is not tightly coupled to its surrounding populations, on balance, circuit-by-circuit super-linear scaling seems to best model the pace of law over time.
Article Rank Power-Law Scaling
Description
In their 2007 paper “Web of Law,” T. Smith showed that American case law is a scale-free network, in which the number of citations follows a power-law distribution [10]. Smith conjectured that this structure is a result of so-called preferential attachment. Highly cited opinions are more visible and thus more likely to receive more citations in the future. In this section we expand this work, fitting a power law not to the number of citations but to the ArticleRank of a case. ArticleRank is less sensitive to the dynamics of preferential attachment. A relatively unknown case may achieve a high ArticleRank by being cited by several landmark cases. We also examine the ArticleRank distribution in federal district, federal appellate, and United States Supreme Court cases separately to compare the dynamics. Figure 14 plots the complementary cumulative distribution function (CCDF) of the of the ArticleRank distributions as solid lines and their corresponding power law fits as dotted lines.
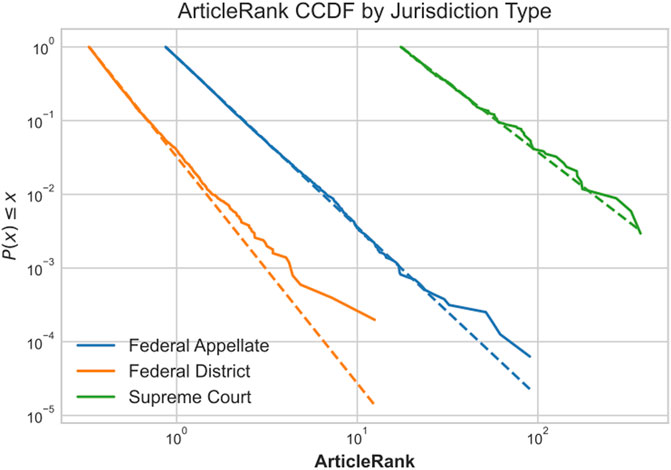
FIGURE 14. Article Rank CCDF by jurisdiction type.
Results
We use the statistical methods developed by [42] and implemented in python by [43]. Examining the CCDF of the ArticleRank distributions within Figure 14, the major difference between the three types of federal courts is immediately obvious. Supreme Court opinions have a much higher ArticleRank than federal appellate opinions, and federal appellate opinions have a much higher ArticleRank than federal district opinions. This result is to be expected. Higher courts have more influence than lower courts. The scaling exponent, alpha, of each distribution is displayed in Table 4. The scaling exponent determines the heaviness of the distribution tail. A low scaling exponent implies the distribution has more weight in its tail, or more high-rank cases. A high scaling exponent implies a distribution has fewer high-rank cases. The table shows that higher courts have lower scaling exponents, or more high-rank cases.

TABLE 4. Scaling exponent for each court type.
As power laws are mathematical objects, one does not expect to find perfect power-law fits from data gathered from a real-world system. This being the case, it is difficult to say definitively if a power-law fit is statistically significant. Typically, one would look at the fits of several different skewed distributions, with the assumption that the best fit of the set is the true underlying distribution. Following from Alstott, we use comparative methods to assess the goodness of fit of the distributions. We fit several candidate distributions to the data and compute the log-likelihood ratio of each to determine what distribution explains the data best. The results of the power-law fit as well as the log-likelihood ratios are shown in Table 5. A positive value of the log-likelihood ratio indicates the first distribution is a better fit than the second, while a negative value indicates the reverse. The exponential distribution is an exceedingly poor candidate. The results are inconclusive for the two higher courts, the Supreme Court and federal appellate courts; for both courts, the log-likelihood ratio between the power law and the log-normal distribution is close to zero. The district court has a power-law and log-normal log-likelihood ratio of −0.47, indicating the log-normal distribution is a significantly better fit than a power law. Once more, the high p-values indicate these results are not conclusive as to the power law fit.
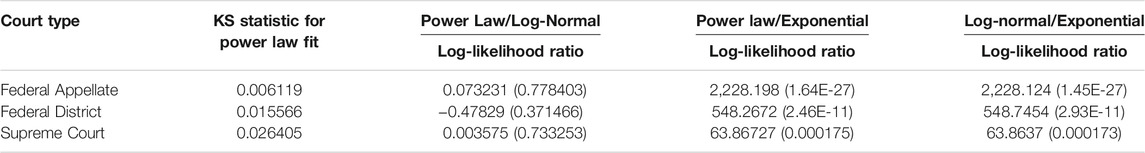
TABLE 5. Goodness of fit for power-law distribution by court-type. p-values of log-likelihood ratios are in parenthesis.
T. Smith showed that the number of citations in the United States Federal Case Law follows a clear scale-free distribution [10]. Our results are performed on another metric, ArticleRank, and performed on a significantly larger sample of the corpus. Our results, in contradistinction to T. Smith, show that the ArticleRank, while clearly a heavy-tailed distribution, is not definitively a power law. One of two causes could explain this discrepancy. First, ArticleRank is not strongly dependent on the number of citations an opinion receives. It has been shown both empirically and analytically that the degree distribution of scale-free networks follows a power law [15], but others have shown analytically that the PageRank distribution in scale-free networks departs from a power law for large and small values [44]. If this result holds for ArticleRank as well as PageRank, it could explain the deviations in our data. Second, our fits were conducted on a much larger sample than Smith’s. It is possible the United States Federal Case Law network is not in fact scale-free, although more work would be needed to confirm or reject this hypothesis. For example, when a landmark case is published it may be initially heavily cited per a preferential attachment dynamic; however, as that part of the law becomes well-settled it may be litigated less often, resulting in fewer citations and thus breaking the preferential attachment dynamic and truncating the power law into something more closely resembling an exponential distribution.
Conclusion
This paper explored the structure and dynamics of modern United States Federal Case Law. The dataset was larger than previous work of which we are aware. While not all of the analyses performed were novel, e.g., others have analyzed the citation network structure of some cases, we demonstrated the ability to perform these analyses at very large scales, and our analyses confirmed previously hypothesized features of the citation network: namely sparsity and degree centrality that is both highly skewed and proportional to the hierarchy of courts represented. Other analyses performed on this data were novel in this space and demonstrated that these techniques can highlight change occurring within society that are then reflected in changes to the society’s legal system. Adding the structure of topic modeling to the citation network gave a grounding for tracing the development of legal doctrine through time. In future analyses we hope to investigate additional specific threads of legal doctrine development [akin to the constitutional analyses undertaken by 47]. The results of analysis with topic modeling also give evidence against the common intuition that jurisdictions have specialized in particular types of cases over time, even if the circuits have grown further apart as measured by certain distance metrics. We find signatures of stare decisis and precedence within the data via increasing ArticleRank within the court hierarchy and a distribution not clearly scale-free nor exponential. This also provides quantitative evidence that cases are built very purposefully. While not a shocking insight, it is instructive to know that these data contain the correct signals. We also find the impact of the “cases and controversies” clause in the scaling dynamics of opinion production, scaling super-linearly with population growth suggesting courts are directly impacted by social interaction. Furthermore, this analysis highlighted the impact of controlling precedence, by showing that the “correct” level of analysis is likely the circuit rather than the whole of the courts. Additionally, our analysis indicates that a change occurred in the dynamics of the federal courts in the 1970s. It is our intention to investigate this further in a subsequent study.
Data Availability Statement
All raw data was obtained via bulk download from www.courtlistener.com.
Author Contributions
KA, JH, MK, JK, SM, CP, ZS, WT, and RZ performed analyses, MK and BB designed the project, all authors contributed to the creation of the manuscript equally.
Funding
This research was funded by the MITRE Innovation Program.
Conflict of Interest
The authors declare that the research was conducted in the absence of any commercial or financial relationships that could be construed as a potential conflict of interest.
Publisher’s Note
All claims expressed in this article are solely those of the authors and do not necessarily represent those of their affiliated organizations, or those of the publisher, the editors, and the reviewers. Any product that may be evaluated in this article, or claim that may be made by its manufacturer, is not guaranteed or endorsed by the publisher.
Footnotes
1An interesting connection that arose in the 80-topics model was a high relevance of trademark to a topic centered around banking. Banks were initially tightly regulated, highly local institutions with nondescript, similar names. As regulation loosened and the local banks began to increase their geographic footprint, name collisions occurred, and court cases ensued.
2See for example, Quanquin, H., 2019 who illustrates the push-and-pull yet side-by-side co-emergence of feminism and Black civil rights [45] and Pierson, M.D., 2005 who revisits the “patriarchal institution” of slavery in the 1850s, cautioning that while “the flow of influence ran in both directions” (p. 387), “too little attention has been paid to the ways in which the early feminist campaign affected antislavery” (p. 398) [46].
3Data from Annual Estimates of the Population for the U.S. and States, and for Puerto Rico | FRED | St. Louis Fed.
References
1. Klingenstein S, Hitchcock T, DeDeo S. The Civilizing Process in London's Old Bailey. Proc Natl Acad Sci USA (2014) 111(26):9419–24. doi:10.1073/pnas.1405984111
2. Livermore MA, Rockmore DN. Law as Data: Computation, Text, and the Future of Legal Analysis. Santa Fe, NM: SFI Press (2019).
3. Bommarito MJ, Katz DM, Zelner JL, Fowler JH. Distance Measures for Dynamic Citation Networks. Physica A: Stat Mech its Appl (2010) 389(19):4201–8. doi:10.1016/j.physa.2010.06.003
4. Bommartio M, Katz D, Isaacs-See J. An Emperical Survey of the Population of U.S. Tax Court Written Decisions. Va Tax Rev (2011) 30(3):523–58.
5. Bommarito M, Katz D, Zelner J. Law as a Seamless Web? Comparison of Various Network Representations of the United States Supreme Court Corpus (1791-2005). In: Proceedings of the 12th International Conference on Artificial Intelligence and Law (ICAIL '09). IEEE (2010).
6. Dadgostari F, Guim M, Beling PA, Livermore MA, Rockmore DN. Correction to: Modeling Law Search as Prediction. Artif Intell L (2020) 29:1. doi:10.1007/s10506-020-09264-2
7. Ash E, Chen DL. Mapping the Geometry of Law Using Document Embeddings. Ash, Elliott and Chen, Daniel L., Mapping the Geometry of Law Using Document Embeddings (2018). Available at: https://ssrn.com/abstract=3305761 (Accessed July 6, 2020).
8. Fowler JH, Johnson TR, Spriggs JF, Jeon S, Wahlbeck PJ. Network Analysis and the Law: Measuring the Legal Importance of Precedents at the U.S. Supreme Court. Polit Anal (2007) 15:324–46. doi:10.1093/pan/mpm011
9. Leibon G, Livermore M, Harder R, Riddell A, Rockmore D. Bending the Law: Geometric Tools for Quantifying Influence in the Multinetwork of Legal Opinions. Artif Intell L (2018) 26(2):145–67. doi:10.1007/s10506-018-9224-2
11. Coupette C, Beckedorf J, Hartung D, Bommarito M, Katz DM. Measuring Law over Time: A Network Analytical Framework with an Application to Statutes and Regulations in the United States and Germany. Front Phys (2021) 9:1. doi:10.3389/fphy.2021.658463
12. Katz DM, Coupette C, Beckedorf J, Hartung D. Complex Societies and the Growth of the Law. Sci Rep (2020) 10:18737. doi:10.1038/s41598-020-73623-x
13. Staudt CL, Sazonovs A, Meyerhenke H. NetworKit: A Tool Suite for Large-Scale Complex Network Analysis. Net Sci (2016) 4(4):508–30. doi:10.1017/nws.2016.20
14. Simon HA. On a Class of Skew Distribution Functions. Biometrka (1955) 42(3-4):425–40. doi:10.1093/biomet/42.3-4.425
15. Barabási A-L, Albert R. Emergence of Scaling in Random Networks. Science (1999) 286:509–12. doi:10.1126/science.286.5439.509
16. Mohr JW, Bogdanov P. Introduction-Topic Models: What They Are and Why They Matter. Poetics (2013) 41(6):545–69. doi:10.1016/j.poetic.2013.10.001
18. McCallum AK. MALLET: A Machine Learning for Language Toolkit (2002). Retrieved from http://mallet.cs.umass.edu/ (Accessed October 11, 2019).
19. Hoffman M, Bach F, Blei D. Online Learning for Latent Dirichlet Allocation. Adv Neural Inf Process Syst (2010) 23:1.
20. Pedregosa F, Varoquaux G, Gramfort A, Michel V, Thirion B, Grisel O, et al. Scikit-learn: Machine Learning in Python. J Machine Learn Res (2011) 12:2825–30.
21. Hoffman MD, Blei DM, Wang C, Paisley J. Stochastic Variational Inference. J Machine Learn Res (2013) 14:1303–47.
22. Kingma DP, Welling M. Auto-Encoding Variational Bayes. In: Proceedings of the 2nd International Conference on Learning Representations (ICLR). IEEE (2014).
23. Rezende DJ, Mohamed S, Wierstra D. Stochastic Backpropagation and Approximate Inference in Deep Generative Networks. In: Proceedings of the 31st International Conference on Machine Learning. PMLR (2014). p. 1278–86.
24. Srivastava N, Sutton C. Autoencoding Variational Inference for Topic Models. In: International Conference on Learning Representations. IEEE (2017).
25. Card D, Tan C, Smith NA. NEural Models for Documents with Metadata. Proc 56th Annu Meet Assoc Comput Linguistics (2018) 1:2031–40. doi:10.18653/v1/p18-1189
26. Erickson N, Mueller J, Shirkov A, Zhang H, Larroy P, Li M, et al. AutoGluon-Tabular: Robust and Accurate AutoML for Structured Data. arXiv preprint (2020).
27. Sievert C, Shirley KE. LDAvis: A Method for Visualizing and Interpreting Topics. In: Proceedings of the Workshop on Interactive Language Learning, Visualization, and Interfaces. IEEE (2014). p. 63–70. doi:10.3115/v1/w14-3110
28. Mikolov T, Sutskever I, Chen K, Corrado G, Dean J. Distributed Representations of Words and Phrases and Their Compositionality. In: NIPS'13: Proceedings of the 26th International Conference on Neural Information. IEEE (2013). p. 3111–9.
29. Pennington J, Socher J, Manning CD. GloVe: Global Vectors for Word Representation (2014). Retrieved from https://nlp.stanford.edu/pubs/glove.pdf (Accessed September 11, 2019). doi:10.3115/v1/d14-1162
30. Joulin A, Grave E, Bojanoswski P, Mikolov T. Bag of Tricks for Efficient Text Classification. In: Proceedings of the 15th Conference of the European Chapter of the Association for Computational Linguistics: Volume 2. Valencia, Spain: Short Papers (2017). p. 427–31. doi:10.18653/v1/e17-2068
31. Perozzi B, Al-Rfou R, Skiena S. DeepWalk. In: Proceedings of the 20th ACM SiGKDD International Conference on Knowledge Discovery and Data Mining. New York: ACM (2014). doi:10.1145/2623330.2623732
32. Itti L, Baldi P. Bayesian surprise Attracts Human Attention. Vis Res (2009) 49:1295–306. doi:10.1016/j.visres.2008.09.007
33. Murdock J, Allen C, DeDeo S. Exploration and Exploitation of Victorian Science in Darwin's reading Notebooks. Cognition (2017) 159:117–26. doi:10.1016/j.cognition.2016.11.012
34. Thompson WH, Wojtowicz Z, DeDeo S. Lévy Flights of the Collective Imagination. Lévy Flights of the Collective Imagination (2018). Available at: https://arxiv.org/abs/1812.04013.
35. Barron ATJ, Huang J, Spang RL, DeDeo S. Individuals, Institutions, and Innovation in the Debates of the French Revolution. Proc Natl Acad Sci USA (2018) 115:4607–12. doi:10.1073/pnas.1717729115
36. Li J, Willett P. ArticleRank: a PageRank‐based Alternative to Numbers of Citations for Analysing Citation Networks. Ap (2009) 61(6):605–18. doi:10.1108/00012530911005544
37. Baum L. Specialization and Authority Acceptance: The Supreme Court and Lower Federal Courts. Polit Res Q (1994) 47(3):1. doi:10.2307/448849
38. Baum L. Probing the Effects of Judicial Specialization. Duke L J (2009) 58:1. doi:10.1093/sysbio/syp011
39. Wasserman MF, Slack JD. Can There Be Too Much Specialization? In: Specialization in Specialized Courts. Chicago, IL: Northwestern University Law Review (2021). p. 1.
40. West GB, Brown JH. The Origin of Allometric Scaling Laws in Biology from Genomes to Ecosystems: towards a Quantitative Unifying Theory of Biological Structure and Organization. J Exp Biol (2005) 208:1575–92. doi:10.1242/jeb.01589
41. Bettencourt LMA, Lobo J, Helbing D, Kuhnert C, West GB. Growth, Innovation, Scaling, and the Pace of Life in Cities. Proc Natl Acad Sci (2007) 104:7301–6. doi:10.1073/pnas.0610172104
42. Clauset A, Shalizi CR, Newman MEJ. Power-Law Distributions in Empirical Data. SIAM Rev (2009) 51:661–703. doi:10.1137/070710111
43. Alstott J, Bullmore E, Plenz D. Power law: A python Package for Analysis of Heavy-Tailed Distributions. PLoS ONE (2014) 9:e85777. doi:10.1371/journal.pone.0085777
44. Avrachenkov K, Lebedev D. PageRank of Scale Free Growing Networks. Valbonne, France: Tech. rep. (2006).
45. Quanquin H. Slavery Cannot Be Covered up with Broadcloth or a Bandanna”: The Evolution of White Abolitionist Attacks on the “Patriarchal Institution. J Early Republic (2005) 25(3):383–415.
Keywords: judicial opinions, citation networks, topic models, information theory, law
Citation: Adusumilli K, Brown B, Harrison J, Koehler M, Kutarnia J, Michel S, Olivier M, Pfeifer C, Slater Z, Thompson W, Vetter D and Zacharowicz R (2022) The Structure and Dynamics of Modern United States Federal Case Law. Front. Phys. 9:695219. doi: 10.3389/fphy.2021.695219
Received: 14 April 2021; Accepted: 24 November 2021;
Published: 07 January 2022.
Edited by:
Pierpaolo Vivo, King’s College London, United KingdomReviewed by:
James Chen, Michigan State University, United StatesDirk Hartung, Bucerius Law School, Germany
Copyright © 2022 Adusumilli, Brown, Harrison, Koehler, Kutarnia, Michel, Olivier, Pfeifer, Slater, Thompson, Vetter and Zacharowicz. This is an open-access article distributed under the terms of the Creative Commons Attribution License (CC BY). The use, distribution or reproduction in other forums is permitted, provided the original author(s) and the copyright owner(s) are credited and that the original publication in this journal is cited, in accordance with accepted academic practice. No use, distribution or reproduction is permitted which does not comply with these terms.
*Correspondence: Matthew Koehler, bWtvZWhsZXJAbWl0cmUub3Jn