- 1School of Biomedical Engineering, McMaster University, Hamilton, ON, Canada
- 2Imaging Research Centre, St. Joseph’s Healthcare, Hamilton, ON, Canada
- 3Electrical and Computer Engineering, McMaster University, Hamilton, ON, Canada
- 4Department of Radiology, McMaster University, Hamilton, ON, Canada
Sodium is one of the most abundant physiological cations and is a key element in many cellular processes. It has been shown that several pathologies, including degenerative brain disorders, cancers, and brain traumas, express sodium deviations from normal. Therefore, sodium magnetic resonance imaging (MRI) can prove to be valuable for physicians. However, sodium MRI has its limitations, the most significant being a signal-to-noise ratio (SNR) thousands of times lower than a typical proton MRI. Radiofrequency coils are the components of the MRI system directly responsible for signal generation and acquisition. This paper explores the intrinsic properties of a Koch snowflake fractal radiofrequency surface coil compared to that of a standard circular surface coil to investigate a fractal geometry’s role in increasing SNR of sodium MRI scans. By first analyzing the network parameters of the two coils, it was found that the fractal coil had a better impedance match than the circular coil when loaded by various anatomical regions. Although this maximizes signal transfer between the coil and the system, this is at the expense of a lower Q, indicating greater signal loss between the tissue and coil. A second version of each coil was constructed to test the mutual inductance between the coils of the same geometry to see how they would behave as a phased array. It was found that the fractal coils were less sensitive to each other than the two circular coils, which would be beneficial when constructing and using phased array systems. The performance of each coil was then assessed for B1+ field homogeneity and signal. A sodium phantom was imaged using a B1+ mapping sequence, and a 3D radial acquisition was performed to determine SNR and image quality. The results indicated that the circular coil had a more homogeneous field and higher SNR. Overall while the circular coil proved to generate a higher signal-to-noise ratio than the fractal, the Koch coil showed higher versatility when in a multichannel network which could prove to be a benefit when designing, constructing, and using a phased array coil.
1 Introduction
Sodium magnetic resonance imaging (23Na-MRI) has the potential to become a valuable tool in the clinical setting, by assisting physicians through the diagnosis, prognosis, and monitoring of a variety of pathologies including cancers, degenerative brain disorders, concussion, and osteoarthritis [1, 2]. However, due to quantum mechanical limitations such as rapid spin dephasing and a small gyromagnetic ratio, and biological restrictions including low in vivo sodium concentrations, the signal-to-noise ratio (SNR) of the resultant 23Na-MRI images can be up to thousands of times lower than traditional clinical proton MRI images [2, 3]. The point-of-source in MRI signal generation and acquisition is the radiofrequency (RF) coil, and the quality of coil performance will propagate throughout the remainder of the system. The quality of the performance of an MRI RF coil is based on the contribution of several factors intrinsic to the coil such as the tune and match of the coil, the quality factor (Q), the homogeneity of the produced RF field (B1+), and the homogeneity of the induced RF signal (B1−) [4, 5].
The simplest RF coil is a one element transmit/receive (Tx/Rx) surface coil, consisting usually of a single conductive loop with capacitors for tuning and matching [4, 5]. The Tx/Rx surface coil has great signal sensitivity in a local area; however, it produces an inherently heterogeneous B1+ field (and due to reciprocity, the B1−) because the field strength decreases with distance from the coil. Multiple surface coils can be arranged together to form a multi-channel phased array coil. Phased array coils can produce a more homogeneous B1+,− field over a larger volume than a single surface coil; however, the multiple elements interact with each other, which creates challenges when designing and constructing the coil. This study looks to see if a fractal geometry can play a role in improving the SNR of 23Na-MRI by overcoming some of the shortcomings of traditional RF coils.
The term fractal originated from Benoit Mandelbrot’s Fractal Geometry of Nature published in 1983 [6], however these structures have been studied by mathematicians since the early 1900’s. Fractal geometries are patterns that can be decomposed into self-similar elements. As such, they do not conform to standard Euclidean geometry and instead behave idiosyncratically. These patterns can exist in non integer dimensions and have unique space filling ability [7, 8]. Fractal geometries have been explored before in electromagnetic applications [9], as fractal antennas have been used in telecommunication systems for years, with the common benefit being compact size which allows for a greater effective antenna length within a smaller space. This is not the only benefit to having a fractal (or fractal-like) shape, as it has been shown that these so-called “shaped antennas” can produce higher gain, directivity, and field strength than a standard loop or monopole/dipole antenna of a comparable size [8, 10].
Telecommunication systems are generally focused on far field applications, however most MRI RF coils exist in the near field region, so the question arises: how do far field fractal antennas translate to near field MRI applications? A single fractal antenna can act as though it is comprised of multiple elements due to each self-similar subsection of the coil radiating as a single antenna [8]. This may produce some interesting constructive and destructive interference patterns more locally around the antenna and could more evenly distribute the radiated energy. The aforementioned space filling ability of a fractal antenna has been shown to result in higher Q values and better impedance matching than standard antennas that take up the same amount of space, which would benefit MRI by maximizing the signal transfer [11, 12]. It has also been shown that a multi-loop fractal-like surface coil geometry in proton MRI applications produces higher sensitivity [13].
There exist thousands of fractal and fractal-like geometries and a smaller subset are the focus of most antenna research and applications, but here only one pattern was studied: the Koch snowflake (Figure 1). This geometry was one of the fractals that was explored in [11, 12] and showed a higher Q, better impedance match, and less mutual inductance when in arrays. In proton MRI applications, it has been shown that multiple Koch snowflake fractal elements when in an overlapping array have higher sensitivity, Q values, and SNR along with reduced mutual inductance than circular elements in a similar array [14]. Previous simulations of a Koch snowflake coil performed by Dona Lemus et al. [15] and Nowikow et al. [16] have shown that physical construction and implementation is warranted.

FIGURE 1. The first four generations of a Koch snowflake fractal compared to a circle of the same radius (image modified from https://en.wikipedia.org/wiki/Koch_snowflake, which is licensed for free use under: https://creativecommons.org/licenses/by-sa/3.0/deed.en).
This leads to the hypothesis that a Koch snowflake fractal geometry surface coil can improve the quality of 23Na-MRI images by increasing the resultant SNR due to a more homogeneous B1+ (and B1−) field, a superior filling factor, and more robust impedance matching than a typical circular geometry surface coil. In addition, the lower mutual inductance for the Koch snowflake geometry will facilitate implementation in phased array coils.
2 Materials and Methods
2.1 Coil Design
Design parameters for the initial simulations were set with fabrication in mind. Due to the complex geometry of the Koch snowflake fractal, it was decided that the coils would be manufactured on a printed circuit board (PCB) to allow for consistency and accuracy. This restricted the size of the coil designs to fit within a 100 mm by 100 mm area. As such, the coil diameter chosen was 90 mm (∼3.5″) which falls within the 3–6″ size of many standard commercial surface coils. The choice of conductor was copper as it is a standard etching material. The width of the copper was selected to be 3 mm as it was narrow enough to allow for a Koch design but wide enough for ease of capacitor soldering for the eventual construction. With restrictions on coil diameter and copper width, it was determined early on that the only viable Koch snowflake fractal generation that could be manufactured with a level of practicality was a third-generation Koch. Thus, two different Tx/Rx surface coils were simulated and constructed, the first was circular in geometry to act as a reference for a standard “typical” surface coil and the second was a third-generation Koch snowflake fractal geometry (Figure 2).
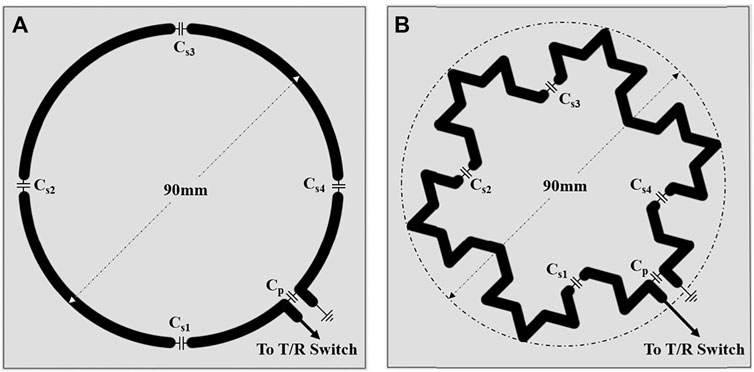
FIGURE 2. The geometry of the (A) circular, and (B) fractal coil. Each were copper etched on a 100 × 100 mm FR4 substrate with breaks in loop for the tuning capacitors (Cs1−4) and the matching capacitor (Cp). One end of the loop for both coils was connected to the T/R switch via a coaxial cable while the other end of the loop was grounded using the same coaxial cable to form a one port network.
2.2 Simulations
The two coils were simulated using ANSYS HFSS (Ansys Inc., Canonsburg, PA, United States), using the design constraints laid out previously. The coils were simulated as copper sheet conductor (infintesimally thin) on a 1 mm thick FR4 substrate. Each design incorporated five breaks, four in the main loop for tuning capacitors and one in between the legs for a matching capacitor. These were used to tune the coils to 33.8 MHz, the Larmor frequency of sodium at 3 Tesla (T), and to match the coils to 50Ω. The coils were loaded by a rectangular box of 0.9% wt/v saline to mimic a standard 23Na-MRI phantom.
Two sets of fields data were acquired via simulation. The first set included the electric (E) and magnetic (H) fields, as well as the surface current density (J), obtained at unity power, where both coils were fed with the same power level to act as a direct comparison between the fields. The second set of fields were acquired at an adjusted power level such that the coils would produce a magnetic field that would cause a 90° tip in the sodium spins in the phantom directly below the coil. At this power level the now denoted B1 fields were acquired, as well as the E fields and surface J fields.
The H and B1 fields were analyzed in MATLAB (Mathworks, Natick, MA, United States) to determine their homogeneity with two main methods. First the homogeneity of the field was measured by calculating the mean and standard deviation of the signal over various regions of interest (ROIs) selected to be located in the sensitive region of the coil [4, 5], where the standard deviation of the field in each ROI was used as a representation of the homogeneity. The selected ROIs were two cylindrical regions of different radii (25 and 45 mm) situated with their circular faces parallel to the coil plane with a height between a half radius and a radius away from the coil plane. Six spherical ROIs were also selected, with varying radii (6, 8, 10, 12, 14, and 18 mm). All ROIs are shown in Figure 3. It was also of interest to see how the magnetic fields behaved as distance from the coil increased, and so a set of plots were made of the mean signal strength as a circular ROI (of two radii, 25 and 45 mm) moved away from the coil plane.
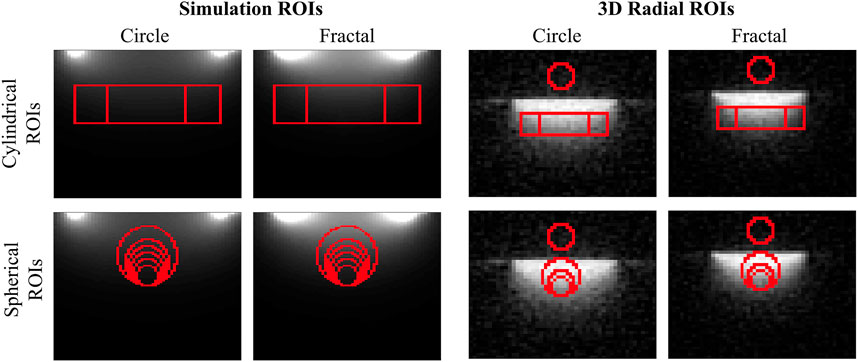
FIGURE 3. The ROIs used for the homogeneity measurements of the simulated fields and the 3D radial volume data, as well as the SNR calculations from the 3D radial data of both the circular and fractal coils. The cylindrical ROIs are of radius 25 mm and ∼45 mm and are used to represent the coil’s optimal sensitivity region between r/2 and r deep into the phantom [4]. The simulations also used six spherical ROIs of radii 6, 8, 10, 12, 14, and 18 mm, whereas the measured 3D radial data used only three spherical ROIs of radii 9, 12.5, and 18.75 mm. The noise ROI for SNR calculations using the measured data is shown as the spherical ROI above the coil plane for the 3D radial data.
The E and J fields were used as a way to see if the safety measures between the two coils would need to be modified. As the fractal coil has a greater effective length of conductor in the same area it was thought it may require more capacitive breaks to help disperse the E field and current density.
2.3 Coil Construction and Bench Measurements
After simulation the two coils were then constructed. The coils were manufactured on a PCB, as copper etching on an FR4 substrate by Elecrow (https://www.elecrow.com/). The etched copper was 3 mm in width and 35 um in thickness, and the coils themselves replicated the simulated designs: 90 mm in diameter to fit on the 100 × 100 mm substrate. The same number of breaks in each loop as the simulations were incorporated into the design to allow for tuning and matching capacitors (American Technical Ceramics, NY) with values ranging between 10 and 470 pF. Ideally, the coils would be fed by a λ/2 coaxial cable; however, due to sodium resonating at such a low frequency at 3T, the coaxial cable required would have to be 4.45 m in length which would not be feasible to implement in the MRI without introducing loops and bends. Instead, a 0.4 m coaxial cable was used to feed the two coils, the shortest length that allowed the coil to reach both the phantom and transmit/receive (T/R) switch.
All S-parameter and Q measurements of the fabricated coils were performed using an Agilent 4395A network analyzer and an Agilent 87511A S-parameter test set. Both the circular and fractal surface coil were tuned and matched, while being loaded by a saline phantom, to 33.8 MHz, the Larmor frequency of sodium at 3 T. To explore how effective each geometry was at matching to various parts of anatomy, once their original tune and match (to the phantom) were set, the coils were loaded with different parts of the body and the respective S11 parameters were recorded and reported in decibels (dB): 20 log 10(|S11|). The chosen regions of anatomy were the right knee, abdomen (slightly right from midline, below the ribcage to emulate a possible liver scan), and the back of the head as these are three potential clinically relevant regions for 23Na-MRI scans. 11 subjects were used for the knee, abdomen, and head loading experiment. A ratio of unloaded to loaded Q (QU and QL) was calculated for each bodily load [denoted as (Qratio)].
Additional circular and fractal coils were constructed, and tuned and matched to the phantom, to explore how the coil geometry affected their mutual inductance. The S21 of each coil pair while loaded by the phantom were measured as 20 log 10(|S21|) (dB) using the aforementioned network analyzer and S-parameter test set at multiple separation distances between 4 and 9 cm (measured center to center), as well as at the optimal separation for a single, not split, S21 peak. As two coils interact with each other their resonant frequency splits into two modes which can be visualized as a split in S21 curve. The geometry of the coil dictates at what degree of coil separation geometric decoupling occurs (i.e. where the mutual inductance is eliminated, or at least minimized) which can be visualized as this split S21 curve merges back into a single resonant peak. The fractal coil’s S21 for each distance was measured in three configurations: overlap on the long axis (denoted LA), overlap on the short axis (denoted SA), and overlap between the long axis of one fractal and the short axis of the other (denoted MA, for “mixed axis”). The QU and QL were measured for the coils at their optimal distance of separation/overlap.
2.4 Experimental Setup
The remaining experiments were performed using a GE MR750 3 T magnet (General Electric Healthcare, WI). The phantom was elevated on the bed of the MRI by a foam riser such that when the selected coil was placed atop, the field-of-view (FOV) of the coil was at magnet isocenter. The coil in use was connected to the scanner via a single-channel sodium T/R switch. The coil that was being used was positioned on top of the phantom, substrate down, such that the coaxial feed was aligned down the bore of the magnet. The coil was secured in place using a weighted bag. Each coil had a vitamin E capsule taped to the center of the coil to allow for localization with a generic proton three-plane localizing scan using the body coil. The phantom used to load the coils during their tune and match was the phantom that was used for imaging. The phantom was a rectangular plastic box of dimensions 160 × 270 mm with a depth of 90 mm containing 0.9% wt/v saline (aqueous NaCl). The size of the phantom was chosen to allow for a B1+ map of the full FOV of each coil if a 90° tip angle was applied directly below the coil plane.
2.5 MNS Prescan
To determine the power required to achieve a 90°tip angle, a GE Healthcare sequence, implemented by Schulte et al. [17] called the MNS prescan, was used. The power was calibrated to a 10 mm thick plane at the surface of the phantom, directly below, and parallel to the plane of the coil, and the lid of the phantom. Before the MNS prescan was run, an initial 10dB attenuation was applied to the RF power, so that the transmit gain (TG) could be effectively chosen (no initial attenuation would result in too much power for a 90°tip, even if the TG was 0).
2.6 B1+ Mapping
The Bloch-Siegert shift method, as outlined by Sacolick et al. [18], was selected as the way to map the B1+ fields of the two coils. Four maps of the B1+ field were calculated for each coil: one perpendicular to the coil plane and through the center of the coil, and three maps parallel to the coil plane, at differing depths (15, 25, 35 mm) from the coil. The data was acquired using a 2D, four-arm spiral sequence over a 150 mm FOV. The tip angle of the 10 mm thick slice selective pulse was 90°. The repetition time (TR) of the sequence was 84 ms, and 50 signal averages (NEX) were used. K-space was reconstructed using the algorithm described by Beatty et al. [19] into an 80 × 80 matrix. The mean and standard deviation of the field strength over each map’s FOV was calculated to determine the homogeneity of the field in that slice.
2.7 Homogeneity and Signal-to-Noise Ratio Measurements
A 3D radial sequence was used to obtain a 48 × 48 × 48 image matrix of the phantom. A 90°hard pulse was used to excite a 150 × 150 × 150 mm volume, and 7,333 spokes were sampled—one per every 23 ms TR.
Two NEX were used, and k-space was reconstructed using the previously stated algorithm [19]. The volume selected was centered on the coil in the transverse plane, and encompassed the entire depth of the phantom below the coil, and an additional air space above the coil. This volume was chosen such that the entire FOV of the coil would be imaged while leaving enough “empty space” available for a noise measurement.
The B1+ mapping sequence acquired the data in a 10 mm thick slice, and as such did not allow for reliable measurements of field homogeneity over a volume. However, since the acquired signal is proportional to the sine of the flip angle, and the flip angle is proportional to the magnitude of the B1+ field, the signal acquired by the 3D radial imaging sequence over its 15 cm FOV is representative of the field strength over that same volume. The homogeneity of the field was then measured using this 3D volume, by calculating the mean and standard deviation of the signal over various ROIs selected to be as similar as possible to the ROIs used to analyze the simulation results. The cylindrical ROIs for the experimental data were situated in the same coil sensitivity region with radii of 25 and 45 mm. Due to a reduction in resolution of the experimental data versus the simulated fields, only three spherical ROIs could be obtained with radii of 9, 12.5 and 18.75 mm. The ROIs used for this 3D radial data can be found alongside the simulated fields’ ROIs in Figure 3 (Note the FOV of the simulated data is 11 cm as opposed to the 15 cm FOV of the experimental data which explains the size discrepancy in the figure). As with the simulations it was of interest to see how the B1+ field behaved as distance from the coil increased. Thus, plots were made of the mean signal strength as a circular ROI (of two radii, 25 and 44 mm) moved away from the coil plane. Much like the analysis of the simulated data, all experimental data was analyzed using MATLAB.
The 3D volume acquired by the radial sequence was also used for SNR measurements. To allow for a homogeneity/SNR comparison, multiple SNR values were calculated, using the five ROIs described previously (Figure 3) as the signal region in the SNR calculation. The noise region used in the calculations was kept constant and can be seen in Figure 3 (spherical region above the coil). SNR was calculated as μsignalROI/σnoiseROI.
3 Results
3.1 Coil Loading and Matching
The S11 and Q values of the two coils when unloaded, loaded by the phantom, and loaded by the varying anatomical regions are given in Table 1. The values associated with anatomical regions (n = 11 subjects) are reported as a mean ± standard deviation. The Qratio (QU/QL) is also reported in the table. The coils were tuned and matched while being loaded by the phantom, and as such the respective S11 (at 33.8 MHz) of both are below a respectable −28 dB. There are three notable differences between the two coils when it comes to coil match and tissue coupling. First, the Koch coil has a significantly better match than the circular coil when being loaded by the anatomical regions, which can be observed in the lower S11 values. The second notable difference is the measured values when the coils are unloaded. The circular coil “unmatches” more so than the Koch coil (i.e. a higher S11) which results in a higher QU. These combine for a notable difference in Qratio when loaded by the phantom, and less notable difference in Qratio when loaded by human subjects.
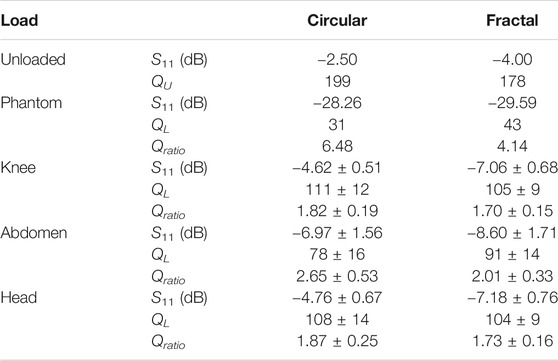
TABLE 1. The S11 values (in dB), the Q values (unitless), and the ratio of unloaded to loaded Q are reported in this table for both the circular and fractal coil over various loads. A mean and standard deviation are reported for the values calculated over the 11 subjects.
3.2 Mutual Inductance
The S21 curves of the circular coil pair, and three configurations of the fractal coil pair, are shown in Figure 4 over a 20 MHz bandwidth. At a separation distance of 9 cm both coil pairs had a split S21 peak, and as coils began to overlap, the peaks merged into one, each at a unique distance. It can be seen that depending on the rotational orientation of the fractal pair, the optimal distance to eliminate mutual inductance was varied, ranging between 5 and 6 cm, whereas the circular pair only had one optimal distance of 6.5 cm. It can be noted as well that the fractal coil pairs, regardless of orientation, were less responsive in terms of an S21 split peak as a function of distance, which could lead to the assumption that the interaction between the two fractal coils is less than the interaction between the two circular coils. The QL and the QU values are reported in Table 2 for the different coil pair configurations. There were two instances, when the coil pair was unloaded, that the S21 peak split and the QU was not measurable—and is indicated as “n/a” in the table.
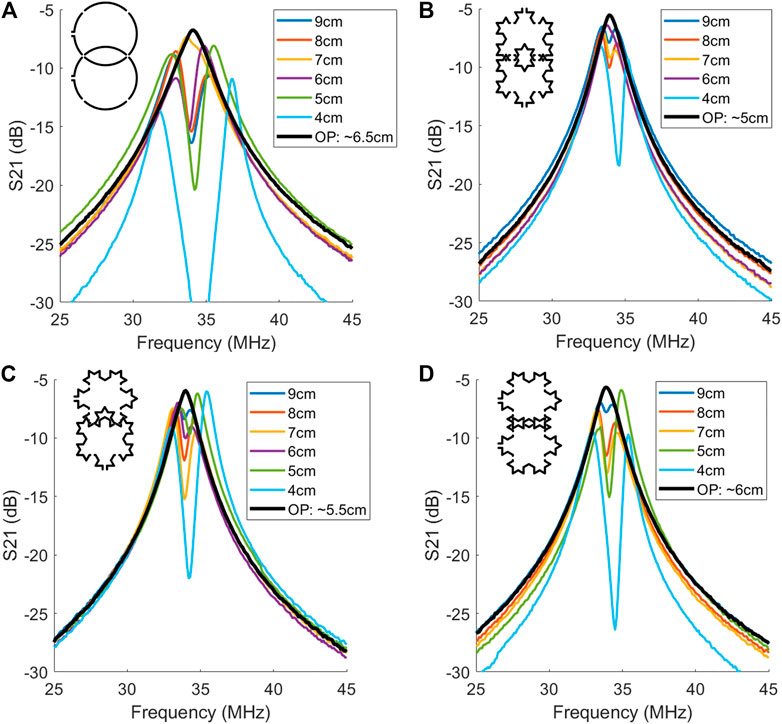
FIGURE 4. The S21 curves (in dB) of (A) the circular coil pair, (B) long axis (LA) overlap of the fractal pair, (C) mixed axis (MA) overlap of the fractal pair, and (D) short axis (SA) overlap of the fractal pair. The coil diagrams in the top left corner of each plot show the coil configurations. The black “OP” curve is the curve at an optimal distance of separation where the mutual inductance goes to zero and the curve merges into one singular peak.

TABLE 2. The Q values for each coil pair when arranged at their optimal distance to eliminate mutual inductance. Those distances are respectively 6.5, 5, 5.5, and 6 cm. The QU was reported as “n/a” for the configurations where the S21 peak was split at the optimal distance when unloaded.
3.3 B1+ Field Homogeneity and Signal-to-Noise Ratio
The four B1+ maps made for each coil are shown in Figure 5, alongside their simulated counterparts. The experimentally determined maps were overlayed onto their respective slices taken from the 3D volume acquired using the radial sequence. The mean and standard deviation of the B1+ maps are given in Table 3. The acquired maps were quite noisy, especially the third parallel slice 35 mm from the coil, which explains why the field strength appeared to increase at a larger depth. However, the standard deviation of the circular coil’s B1+ field for each map was consistently lower.
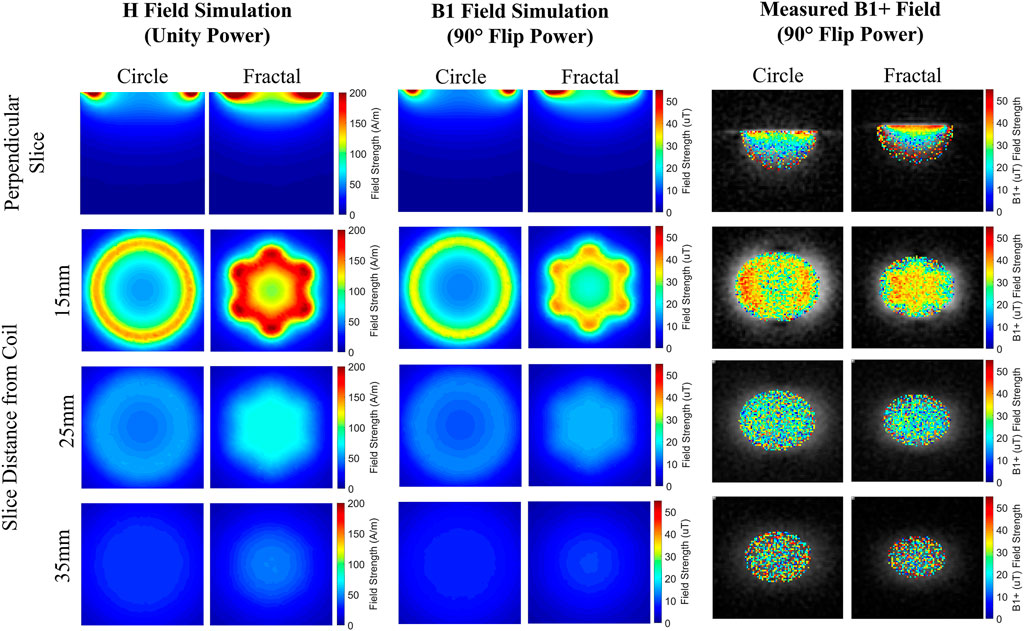
FIGURE 5. The experimental B1+ field maps of the circular and fractal coil, alongside each maps simulated counterpart at the same slice location. The simulated B1 field maps and the measured B1+ field maps are given in μT and the simulated H field maps are given in A/m.

TABLE 3. The mean and standard deviation of each of the measured B1+ maps shown in Figure 5, given in μT over the FOV shown in the map. The three parallel slices are listed in order of depth from the coil: 15, 25, and 35 mm respectively.
The signal strength and homogeneity calculated over the various ROIs from the 3D volume are given in Figure 6, again, alongside their simulated counterparts. In the simulations the field strength of the fractal coil over the ROIs was consistantly higher, whereas experimentally the coil with the higher signal for each ROI fluctuated; however, the standard deviation of the signal acquired by the circular coil is consistently lower than that of the Koch coil, over all ROIs—simulated and measured. The plots of signal behaviour with distance from the coil are shown in Figure 7. The signal from the Koch coil decays (in space) more rapidly than that from the circular coil, with signal variation of the latter being less as well. The SNR, calculated over various ROIs (Figure 3 and Table 4) shows the circular coil consistently had greater SNR than the fractal coil.
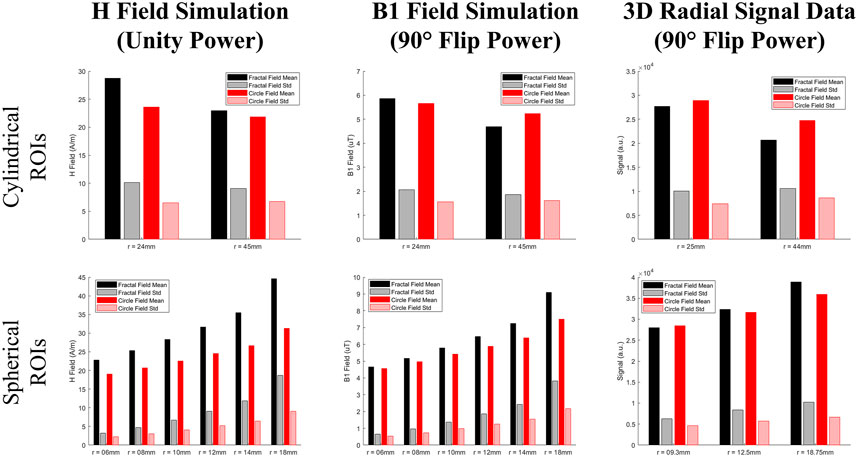
FIGURE 6. The means and standard deviations over various ROIs shown in Figure 3 for the simulated H field (given in A/m), the power compensated simulated B1 field (given in μT), and the measured signal from the 3D radial volume data (given in a.u.) for both the circular and fractal coil. As the standard deviation of the ROIs was used as the main metric for determining a given coil’s homogeneity, the standard deviations are shown for comparison as their own bar in the plot. The radii of each ROI is the label for each set of bars.
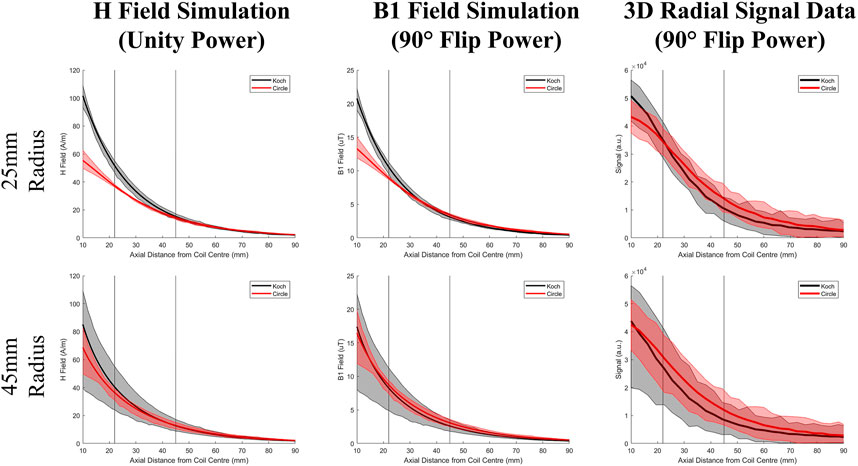
FIGURE 7. The plots of field strength and variation of the simulated H field (given in A/m), the power compensated simulated B1 field (given in μT), and the measured signal from the 3D radial volume data (given in a.u.) over a circular ROI (of radii 25 and 45 mm) as the ROI moves away from the coil and deeper into the phantom for both the circular and fractal coils. The mean of the field strength is given by the bold curves in red and black, and the lighter bands in grey and pink that encompass the bold curves represent the range of signal values over the ROI at each distance from the coil.

TABLE 4. The SNR values for each 3D radial experimental data ROI shown in Figure 3. The first three ROIs in the table are the spherical ROIs, and the last two are the cylindrical ROIs. The noise ROI used for calculations is also given in Figure 3 as the spherical ROI above the coil plane.
3.4 Coil Safety
The simulated coil surface current densities, coil surface electric fields, and the simulated electric fields in the phantom can be found in Figure 8. It can be seen that the fractal coil’s conductive surface had both a lower current density and electric field than that of the circular coil at both power levels. The E fields deposited in the phantom are quite similar for both coils, however the circular coil’s E field appears to penetrate deeper into the phantom, whereas the fractal coil’s E field is more concentrated into a smaller area (on a slice per slice basis).
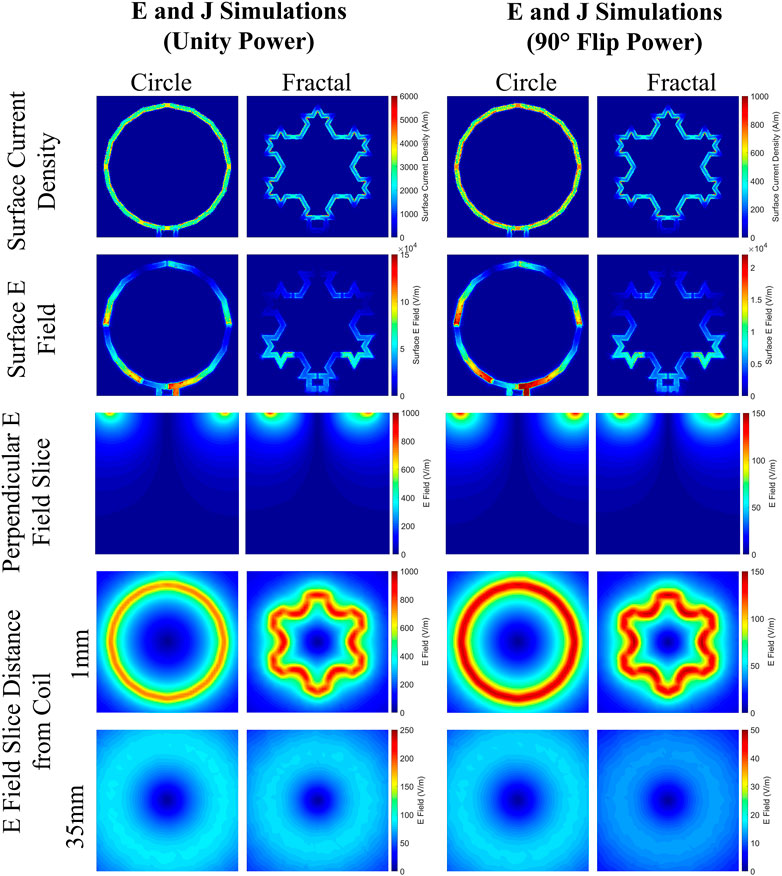
FIGURE 8. The simulated surface current density, the surface electric field, and the electric field depositied in the phantom for both the circular and fractal coil.
4 Discussion
This study explored the network parameter and B1+ field characteristics of a Koch snowflake fractal geometry RF surface coil compared to that of a standard circular surface coil for sodium MRI. The hypothesis was that the fractal coil would provide increased SNR in sodium MRI. Coil loading and matching, mutual inductance, RF field homogeneity and SNR was evaluated. However, the fractal design only excelled in being less prone to object-induced match variability and in reducing mutual inductance between loops, as compared to circular coils of the same diameter.
Impedance matching is important when designing, constructing, and tuning an MRI RF coil—the better the match, the optimal the power transfer between the coil and the system, and hence a higher resultant SNR [20]. Most coils are tuned and matched once to a standardized phantom or specific region of anatomy. Some in house manufactured surface coils may include a variable capacitor that can be adjusted based on the load, however most commercial coils lack this feature, and furthermore, would be impractical for phased arrays. There has been work in tuning circuits for single and multi coil applications however they are limited [5, 21, 22]. The coil impedance match is ideal when loaded by the phantom/body part to be probed. Once the coil is loaded by something else, whether it be a different phantom or different region of the body, or a different person altogether, the match will suffer for it. The S11 parameter is a measure of the coil match, where the lower the S11 (in dB) the better. Based on S11 measurements (Table 1) the fractal coil was more robust and insensitive to anatomical region compared to the circular coil. However, this advantage came at the cost of a reduced Qratio. Thus, fractal-based coils may offer a robust solution to impedance matching (at a cost) for varied anatomy when manual matching is not an option (i.e. phased array configurations). The S11 values would need to be explored further in a larger phased array configuration.
When surface coils are arranged in arrays they begin to interact and interfere with each other via geometric coupling, resulting in an equivalent mutual inductance between coils. It is not possible to eliminate between-coil mutual inductance in phased arrays. However, a goal is to ideally minimize this problem in order to maximize SNR [5]. As individual coil elements are moved towards each other and begin to overlap, the mutual inductance effect worsens. As the overlap continues the coils will reach an optimal overlap that eliminates the mutual inductance, where this optimal configuration varies based on geometry [23]. Optimal overlaps are well documented for coil array elements for standard geometries, however it can be a challenge to adhere to those restrictions when trying to optimize coil coverage over a set area. The S21 network parameter of a coil network indicates the mutual inductance between two coils. When two coils experience coupling it appears as a split S21 peak and the peaks will merge into one when the mutual inductance is minimized. The S21 measurements made (Figure 4) between the pair of circular coils, and the pair of fractal coils, revealed that the fractal pair allowed for more configurations and spacings, such that the mutual inductance between coils could be minimized or ideally eliminated. It was also observed that the fractal pair was less sensitive to coil overlap as seen by less profound S21 peak splitting which could allow for increased error when arranging large numbers of coils in array configurations.
The homogeneity of the coil’s B1+ field is also essential in maximizing image SNR. The SNR is related to the sine of the flip angle, and the flip angle is related directly to the B1+ field strength. In order to maximize signal from a sample, the flip angle needs to be 90°, assuming adequate T1 recovery time is permitted. This also requires a spatially homogeneous B1+ field across the sample as well. It is well known that surface coils produce inherently heterogeneous fields, and any increase in homogeneity would be beneficial to increasing SNR [4]. Measured B1+ field maps were created (Figure 5) for both circular and fractal coils, and field homogeneity was compared. The standard deviation of the field strength over each map was used as a metric for homogeneity, where the lower the standard deviation the higher the homogeneity (Table 3). Over all the maps of the circular coil had a lower standard deviation, indicating a more homogeneous field compared to the fractal coil. However, these maps were noisy even after averaging over a 10 mm thick slice. This made homogeneity assessment over a volume challenging. Thus, a 3D volume was imaged and signal intensity variation across several ROIs inside the coil FOV were used as a B1+ field homogeneity metric (Figure 6). For the experimentally determined data, across all five ROIs selected, the circular coil had lower signal variation compared to the fractal coil, based on ROI standard deviation measurements. Again, lower standard deviation within an ROI indicates a more homogeneous field, corroborating the B1+ field map findings. The 3D volume was also used to create a plot of signal intensity versus distance from the coil plane, to visualize axial homogeneity (Figure 7). Surface coils have reasonable homogeneity at approximately one radius from the coil plane after which the signal uniformity decreases rapidly (with distance). The fractal coil signal drops faster with distance which also supports the same conclusion as the perpendicularly sliced B1+ map that the circular coil produces a more homogeneous field compared to the same diameter fractal coil.
When comparing the simulation results to the experimental there are some differences that should be noted. Interestingly in the simulations, the fractal coil produced a higher mean field over the ROIs (Figure 6) and this discrepancy was reduced when power was compensated for. This can be explained by the fact that the fractal’s field, as can be seen in Figure 5, is more concentrated into a smaller FOV, whereas the circular coil’s field is more dispersed over a larger area. And so experimentally due to the MNS prescan (the fractal coil required less power than the circular coil), the coils produced the same field strength at the surface of the phantom and so the mean field strength’s experimentally are quite similar. This same phenomenon can be seen in Figure 7 as well, where in simulation the fractal coil produces a stronger field closer to the coil. As the ROI increases from 25 to 45 mm, the means of the coils at shallower depths converge, again confirming that the fractal coil’s FOV is smaller with a field that is more concentrated to the center of the slice. And then again since the MNS Prescan calibrates the power such that the coils give equal field strength, the curves for the experimental data in Figure 7 are essentially the same mean value.
The main similarity between the simulated magnetic fields and the experimental data is that the circular coil consistently had a lower standard deviation meaning higher homogeneity. However, it is important to note that since it’s been determined that the FOV’s of the two coils are different, it may be of some interest to investigate other ROI’s of different shapes and sizes to more accurately deduce if the circular coil has a more homogeneous field for all applications.
SNR was calculated from the same 3D volume, over the same five ROIs as described above. Aligning with expectations that the coil with the more homogeneous B1+ field would provide a higher SNR, the circular coil produced a higher SNR measurement across all ROIs used. While this result is the opposite to our hypothesis there are still potential benefits to a fractal surface coil that deserve exploration. Sodium has only one resonance peak in vivo, but homogeneity over a wider excitation bandwidth was not explored as it is not necessary for sodium. As a fractal geometry consists of self-similar elements, each individual element of the whole can radiate as its own antenna, metaphorically. In practicality what this means is the single element fractal antenna can have a wider bandwidth than a non-fractal antenna, or even be multi-band [8, 10, 12]. A wider bandwidth could improve the spectral homogeneity of the generated B1+ field. Improved transmit homogeneity would be beneficial for imaging nuclei with wide spectral bandwidths such as 13C, 19F and 31P, especially when chemical shift imaging of these nuclei is being attempted.
In conclusion we found that, although a Koch snowflake shaped surface coil did not provide improved SNR or spatial homogeneity, the largest potential benefit is with reduced mutual inductance and robust impedance matching if implemented in phased array configurations. Phased array coils almost always provide higher SNR than their surface coil counterparts [24–26]. They can accelerate acquisitions via parallel imaging [27, 28] or compressed sensing techniques [29]. Multi-element arrays are a challenge to design and construct as geometric coupling plays a large role in the ability of the coil to function properly. There have been attempts to create unique geometries of elements to reduce this cross-talk and mutual inductance [30], but we believe the Koch snowflake would offer a more robust solution. As shown by the measured S21 parameters, the fractal design allows for more latitude when it comes to positioning individual elements over a surface, and provides minimal mutual inductance between a pair of coils. Another challenge facing phased array coils is that they are a challenge to manually rematch with each scan, and is seldom, if ever, done. The ability of a fractal design RF coil to provided a lower S11 over varying loads could also improve the signal transfer to the system, boosting SNR. Thus, further exploration into larger array fractal-based phased configurations, compared to arrays of circular coils, is warranted.
Data Availability Statement
The raw data supporting the conclusion of this article will be made available by the authors, without undue reservation.
Author Contributions
All authors listed have made a substantial, direct, and intellectual contribution to the work and approved it for publication.
Funding
Funding was provided through a Natural Sciences and Engineering Research Council (NSERC) Canada NSERC Discovery Grant (RGPIN-2017-06318) to MN.
Conflict of Interest
The authors declare that the research was conducted in the absence of any commercial or financial relationships that could be construed as a potential conflict of interest.
Publisher’s Note
All claims expressed in this article are solely those of the authors and do not necessarily represent those of their affiliated organizations, or those of the publisher, the editors and the reviewers. Any product that may be evaluated in this article, or claim that may be made by its manufacturer, is not guaranteed or endorsed by the publisher.
References
2. Madelin G, Regatte RR. Biomedical Applications of Sodium Mri In Vivo. J Magn Reson Imaging (2013) 38:511–29. doi:10.1002/jmri.24168
3. Berendsen HJC, Edzes HT. The Observation and General Interpretation of Sodium Magnetic Resonance in Biological Material. Ann NY Acad Sci (1973) 204:459–85. doi:10.1111/j.1749-6632.1973.tb30799.x
4. Mispelter J, Lupu M, Briguet A. NMR Probeheads for Biophysical and Biomedical Applications. London, UK: Imperial College Press (2015).
5. Gruber B, Froeling M, Leiner T, Klomp DWJ. Rf Coils: A Practical Guide for Nonphysicists. J Magn Reson Imaging (2018) 48:590–604. doi:10.1002/jmri.26187
7. Lauwerier H, Gill-Hoffstadt S. Fractals: Endless Repeated Geometrical Figures. Princeton, NJ: Princeton University Press (1991).
8. Cohen N. Fractal Antenna Applications in Wireless Telecommunications. In: Professional Program Proceedings: Electronic Industries Forum of New England. IEEE (1997). p. 43–9.
10. Cohen N. Tuning Fractal Antennas and Fractal Resonators. United States of America: US6104349 (2000).
11. Gianvittorio JP, Rahmat-Samii Y. Fractal Antennas: A Novel Antenna Miniaturization Technique, and Applications. IEEE Antennas Propag Mag (2002) 44:20–36. doi:10.1109/74.997888
12. Gianvittorio JP, Rahmat-Samii Y. Fractal Element Antennas: a Compilation of Configurations with Novel Characteristics. In: IEEE Antennas and Propagation Society International Symposium. Transmitting Waves of Progress to the Next Millennium. 2000 Digest. Held in Conjunction with: USNC/URSI National Radio Science Meeting (Cat. No.00CH37118). IEEE (2000). p. 1688–91.
13. Frass-Kriegl R, Hosseinnezhadian S, Poirier-Quinot M, Laistler E, Ginefri J-C. Multi-loop Radio Frequency Coil Elements for Magnetic Resonance Imaging: Theory, Simulation, and Experimental Investigation. Front Phys (2020) 7:16. doi:10.3389/fphy.2019.00237
14. Ha S, Nalcioglu O, Roeck WW. Fractal RF Coils for Magnetic Resonance Imaging. United States of America: US20150048828A1 (2015).
15. Lemus OMD, Konyer NB, Noseworthy MD. Micro-strip Surface Coils Using Fractal Geometry for 129Xe Lung Imaging Applications. In: Proceedings of the Joint Annual Meeting of ISMRM-ESMRMB; Paris, France. Concord, CA; ISMRM (2018).
16. Nowikow CE, Konyer NB, Yazdanbakhsh P, Noseworthy MD. Koch snowflake Fractal Rf Surface Coils to Improve 23na-Magnetic Resonance Imaging at 3t. In: Proceedings of the 36th Annual Scientific Meeting of ESMRMB; Rotterdam, Netherlands. Vienna, Austria; ESMRMB (2019).
17. Schulte RF, Sacolick L, Deppe MH, Janich MA, Schwaiger M, Wild JM, et al. Transmit Gain Calibration for Nonproton Mr Using the Bloch-Siegert Shift. NMR Biomed (2011) 24:1068–72. doi:10.1002/nbm.1657
18. Sacolick LI, Wiesinger F, Hancu I, Vogel MW. B1 Mapping by Bloch-Siegert Shift. Magn Reson Med (2010) 63:1315–22. doi:10.1002/mrm.22357
19. Beatty PJ, Nishimura DG, Pauly JM. Rapid Gridding Reconstruction with a Minimal Oversampling Ratio. IEEE Trans Med Imaging (2005) 24:799–808. doi:10.1109/TMI.2005.848376
20. Fujita H, Zheng T, Yang X, Finnerty MJ, Handa S. Rf Surface Receive Array Coils: The Art of an Lc Circuit. J Magn Reson Imaging (2013) 38:12–25. doi:10.1002/jmri.24159
21. Venook RD, Hargreaves BA, Gold GE, Conolly SM, Scott GC. Automatic Tuning of Flexible Interventional Rf Receiver Coils. Magn Reson Med (2005) 54:983–93. doi:10.1002/mrm.20616
22. Reykowski A, Duensing R. A Wireless Digital Capacitor Module for Tuning Receive Coil Arrays. In: Proceedings of the 23rd Annual Meeting of ISMRM; Milan, Italy. Concord, CA; ISMRM (2014).
23. Keil B, Wald LL. Massively Parallel Mri Detector Arrays. J Magn Reson (2013) 229:75–89. doi:10.1016/j.jmr.2013.02.001
24. Bangerter NK, Kaggie JD, Taylor MD, Hadley JR. Sodium MRI Radiofrequency Coils for Body Imaging. NMR Biomed (2016) 29:107–18. doi:10.1002/nbm.3392
25. Roemer PB, Edelstein WA, Hayes CE, Souza SP, Mueller OM. The Nmr Phased Array. Magn Reson Med (1990) 16:192–225. doi:10.1002/mrm.1910160203
26. Hayes CE, Hattes N, Roemer PB. Volume Imaging with Mr Phased Arrays. Magn Reson Med (1991) 18:309–19. doi:10.1002/mrm.1910180206
27. Ohliger MA, Sodickson DK. An Introduction to Coil Array Design for Parallel Mri. Magn Reson Med (1999) 42:952–62. doi:10.1002/nbm.1046
28. Pruessmann KP, Weiger M, Scheidegger MB, Boesiger P. Sense: Sensitivity Encoding for Fast Mri. NMR Biomed (2006) 19:300–15. doi:10.1002/nbm.1042
29. Blunck Y, Kolbe SC, Moffat BA, Ordidge RJ, Cleary JO, Johnston LA. Compressed Sensing Effects on Quantitative Analysis of Undersampled Human Brain Sodium Mri. Magn Reson Med (2020) 83:1025–33. doi:10.1002/mrm.27993
Keywords: radiofrequency coils, fractals, sodium-23, magnetic resonance imaging, koch, B1+ mapping
Citation: Nowikow CE, Polak P, Konyer NB, Nikolova NK and Noseworthy MD (2021) Network and Field Analysis of Koch Snowflake Fractal Geometry Radiofrequency Coils for Sodium MRI. Front. Phys. 9:697104. doi: 10.3389/fphy.2021.697104
Received: 18 April 2021; Accepted: 21 July 2021;
Published: 03 August 2021.
Edited by:
Simone Angela S. Winkler, Cornell University, United StatesReviewed by:
Elizaveta Motovilova, Department of Radiology, United StatesJoseph Vincent Rispoli, Purdue University, United States
Copyright © 2021 Nowikow, Polak, Konyer, Nikolova and Noseworthy. This is an open-access article distributed under the terms of the Creative Commons Attribution License (CC BY). The use, distribution or reproduction in other forums is permitted, provided the original author(s) and the copyright owner(s) are credited and that the original publication in this journal is cited, in accordance with accepted academic practice. No use, distribution or reproduction is permitted which does not comply with these terms.
*Correspondence: Michael D. Noseworthy, bm9zZXdvckBtY21hc3Rlci5jYQ==
 Cameron E. Nowikow
 Paul Polak1,2
 Michael D. Noseworthy