 Shu Guo
 Xiaoqi Chen
 Yimeng Liu1
 Tao Liu
- 1School of Reliability and Systems Engineering, Beihang University, Beijing, China
- 2National Key Laboratory of Science and Technology on Reliability and Environmental Engineering, Beijing, China
- 3School of Biological Science and Medical Engineering, Beihang University, Beijing, China
- 4Beijing Advanced Innovation Center for Big Data-Based Precision Medicine, Beijing, China
- 5Beijing Advanced Innovation Center for Biomedical Engineering, Beijing, China
- 6Hefei Innovation Research Institute, Beihang University, Hefei, China
The brain network is one specific type of critical infrastructure networks, which supports the cognitive function of biological systems. With the importance of network reliability in system design, evaluation, operation, and maintenance, we use the percolation methods of network reliability on brain networks and study the network resistance to disturbances and relevant failure modes. In this paper, we compare the brain networks of different species, including cat, fly, human, mouse, and macaque. The differences in structural features reflect the requirements for varying levels of functional specialization and integration, which determine the reliability of brain networks. In the percolation process, we apply different forms of disturbances to the brain networks based on metrics that characterize the network structure. Our findings suggest that the brain networks are mostly reliable against random or k-core-based percolation with their structure design, yet becomes vulnerable under betweenness or degree-based percolation. Our results might be useful to identify and distinguish brain connectivity failures that have been shown to be related to brain disorders, as well as the reliability design of other technological networks.
Introduction
Network reliability measures the ability of a network to perform prescribed functions against disturbance. Whether it is a power grid, a transportation network, a brain network, or other functional networks, the losses caused by network failures are huge. The northeast blackout of 2003 in North America, with an estimated 50 million people affected [1], was a large-scale power grid paralysis due to a line trip. And traffic congestions due to network failure usually generate substantial costs every year, together with traffic accidents and disasters [2]. Recent studies have demonstrated that the structural properties of the network largely determine system reliability and resilience under various damage [3–5]. This is also true for brain networks, which are the critical infrastructure for complex biological systems. Many brain disorders, such as Alzheimer disease (AD), amyotrophic lateral sclerosis (ALS), and schizophrenia, etc., have been found related to network connectivity alterations [6], causing physical or psychological pain to patients and their families. Network reliability is of great significance to understand the design principle and failure mechanism of these complex systems.
Accordingly, the network reliability of technological networks is mainly focused on, such as transportation networks, communication networks, and power grids [7]. The study of network reliability involves two-terminal [8], k-terminal [9, 10], and all-terminal [11, 12] network connectivity, which are defined as the probability that a subset of nodes are able to communicate with each other, and measured as integrity for many networks without distinguishing specific function. In addition, dedicated evaluation methods of reliability are proposed to address specific characteristics of the network. In the transportation network, network reliability mainly considers road destination reachability and commuter travel time. For example, connectivity reliability (CR) refers to the probability of network nodes staying connected, which is a static evaluation of the road network structure [13]. Travel time reliability (TTR), or congestion delay index (CDI), considers the probability of travel time from origin to a destination within a specified interval. And capacity related reliability (CRR) measures the probability that the traffic capacity can support a certain level of traffic demand [14]. In communication networks, note that CRR is also used in evaluating network reliability, with heterogeneous link capacities [15], to sustain the transmission requirements. Diameter-constrained reliability (DCR) is another probability metric about the maximum delay requirements after random failures, which limits the terminal set and path length [16]. In power grids, indicators for measuring network reliability proposed by the European Network of Transmission System Operators for Electricity (ENTSOE) [3] include energy not supplied (ENS), which is an estimation of the supply of energy that final consumers cannot obtain due to incidents. Total loss of power (TLP) is a measure of generation shortfall. And restoration time (RT) refers to the time it takes for the system to recover from the disturbance. The aforementioned research methods of network reliability have similarity to some extent: based on probability tools, they concern the state or efficiency of operative path “connectivity.”
In this paper, we focus on the reliability of the brain network. The anatomic connections between the cerebral cortex regions form the structural network on which the neural activities unfold. Functional networks are formed by the dynamical interaction of neural activities among cortical areas [17]. At present, many studies aim at the structural and functional characteristics of brain networks [18], which establish anatomical or functional correlations, calculate features with neurological significance, and reveal the organization principles or operating rules of the brain from the unique perspective of complex networks. The organization of a structure and function network is interdependent. The topology, synchronization, and other dynamic properties of functional networks are strongly influenced by small world and other structural connectivity indicators. On the contrary, the dynamics can adjust the structure network topology in a slower timescale [19]. The coupling of the brain structure and functional network may lead to cascading failure between the two networks, which can be summarized by a universal model [20]. For example, in human brain networks [6], densely connected modules are formed by geometrically close neural elements, promoting the specific function of the local area. And the formation of long-range connections between these modules promotes the scheduling and integration of global function. It is suggested that this “modularity” or “integration” nature changes in the brain connectome with neuropsychiatric disorder. Functional separation refers to the processing of neurons between functional related areas in a community. There are two kinds of integration processes in the network, one is based on the efficiency of global communication, the other is based on the ability of network integration of distributed information [21]. For example, AD patients appear to have modular reorganization in the resting state networks [22], and patients with schizophrenia appear to have reduced density of rich club connections [23], which play a significant role in brain integrative processes, etc. These studies reflect that fact that brain disorders are also strongly related to network structural reliability.
Here, we introduce the methods of engineering network reliability into brain network analysis and provide information on how the structural features affect the reliability, aiming at the failure mode of the brain network through the percolation method [24]. The percolation theory [25, 26] is originally used for the diffusion of forest fires or the distribution of oil and gas in porous stones. It has successfully been applied to describe a large variety of natural systems, such as the complex Earth system [27]. It is generalized for the shift of the network state between connected and disconnected at a critical point. We suppose that the critical state represents some inherent properties of the brain network, including the vulnerability of the brain network to varying degrees of external damage. Our study of the percolation process guides us to locate the vulnerable point that causes brain disorder, determine the stage of brain disease, and identify possible common characteristics of different brain disease manifestations.
Structure of the Brain Network
To decompose the structure of the network intuitively, we show community topology of structural brain networks of different species in Figure 1, including fly, cat, mouse, macaque, and human. This community structural feature is shared by all of these brain networks. Comparatively, the cat and macaque networks belong to small-scale networks (dozens of nodes, hundreds of edges), the human network belongs to medium-scale networks (hundreds of nodes, thousands of edges), and the fly and mouse networks belong to large networks (∼tens of thousands of edges). The number of network nodes and edges is shown in Table 1. This may be due to the different anatomical resolution of different species. Note that the mouse network is densely connected, while the human network shows a clearer modular pattern with a few connections between different communities. These structural properties can determine the reliability and failure mode of the brain network to some extent.
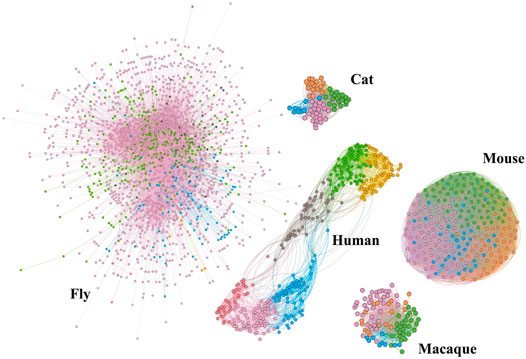
FIGURE 1. Community topology of brain structural networks for different species, including cat, fly, human, mouse, and macaque. Among them, the networks of cat, fly, mouse, and macaque are from the Network Repository [28] http://networkrepository.com.
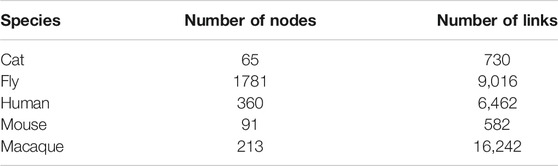
TABLE 1. Overview of brain structure networks in different species.
Next, we calculate the distributions of topological features to compare different species networks, from micro and macro perspectives (shown in Figure 2), as well as the meso perspective (shown in Figure 3). Degree defines the number of adjacent edges belonging to a given node from a micro perspective. The degree
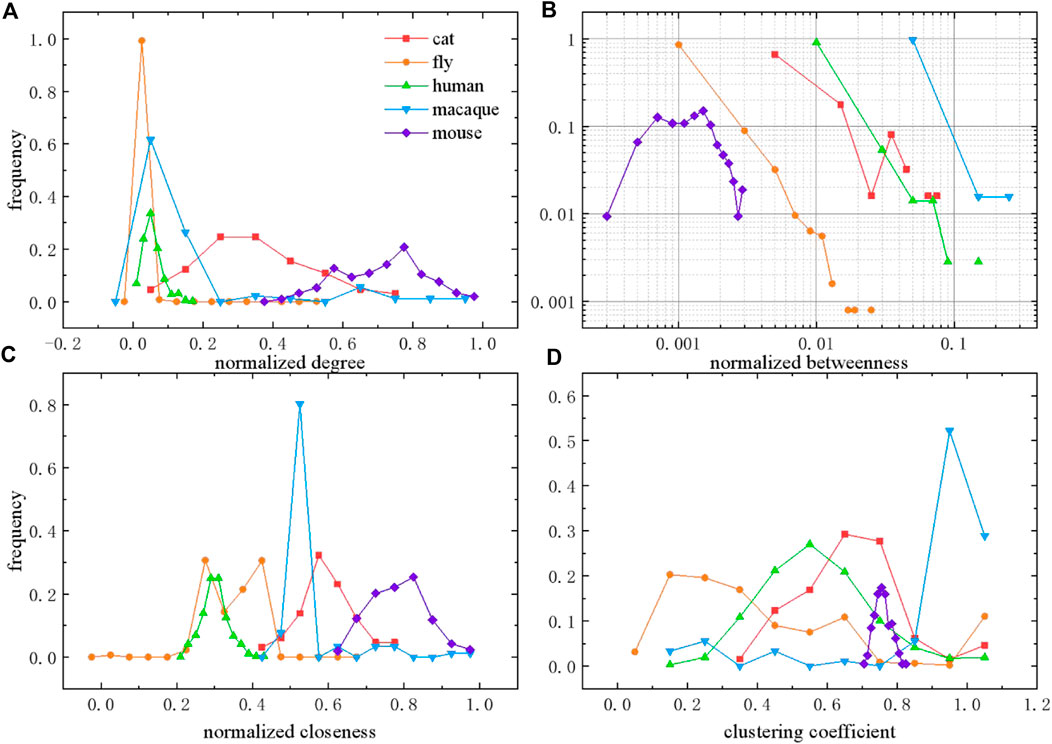
FIGURE 2. Distributions of topological features in different species brain networks. (A) Degree distribution normalized by
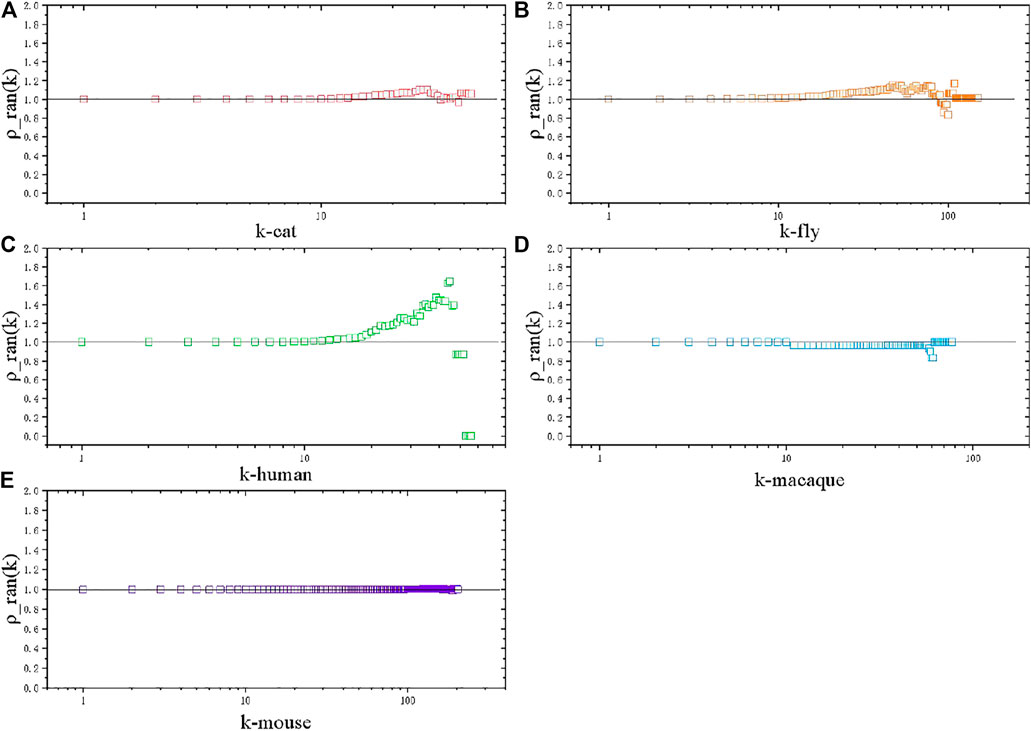
FIGURE 3. Rich club coefficient, normalized by the null model. (A) Cat brain network. (B) Fly brain network. (C) Human brain network. (D) Macaque brain network. (E) Mouse brain network.
As shown in Figure 2A, degree is normalized by
where
where
where node
In the case of the meso perspective, we calculate the rich club coefficient of these species networks with normalization to the null model [29]. The rich club phenomenon, existing in scientific collaboration networks and air transportation networks, is also studied to understand global efficiency in both unweighted and weighted structural brain networks of the human connectome [30], while brain network comparison with other species are rarely involved. Rich club coefficient
Considering that nodes with high degrees have higher probability of interconnection with each other by definition, we usually need a null model to obtain normalized rich club coefficient
The null model is created by performing a link shuffle to randomize the original network, keeping the same degree distribution.
Percolation on the Brain Network
In this section, we perform different types of percolation analysis, including degree-based percolation, betweenness-based percolation,
The giant component
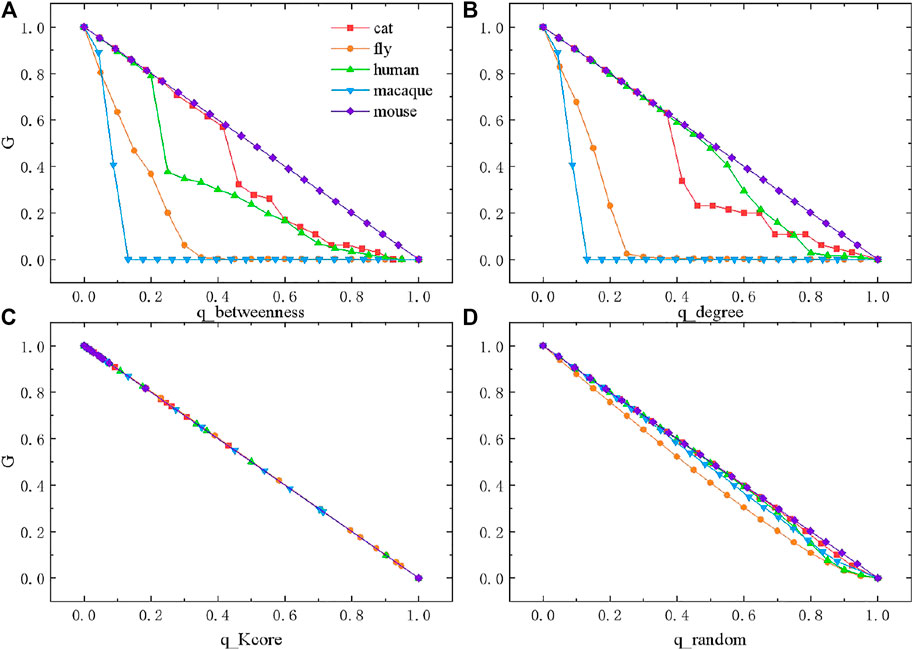
FIGURE 4. Percolation on species brain networks under four forms of disturbances. (A) Percolation based on betweenness. (B) Percolation based on degree. (C) Percolation based on
Next, we perform
In contrast to the above three percolation methods based on the network structural features, we also perform random percolation (Figure 4D). Without considering network topology, we randomly remove a fraction of nodes from the network at each step. Surprisingly, the change of
Conclusion
We perform network reliability analysis on a brain network, which is the critical infrastructure for biological intelligence. Network reliability pursues the ability to meet the functional requirements in a specific operating environment. Therefore, the fragility of the network under disturbance is particularly important, that a network with high-reliability has the ability to offset the impact of disturbances and strives to maintain connectivity. Here, we pay attention to the global and local connectivity of the brain network, whose loss may cause biological dysfunction as brain disorders. We analyze the brain networks of different species, including cat, fly, human, mouse, and macaque, and explore similarities and differences in structural features and percolation patterns, which may reflect the causality from varying levels of functional specialization and integration.
While the properties of species brain networks are formed during evolution, one of the core tasks is to ensure high reliability, against various disturbances. High reliability of the network suggests balance between global connectivity and local connectivity. We find that brain networks are mostly reliable against random or
Data Availability Statement
Publicly available datasets were analyzed in this study. This data can be found here: http://networkrepository.com/bn.php.
Ethics Statement
Ethical review and approval was not required for the animal study because our data comes from a public data set.
Author Contributions
SG, XQC, and YML performed the analysis. XQC validated the analysis and drafted the manuscript. RK and TL reviewed the manuscript. DQL designed the research. All authors have read and approved the content of the manuscript.
Funding
We acknowledge support from National Natural Science Foundation of China Grants 71822101, 71890973/71890970, 61961146005, and 71771009.
Conflict of Interest
The authors declare that the research was conducted in the absence of any commercial or financial relationships that could be construed as a potential conflict of interest.
References
2. Iida Y. Basic Concepts and future directions of road network reliability analysis. Atr (1999) 33(2):125–34. doi:10.1002/atr.5670330203
3. Martinez-Anido CB, Bolado R, De Vries L, Fulli G, Vandenbergh M, Masera M. European power grid reliability indicators, what do they really tell? Electric Power Syst Res (2012) 90:79–84.
4. Moreno Y, Nekovee M, Vespignani A. Efficiency and reliability of epidemic data dissemination in Complex networks. Phys Rev E (2004) 69(5):055101. doi:10.1103/physreve.69.055101
5. Zeng G, Li D, Guo S, Gao L, Gao Z, Stanley HE, et al. Switch between Critical percolation modes in City traffic dynamics. Proc Natl Acad Sci USA (2019) 116(1):23–8. doi:10.1073/pnas.1801545116
6. Van den Heuvel MP, Sporns O. A Cross-disorder Connectome landscape of brain dysconnectivity. Nat Rev Neurosci (2019) 1.
7. Duan D-L, Ling X-D, Wu X-Y, Zhong B. Reconfiguration of distribution network for loss reduction and reliability improvement based on an enhanced genetic algorithm. Int J Electr Power Energ Syst (2015) 64:88–95. doi:10.1016/j.ijepes.2014.07.036
8. Ramirez-Marquez JE, Coit DW. A Monte-Carlo simulation approach for approximating multi-state two-terminal reliability. Reliability Eng Syst Saf (2005) 87(2):253–64. doi:10.1016/j.ress.2004.05.002
9. Hardy G, Lucet C, Limnios N. K-terminal network reliability measures with binary decision diagrams. IEEE Trans Rel (2007) 56(3):506–15. doi:10.1109/tr.2007.898572
10. Yeh F-M, Lu S-K, Kuo S-Y. OBDD-based evaluation of k-terminal network reliability. IEEE Trans Reliability (2002) 51(4):443–51.
11. Sharafat AR, Ma'rouzi OR. All-terminal network reliability using recursive truncation algorithm. IEEE Trans Rel (2009) 58(2):338–47. doi:10.1109/tr.2009.2020120
12. Srivaree-Ratana C, Konak A, Smith AE. Estimation of all-terminal network reliability using an artificial neural network. Comput Operations Res (2002) 29(7):849–68. doi:10.1016/s0305-0548(00)00088-5
13. Bell MG, Iida Y. Transportation Network analysis. New York: Chichester (1997). doi:10.1002/9781118903032
14. Chen A, Yang H, Lo HK, Tang WH. A Capacity related reliability for transportation networks. Atr (1999) 33(2):183–200. doi:10.1002/atr.5670330207
15. Soh S, Rai S. An efficient Cutset approach for evaluating Communication-network reliability with heterogeneous link-Capacities. IEEE Trans Rel (2005) 54(1):133–44. doi:10.1109/tr.2004.842530
16. Cancela H, Petingui L. Diameter Constrained network reliability: exact evaluation by factorization and bounds. Reportes Técnicos (2001) 01-03.
17. Honey CJ, Kötter R, Breakspear M, Sporns O. Network structure of Cerebral Cortex shapes functional Connectivity on multiple time scales. Proc Natl Acad Sci (2007) 104(24):10240–5. doi:10.1073/pnas.0701519104
18. Rubinov M, Sporns O. Complex network measures of brain Connectivity: uses and interpretations. Neuroimage (2010) 52(3):1059–69. doi:10.1016/j.neuroimage.2009.10.003
19. Bullmore E, Ed, and O Sporns. Complex brain networks: graph theoretical analysis of structural and functional systems. Nat Rev Neurosci (2009) 10(3):186–98. doi:10.1038/nrn2575
20. Duan D, Lv C, Si S, Wang Z, Li D, Gao J, et al. Universal behavior of Cascading failures in interdependent networks. Proc Natl Acad Sci USA (2019) 116(45):22452–7. doi:10.1073/pnas.1904421116
21. Sporns O. Network attributes for segregation and integration in the human brain. Curr Opin Neurobiol (2013) 23(2):162–71. doi:10.1016/j.conb.2012.11.015
22. Chen G, et al. Modular reorganization of brain resting state networks and its independent validation in Alzheimer's disease patients. Front Hum Neurosci (2013) 7:456. doi:10.3389/fnhum.2013.00456
23. Van den Heuvel MP, Sporns O, Collin G, Scheewe T, Mandl RCW, Cahn W, et al. Abnormal rich Club organization and functional brain dynamics in schizophrenia. JAMA psychiatry (2013) 70(8):783–92. doi:10.1001/jamapsychiatry.2013.1328
24. Li D, Zhang Q, Zio E, Havlin S, Kang R. Network reliability analysis based on percolation theory. Reliability Eng Syst Saf (2015) 142:556–62. doi:10.1016/j.ress.2015.05.021
25. Stauffer D, Aharony A. Introduction to percolation theory. United Kingdom: Taylor & Francis (2018). doi:10.1201/9781315274386
26.A Bunde, and S Havlin, editors. Fractals and Disordered Systems. Germany: Springer Science & Business Media (2012).
27. Fan J, Meng J, Ludescher J, Chen X, Ashkenazy Y, Kurths J, et al. Statistical physics approaches to the Complex Earth system. Phys Rep (2020) 8:961–84. doi:10.1016/j.physrep.2020.09.005
28. Rossi R, Ahmed N. The network data repository with interactive graph analytics and visualization. in Twenty-Ninth AAAI Conference on Artificial Intelligence; Austin, TX, United StatesAAAI Press (2015).
29. Colizza V, Flammini A, Serrano MA, Vespignani A. Detecting rich-Club ordering in Complex networks. Nat Phys (2006) 2(2):110–5. doi:10.1038/nphys209
30. Van den Heuvel MP, Sporns O. Rich-club organization of the human Connectome. J Neurosci (2011) 31(44):15775–86. doi:10.1523/jneurosci.3539-11.2011
31. McAuley JJ, da Fontoura Costa L, Caetano TS. Rich-club phenomenon across Complex network hierarchies. Appl Phys Lett (2007) 91(8):084103. doi:10.1063/1.2773951
32. Zhou S, Mondragón RJ. The rich-Club phenomenon in the Internet topology. IEEE Commun Lett (2004) 8(3):180–2. doi:10.1109/lcomm.2004.823426
33. Fornito A, Zalesky A, Breakspear M. The Connectomics of brain disorders. Nat Rev Neurosci (2015) 16(3):159–72. doi:10.1038/nrn3901
Keywords: Brain structural network, percolation, reliability, rich club, animal species
Citation: Guo S, Chen X, Liu Y, Kang R, Liu T and Li D (2021) Percolation Analysis of Brain Structural Network. Front. Phys. 9:698077. doi: 10.3389/fphy.2021.698077
Received: 20 April 2021; Accepted: 03 June 2021;
Published: 20 July 2021.
Edited by:
Dongli Duan, Xi'an University of Architecture and Technology, ChinaReviewed by:
Chen Feng, Ocean University of China, ChinaJingfang Fan, Beijing Normal University, China
Copyright © 2021 Guo, Chen, Liu, Kang, Liu and Li. This is an open-access article distributed under the terms of the Creative Commons Attribution License (CC BY). The use, distribution or reproduction in other forums is permitted, provided the original author(s) and the copyright owner(s) are credited and that the original publication in this journal is cited, in accordance with accepted academic practice. No use, distribution or reproduction is permitted which does not comply with these terms.
*Correspondence: Xiaoqi Chen, Y2hlbnhxQGJ1YWEuZWR1LmNu