- 1School of Law, Central University of Finance and Economics, Beijing, China
- 2Ansteel Company Limited Cold-Rolling Silicon Steel Mill, Anshan, China
- 3School of Finance, Zhongnan University of Economics and Law, Wuhan, China
- 4School of Computer Science and Engineering, Northwestern Polytechnical University, Xi’an, China
- 5School of Law, Xinjiang University, Urumqi, Xinjang
Over the recent years, the study of time series visualization has attracted great interests. Numerous scholars spare their great efforts to analyze the time series using complex network technology with the intention to carry out information mining. While Visibility Graph and corresponding spin-off technologies are widely adopted. In this paper, we try to apply a couple of models derived from basic Visibility Graph to construct complex networks on one-dimension or multi-dimension stock price time series. As indicated by the results of intensive simulation, we can predict the optimum window length for certain time series for the network construction. This optimum window length is long enough to the majority of stock price SVG whose data length is 1-year. The optimum length is 70% of the length of stock price data series.
Introduction
Along with the big data era, time series widely exists in practice and is a popular data representation means, e.g., the stock price, the carbon price, white Gaussian noise, surface concentration ozone and etc. Specifically, time series is a sequence of data points represented in time order, while the time intervals between any consecutive points are always the same [1]. Due to the nonlinear and discrete properties, a bunch of analyzing approaches have been proposed [2]. Afterwards, complex network theory is developing rapidly [3] and applied to the analysis of time series data [1–9]. Hence, a technique, i.e., time series data visualization, and some improved versions, are developed by constructing complex networks from the initial data. Hence, sufficient analysis of the time series data can be performed accordingly.
Among those approaches, a technique, named Visibility Graph (VG), is widely adopted, and attracts the intensive interests [10]. This is initially proposed by Lacasa and his coworkers when investigating the time series data of robot movement [10]. Through VG, a corresponding complex network can be constructed, while the inherent properties and implied information of the original data can be preserved properly, such as Hurst coefficient, fractal properties [8, 11]. It is proved to be an efficient tool for the analysis of times series data [12–14]. Hence, the VG-based complex network and corresponding derivative theories are becoming a hot topic and various scholars have devoted their endless efforts into applying such theories into the various studies.
Initially, VG-based analysis mainly focuses on one-dimensional time series data. Recently, scholars start to investigate multiple time series data jointly to reveal inclined information. For instance, the authors in [10, 15] proposed a Multiplex Visibility Graphs (MVG) approach and conducted analysis of the surface concentration ozone, while complex networks are constructed for two time series data sets, i.e., the surface concentration ozone and the concentration of NO2 which are closely related with each other. Similarly, with the development of VG, a bunch of improved approaches have been proposed, such as sliding window-based Visibility Graph (SVG) [16], Multiplex Visibility Graph (MVG) [10, 15], Horizontal Visibility Graph (HVG) [17], and Limited Penetrating Visibility Graph (LPVG) [14, 18]. With the application of these approaches, it becomes easier for us to extract implied information from time series data.
Stock price time-series data is also one of the common time-series data. The analysis of stock price data, especially stock price trend prediction based on the analysis result, attracts the interests of various scholars [19, 20]. The authors in [20, 21] performed stock price forecasts and trend research study of stock price time-series data through machine learning approaches. While, we analyzed the stock price time-series data by complex network theory in which the corresponding complex network is constructed for stock time-series data, and relevant information can be studied accordingly. Here, we mainly adopt the SVG model to visualize the time series data of stock price. As revealed in [16], the appropriate window length for the analysis of different time series data sets varies. Hence, analyses of different stock price data are performed to determine the appropriate window length of SVG. Furthermore, corresponding multi-layer networks are constructed through MVG, then the correlations between time series data of multiple stock prices are thoroughly studied.
Model Description
Firstly, the VG and corresponding spin-off technologies are introduced. For VG, it is typically an undirected graph with the corresponding weight of each link equals to 1. For an original time series sequence, each data point is assigned an index indicating the time flag, i.e.,
1) If two data points A (
2) If two data points are not consecutive, i.e., a point C (
For any data point combination, the above criterion is applied to discriminate the existence of links, and the corresponding VG network can be derived accordingly which can be further indicated by an adjacent matrix. If a link exists between two data points, then the corresponding value in the adjacent matrix equals to 1; otherwise, it is 0. An illustrative example is shown in Figure 1A indicating the network construction process of a time series data set consisting of 10 points.

FIGURE 1. (A) An example of the network construction process through VG. (B–D) A network construction process through SVG. Here, the lines connecting the top of data columns indicate the existed links.
Sliding-window is widely applied in various areas and related algorithms are proved to be of high computational efficiency and able to reduce the required storage [22]. Hence, an improved method is developed as in [16] by introducing the sliding-window idea into the network constructing process of VG to improve construction efficiency. Because of sliding-window, the afore-mentioned criterion is only necessary to be applied between a data point and a certain point within the sliding-window. Thus, the necessary times of applying the above discriminate criteria will be reduced tremendously. As in [16], we suppose the time series data is composed of
1) Step 1: For the first
2) Step 2: The window moved forward by the distance of a data point, and a new data point enters the window. Thus, the sliding-window covers the new data point and the previously existed
3) Step 3: Repeat Step 2 until we reach the end of the time series data.
Examples are provided in Figure 1 which illustrates the construction process through VG and SVG with a window length of 4. For Figures 1B–D, the data points indicated by red columns are within the sliding-window, whereas those represented by blue columns are outside the sliding-window.
Accordingly, the computational complexity of SVG is largely determined by the required times of applying the discriminate criteria (fundamentally affected by the sliding-window length). For a time series consisting of
where
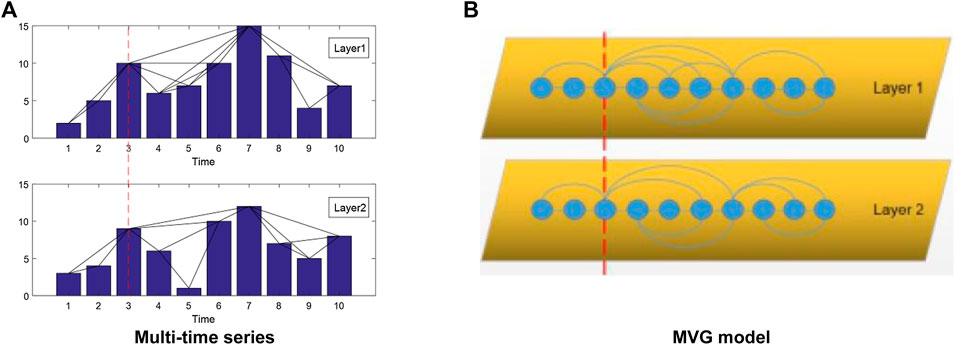
In this manuscript, we also study time series data sets of multiple stocks, thus the MVG is also introduced [15]. For MVG, there exists one time axis in common reflecting the varying of different types of data at the same time. Such types of data have inclined relationships which can be analyzed through calculating corresponding network parameters of the MVG. An example of MVG is provided as in Figure 2. As illustrated by Figure 3B, the 3rd data points on different layers seem to possess similar properties.
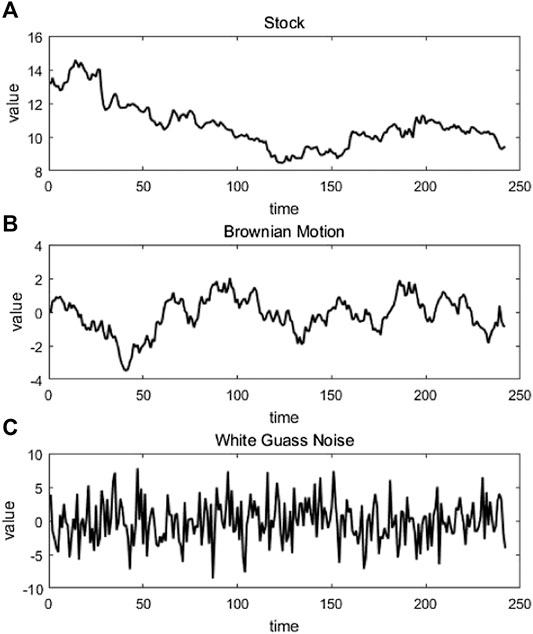
FIGURE 3. Three types of representative time series data. (A) stock, (B) Brownian motion, and (C) Guass noize.
As in [24], similar analysis can be performed to explore the implicit information of MVG. Here, two parameters are adopted aiming to investigate the interlayer information, i.e., Average Edge Overlap (AEO) and Interlayer Mutual Information (IMI) [25]. AEO is the average of the existence probabilities of a common link in all layers of the MVG which reflects the similarity of links on different layers (being denoted as ω). Corresponding value is calculated as
where the numerator indicates the total number of the appearance of the link between any two data points
Another metrics, i.e., Interlayer Mutual Information (IMI), is introduced to reflect the relationship between the degree distributions of different layers [25]. Here
where
Analysis of Stock Prices
In this section, we focus on analyzing the time series data of stock price through the afore-mentioned approaches. Three representative types of data are selected for illustrations. Figure 3A illustrates the time series data for the stock opening price of Ping An Bank Co., Ltd. consisting of a total number of 242 data points. For comparison, Figure 3B and Figure 3C indicate the data by adding Brownian Motion with Hurst coefficient of 0.5 and one-dimensional White Gaussian noise of 10 dB, respectively. For ease of reference, the data series are assumed to be of the same lengths. Among the three data sets, the transition of the data indicated by Figure 3A seems to be the smoothest; while the varying trend of the data indicated by Figure 3C is the most violent.
As afore-mentioned, networks obtained through SVG for different sliding-window lengths are likely to be of different properties. First, we investigated the relationship between the maximum degree of the obtained network and the sliding-window length with corresponding results being presented in Figures 4A–C, respectively. As illustrated, the maximum degree varies if a different sliding-window length is adopted. Whereas, once the sliding window length arrives at a certain threshold, the maximum degree maintains. However, for different types of data, the maximum degree varies. For the stock opening price of Ping An Bank Co., Ltd., the maximum degree is approximately 60, while the maximum degrees for data incorporating Brownian Motion and White Gaussian noise are 40 and 20, respectively. Furthermore, the corresponding velocity of convergence also varies. For the stock opening price of Ping An Bank Co., the maximum degree converges until
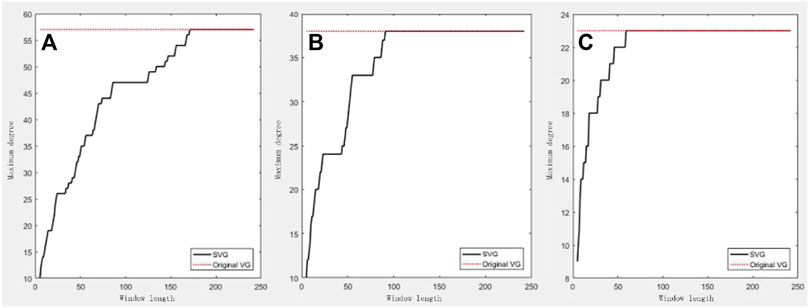
FIGURE 4. Illustrations of the relationships between the maximum degrees of the obtained complex networks through SVG and
The discrepancy of the maximum degree or the velocity of convergence can reflect the characteristics of different types of data. Compared with the other types of data, the transition of the stock opening price of Ping An Bank Co., Ltd. seems to be the smoothest; thus, it is likely for more data points to meet the discriminate criteria. Hence, the derived network is likely to possess a large maximum degree. In other words, it is highly likely for data points that are far from each other to be connected if the transition is smooth. Whereas, for the data with Gaussian white noise, the discriminate criteria condition is less likely to be met due to the sudden variance of the original data series. Thus, the maximum degree is relatively small. Reversely, if the maximum degree of an obtained network is relatively small, we can predict that the transition of the original data is sharp.
Previously, we mainly investigated the maximum degree of the obtained network, whereas, the optimum window length is also of great significance. Afterwards, we also investigated the relationship between the average degree of the obtained network and

FIGURE 5. Relationships between the average degree of the obtained complex network through SVG and the sliding-window length for different types (A) Original data; (B) Brownian Motion incorporated (C) Gaussian white noise considered.
The criteria of optimum
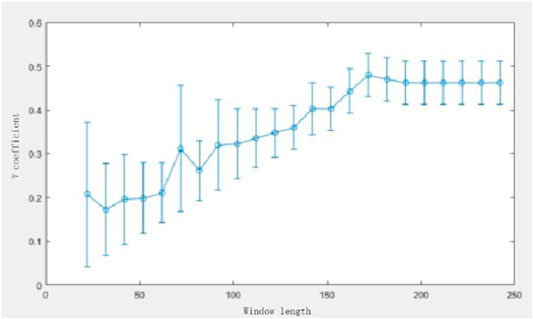
Moreover, the degree distribution of the obtained network is provided as in Figure 6. We see that the derived network for the stock opening price data follows power-law distribution while the relationship between γ and
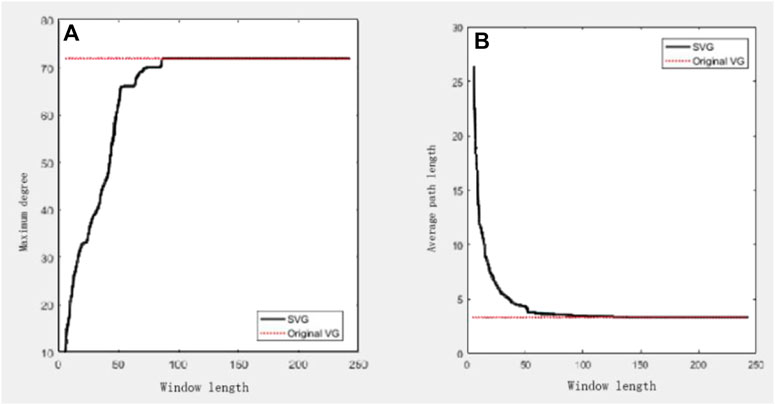
FIGURE 6. Illustration of the relationships between different parameters and window length for the stock opening price data of Shenzhen Cau Technology Co., Ltd. in 2018 (A) maximum degree; (B) maximum average length.
In order to derive a general conclusion, we also take the stock opening price data for 500 stocks from the A-share market. After sufficient analyses, we find that for the one-year-long data, a window length of 75% of the total data points is sufficient for the construction of the network. Here, sufficient length means it is safe and incurs no information loss, but it does not necessarily to be the optimum window length. After further analysis, we find that the optimum window length might be smaller than 60% of the total points for the data of some stocks. Another stock of Shenzhen Cau Technology Co., Ltd. is taken for an illustration. This company mainly focus on computer software and bio-pharmacy technology which is likely to be affected by market fluctuations. Hence, the stock price data is likely to fluctuate rapidly [17]. The optimum
Furthermore, we also performed an analysis of the stock opening price data for Ping An Bank Co. from 2018 to 2019. The relationships between incorporated parameters and window length are provided in Figure 8. As presented, for a two-year-long data, the optimum window length is approximately 378 (which is about 77.8% of the total data points) according to the above criteria of discriminating the optimum
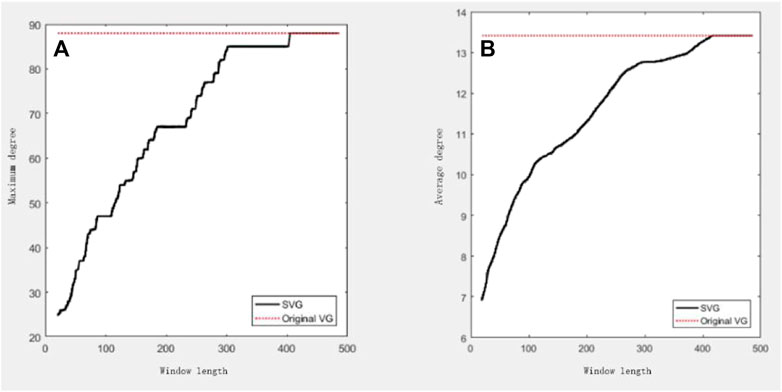
FIGURE 8. Illustration of the relationship between incorporated parameter and

TABLE 2. Optimum window length for constructing network through SVG for stock opening price of Ping An Bank Co. with different total data points.
As aforementioned, it is necessary to analyze multiple time series data to mine implicit information. Hence, experiments are conducted into the investigation of different stock price data by applying MVG. First, a two-layered network is constructed from the opening stock price and the highest stock price of Ping An Bank Co. Figure 9A illustrates the corresponding original time series data, while the obtained adjacent matrices are provided in Figures 9B,C. As presented in Figure 9A, the opening stock price and the highest stock price of Ping An Bank Co. are of a similar trend; this can also be observed by similar adjacent matrices of the networks for different data series.
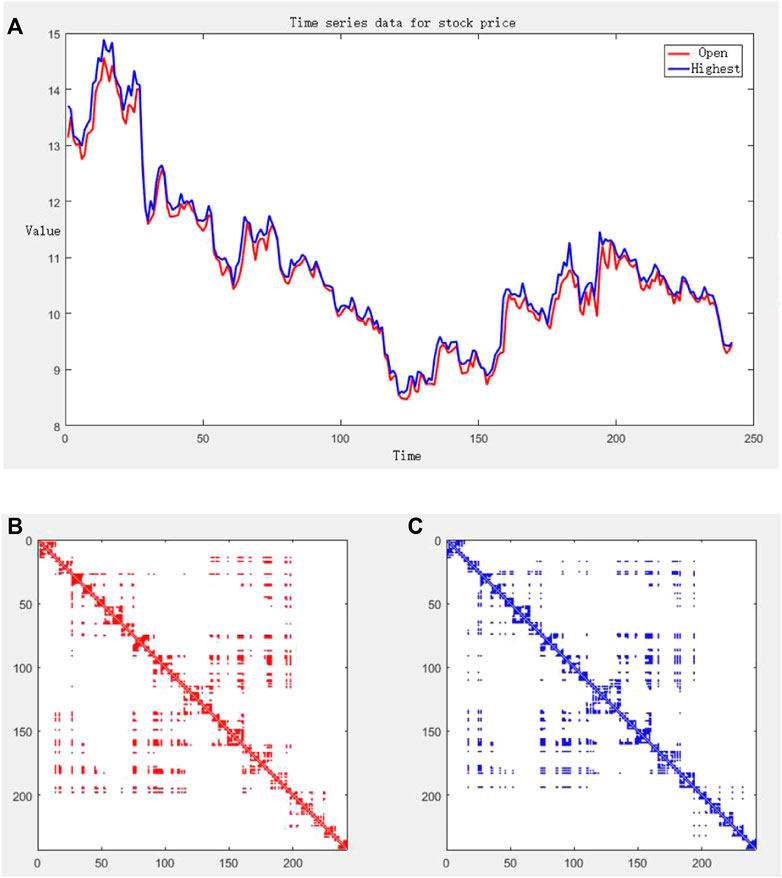
FIGURE 9. (A) The opening stock price and highest stock price of Ping An Bank Co.; (B) Adjacent matrices of the networks obtained through MVG for opening price; (C) Adjacent matrices of the networks obtained through MVG for highest price.
Regarding the obtained two-layered networks, the aforementioned parameters can be calculated, being listed as
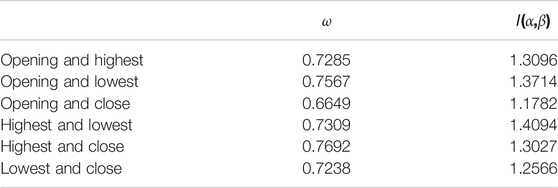
TABLE 3. Parameter obtained for the two layered networks for different combinations of time series data for Ping An Bank Co.
Moreover, we concern about the relationship between the stock prices of different stocks. Thus, we build an MVG network for the price data of different stocks. For example, we build a two-layer complex network based on the time-series of the opening prices of Ping An Bank and Vanke Co. Ltd. Class A. Similarly, Figure 10A below shows the opening stock price time-series data of two stocks in 2018, and Figures 10B,C shows the non-zero elements’ distribution of the complex network adjacency matrix generated by the opening price data of two stocks. After calculating the interlayer parameters of MVG, we can obtain ω = 0.6426 and I(α,β) = 1.2836 for the two-layer network. Such values almost reach the value of the two-layer network of surface ozone concentration and nitrogen dioxide concentration mentioned earlier. This means that the two stocks of Ping An Bank Co. and Vanke Co. Ltd. Class A have a relatively close relationship in the trend of stock data. More results are provided in Table 4. Obviously, the opening data is consistent with the above conclusion, while conclusions hold true for all the other price data. The close relationship between Ping An Bank Co. and Vanke Co. Ltd. A on the trend of stock data can be explained from the perspective of economics as the relationship between finance and real estate. The investment cost and investment income of the real estate industry are closely related to the financial environment, while the market in turn affects the economy and finance [15, 17]. Therefore, this mutual influence relationship in economics can be seen on the interlayer parameters of the two-layer MVG of stock prices.
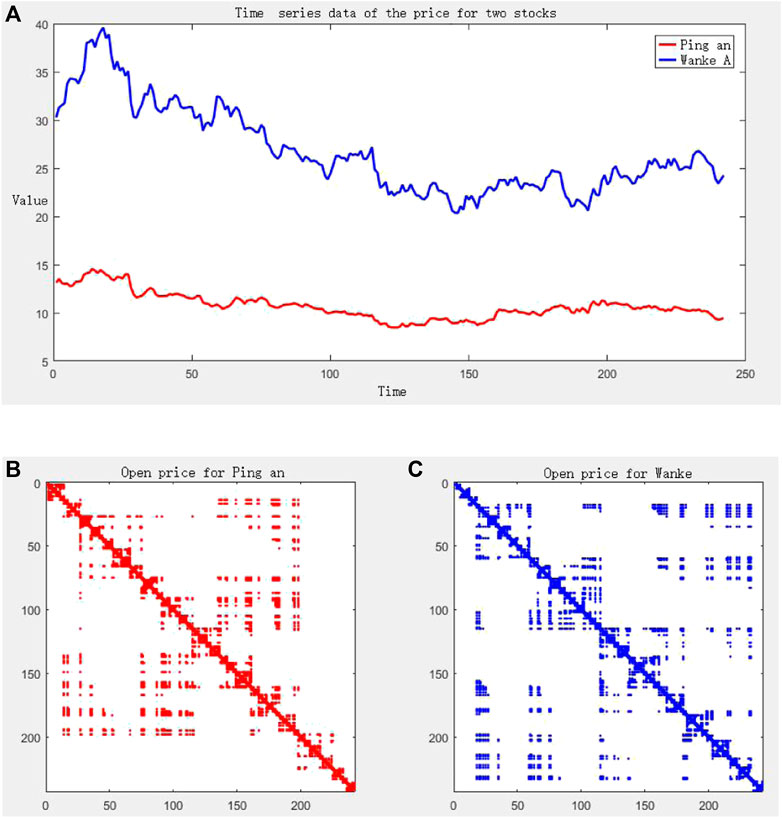
FIGURE 10. (A) Two stocks’ opening price time-series data; (B,C) denote the adjacent matrices of two-layer MVG network built with provided time-series data for Ping An Bank Co. and Vanke Co. Ltd., respectively.
In contrast, there exists no such strong correlation between Ping An Bank Co. and the biopharmaceutical stock Shenzhen CAU Technology Co. Ltd. Table 5 below shows the interlayer parameters of the two-layer MVG networks obtained for the opening prices of some other stocks and Ping An Bank Co.

TABLE 5. Parameters obtained for the two layered networks for different combinations of Ping An Bank Co. and four different stocks.
In Table 5, both Vanke Co. Ltd. A and Shenzhen Zhenye Co. Ltd. A are real estate stocks. According to the previous analysis, after building a two-layered MVG network for other stock data and Ping An Bank Co., the inter-layer parameters tend to indicate the tightness of the relationship between the two stocks. In contrast, Shenzhen CAU Technology Co. Ltd. is a biopharmaceutical stock, while Digital China Group Co. Ltd. is an Internet stock. They are not closely related to Ping An Bank Co. from the perspective of stock, and therefore we can see a relatively low correlation. After analyzing other stocks, we found similar conclusions. For example, after constructing a two-layer network with the opening price data of Changan Automobile stock and Daye Special Steel stock, the average edge overlap ω obtained equals 0.6489. This value almost even exceeds the ω value of the two-layer network constructed with Ping An Bank Co. and Vanke Co. Ltd. A. Daye Special Steel Co. Ltd. belongs to steel and metal shares, while Chongqing Changan Automobile Co. Ltd. belongs to industrial machinery shares. The industrial production of the latter depends on the raw materials provided by the former type of enterprises. It is the correlation between the two in the background of the stock industry that causes the inter-layer parameters of the two-layer network constructed by the two stock price data also show a relatively close correlation.
Complex Analysis
When I = 0, the inner loop executes n times; when I = 1, the inner loop executes n−1 times, and when I = n−1, the total execution times can be calculated as follows:
According to the second rule of derivation of large order o previously mentioned: only the highest order is reserved, so n2/2 is reserved. According to the third article, if the constant of this item is removed, then 1/2 of the time complexity of this code will be removed. Finally, the timev complexity of this code is O (n2).
Conclusion
Tvhrough VG and related techniques (SVG and MVG) for analyzing time-series data, we conducted intensive experiments on various stocks, and we also combine the knowledge of securities and social economics to obtain more meaningful research results. In this paper, we try to find out the size of the window length
Data Availability Statement
Publicly available datasets were analyzed in this study. This data can be found here: http://www.10jqka.com.cn/.
Author Contributions
XL: Visualization, Software, Computation, Drawing Writing, XY: Investigation, CL: Writing-Reviewing and Editing, HM: Visualization, Software, CL: Conceptualization, Methodology, Validation.
Conflict of Interest
XY was employed by Ansteel Company Limited Cold-Rolling Silicon Steel Mill.
The remaining authors declare that the research was conducted in the absence of any commercial or financial relationships that could be construed as a potential conflict of interest.
Publisher’s Note
All claims expressed in this article are solely those of the authors and do not necessarily represent those of their affiliated organizations, or those of the publisher, the editors and the reviewers. Any product that may be evaluated in this article, or claim that may be made by its manufacturer, is not guaranteed or endorsed by the publisher.
References
1. Zou Y, Donner RV, Marwan N. Complex Network Approaches to Nonlinear Time Series Analysis[J]. Phys Rep (2018) 787:1–97. doi:10.1016/j.physrep.2018.10.005
2. Pavón-Domínguez P, Jiménez-Hornero FJ, Gutiérrez de Ravé E. Joint Multifractal Analysis of the Influence of Temperature and Nitrogen Dioxide on Tropospheric Ozone. Stoch Environ Res Risk Assess (2015) 29(7):1881–9. doi:10.1007/s00477-014-0973-5
3. Albert R, Barabási A-L. Statistical Mechanics of Complex Networks. Rev Mod Phys (2002) 74(1):47–97. doi:10.1103/revmodphys.74.47
4. Zhou C, Ding L, Skibniewski MJ, Luo H, Jiang S. Characterizing Time Series of Near-Miss Accidents in Metro Construction via Complex Network Theory. Saf Sci (2017) 98:145–58. doi:10.1016/j.ssci.2017.06.012
5. Fan X, Li X, Yin J, Tian L, Liang J. Similarity and Heterogeneity of price Dynamics across China's Regional Carbon Markets: A Visibility Graph Network Approach. Appl Energ (2019) 235:739–46. doi:10.1016/j.apenergy.2018.11.007
6. Hu J, Xia C, Li H, Zhu P, Xiong W. Properties and Structural Analyses of USA's Regional Electricity Market: A Visibility Graph Network Approach. Appl Maths Comput (2020) 385:125434. doi:10.1016/j.amc.2020.125434
7. Gao Z, Li S, Dang W. Wavelet Multiresolution Complex Network for Analyzing Multivariate Nonlinear Time Series[J]. Int J Bifurcation Chaos (2017) 27(8):1750123. doi:10.1142/s0218127417501231
8. Carmona-Cabezas R, Ariza-Villaverde AB, Gutiérrez de Ravé E, Jiménez-Hornero FJ. Visibility Graphs of Ground-Level Ozone Time Series: A Multifractal Analysis. Sci Total Environ (2019) 661:138–47. doi:10.1016/j.scitotenv.2019.01.147
9. Dai P-F, Xiong X, Zhou W-X. Visibility Graph Analysis of Economy Policy Uncertainty Indices. Physica A: Stat Mech its Appl (2019) 531:121748. doi:10.1016/j.physa.2019.121748
10. Lacasa L, Luque B, Ballesteros F, Luque J, Nuño JC. From Time Series to Complex Networks: The Visibility Graph. Pnas (2008) 105(13):4972–5. doi:10.1073/pnas.0709247105
11. Lacasa L, Luque B, Luque J, Nuño JC. The Visibility Graph: A New Method for Estimating the Hurst Exponent of Fractional Brownian Motion. Europhys Lett (2009) 86(3):30001. doi:10.1209/0295-5075/86/30001
12. Liu K, Weng T, Gu C, Yang H. Visibility Graph Analysis of Bitcoin price Series. Physica A: Stat Mech its Appl (2020) 538:122952. doi:10.1016/j.physa.2019.122952
13. Lacasa L, Nuñez A, Roldán É, Parrondo JMR, Luque B. Time Series Irreversibility: a Visibility Graph Approach. Eur Phys J B (2012) 85(6):217. doi:10.1140/epjb/e2012-20809-8
14. Gao Z-K, Cai Q, Yang Y-X, Dang W-D, Zhang S-S. Multiscale Limited Penetrable Horizontal Visibility Graph for Analyzing Nonlinear Time Series. Sci Rep (2016) 6:35622. doi:10.1038/srep35622
15. Carmona-Cabezas R, Gómez-Gómez J, Ariza-Villaverde AB, Gutiérrez de Ravé E, Jiménez-Hornero FJ. Multiplex Visibility Graphs as a Complementary Tool for Describing the Relation between Ground Level O3 and No2. Atmos Pollut Res (2020) 11(1):205–12. doi:10.1016/j.apr.2019.10.011
16. Carmona-Cabezas R, Gómez-Gómez J, Gutiérrez de Ravé E, Jiménez-Hornero FJ. A Sliding Window-Based Algorithm for Faster Transformation of Time Series into Complex Networks. Chaos (2019) 29(10):103121. doi:10.1063/1.5112782
17. Luque B, Lacasa L, Ballesteros F, Luque J. Horizontal Visibility Graphs: Exact Results for Random Time Series. Phys Rev E Stat Nonlin Soft Matter Phys (2009) 80:046103. doi:10.1103/PhysRevE.80.046103
18. Ren W, Jin N. Sequential Limited Penetrable Visibility-Graph Motifs. Nonlinear Dyn (2020) 99(3):2399–408. doi:10.1007/s11071-019-05439-y
19. Davis EP, Zhu H. Bank Lending and Commercial Property Cycles: Some Cross-Country Evidence. J Int Money Finance (2011) 30(1):1–21. doi:10.1016/j.jimonfin.2010.06.005
20. Du K, Fu Y, Qin Z. Regime Shift, Speculation, and Stock Price[J]. Res Int Business Finance (2010) 52:101181.
21. Rapach DE, Strauss JK, Zhou G. International Stock Return Predictability: What Is the Role of the United States?. J Finance (2013) 68(4):1633–62. doi:10.1111/jofi.12041
22. Tanbeer SK, Ahmed CF, Jeong B-S, Lee Y-K. Sliding Window-Based Frequent Pattern Mining over Data Streams. Inf Sci (2009) 179(22):3843–65. doi:10.1016/j.ins.2009.07.012
23. Lan X, Mo H, Chen S, Liu Q, Deng Y. Fast Transformation from Time Series to Visibility Graphs. Chaos (2015) 25:083105. doi:10.1063/1.4927835
24. Lacasa L, Nicosia V, Latora V. Network Structure of Multivariate Time Series. Sci Rep (2015) 5:15508. doi:10.1038/srep15508
Keywords: time series visualization, complex network, sliding window-based visibility graph, multiplex visibility graph, stock price
Citation: Liu X, Yuan X, Liu C, Ma H and Lian C (2021) Analysis of Stock Price Data: Determinition of The Optimal Sliding-Window Length. Front. Phys. 9:741106. doi: 10.3389/fphy.2021.741106
Received: 14 July 2021; Accepted: 31 August 2021;
Published: 13 September 2021.
Edited by:
Chao Gao, Southwest University, ChinaReviewed by:
Jun Hu, Fuzhou University, ChinaJiwei Xu, Xi’an University of Posts and Telecommunications, China
Copyright © 2021 Liu, Yuan, Liu, Ma and Lian. This is an open-access article distributed under the terms of the Creative Commons Attribution License (CC BY). The use, distribution or reproduction in other forums is permitted, provided the original author(s) and the copyright owner(s) are credited and that the original publication in this journal is cited, in accordance with accepted academic practice. No use, distribution or reproduction is permitted which does not comply with these terms.
*Correspondence: Chongyang Lian, MTM5MjI2NTE4NUBxcS5jb20=
 Xuebin Liu
 Xuesong Yuan2
 Chongyang Lian