- 1Department of Radiation Oncology, Heidelberg Ion Beam Therapy Center (HIT), Heidelberg University Hospital, Heidelberg, Germany
- 2Faculty of Physics and Astronomy, Heidelberg University, Heidelberg, Germany
- 3Clinical Cooperation Unit Translational Radiation Oncology, German Cancer Consortium (DKTK) Core-Center Heidelberg, National Center for Tumor Diseases (NCT), Heidelberg University Hospital (UKHD) and German Cancer Research Center (DKFZ), Heidelberg, Germany
- 4Division of Molecular and Translational Radiation Oncology, Heidelberg Faculty of Medicine (MFHD) and Heidelberg University Hospital (UKHD), Heidelberg, Germany
- 5Heidelberg Faculty of Medicine (MFHD) and German Cancer Research Center (DKFZ), Heidelberg Institute of Radiation Oncology (HIRO), National Center for Radiation Oncology (NCRO), Heidelberg University Hospital (UKHD), Heidelberg, Germany
- 6Clinical Cooperation Unit Radiation Oncology, German Cancer Consortium (DKTK) Core-Center Heidelberg, National Center for Tumor Diseases (NCT), Heidelberg University Hospital (UKHD) and German Cancer Research Center (DKFZ), Heidelberg, Germany
- 7Medical Physics, National Centre of Oncological Hadrontherapy (CNAO), Pavia, Italy
- 8Medical Faculty, Heidelberg University, Heidelberg, Germany
Dose calculation algorithms based on Monte Carlo (MC) simulations play a crucial role in radiotherapy. Here, the development and benchmarking of a novel MC dose engine, MonteRay, is presented for proton therapy aiming to support clinical activity at the Heidelberg Ion Beam Therapy center (HIT) and the development of MRI (magnetic resonance imaging)-guided particle therapy. Comparisons against dosimetric data and gold standard MC FLUKA calculations at different levels of complexity, ranging from single pencil beams in water to patient plans, showed high levels of agreement, validating the physical approach implemented in the dose engine. Additionally, MonteRay has been found to match satisfactorily to FLUKA dose predictions in magnetic fields both in homogeneous and heterogeneous scenarios advocating its use for future MRI-guided proton therapy applications. Benchmarked on 150 MeV protons transported on a 2 × 2 × 2 mm3 grid, MonteRay achieved a high computational throughput and was able to simulate the histories of more than 30,000 primary protons per second on a single CPU core.
Introduction
Image guided radiotherapy is at the forefront of innovative treatment delivery techniques. It has the potential to improve treatment efficacy via on-board imaging procedures such as adaptive planning and/or live monitoring, for instance via magnetic resonance (MR)-guided radiation therapy (MRgRT) [1, 2]. Over the last decade, clinical prototypes have combined low-field-strength MR and radioactive cobalt-60 sources for photon treatment, followed by linear accelerators and higher field-strength MR fields for improved image resolution [3–5].
Particle therapy (PT), a cancer treatment modality achieving superior dose conformity to solid tumours compared to conventional photon techniques [6, 7], would greatly benefit from on-board MR-guided treatment delivery [8]. For instance, at the Heidelberg Ion Beam Therapy Center (HIT) over 5,000 patients have been treated with proton and carbon ions since 2009 [9]. While 16O ions have so far only been used for research purposes, HIT has treated the first patient with raster scanning 4He ion beams in July 2021.
For all clinically administered ion beams, on-board MR-guided treatment delivery is currently not feasible. However, system developments for treatment planning and delivery of MR-guided particle therapy are underway at HIT. Here, we begin with considerations in dose calculation for MR-guided particle therapy. During MRgRT using photons, for example, the MR field (due to Lorentz forces) can impact the dose deposition of ionized electrons/delta-rays, with severity depending on patient anatomy and MR field strength [10, 11]. Hence, dose calculation corrections are introduced in clinical practice for improving accuracy [12]. Similarly, trajectories of fast charged particles like protons are altered by the MR field [13–15] and consequently, proper consideration must be given for accurate dose calculation.
With the aim of providing dose computations at various levels of accuracy and speed for current and future treatment in particle therapy with light and heavy ions, various systems have been introduced at HIT to support clinical deployment of PT. Initially, as a gold standard, a MC environment based on the MC code FLUKA [16, 17] has been developed and extensively benchmarked [18] for allowing database generation for clinical analytical treatment planning system (TPS) and patient recalculations. This framework required long computation times (hours to days depending on the number of CPUs available) which limited its usage in the analysis of large patient cohorts and for any adaptive/on-line planning.
In order to overcome these limitations, FRoG (Fast dose* Recalculation on GPU) has been introduced, an advanced analytical code capable of calculating dose, LETd (dose-weighted Linear Energy Transfer) and biological dose for the four particle beams available at HIT [19–21] and which is in use at other PT facilities in Europe (Centro Nazionale di Adroterapia Oncologica [21], Danish Centre for Particle Therapy [22]. High levels of agreement within 1–2% [19, 21, 23] were found comparing FLUKA and FRoG recalculated dose-volume-histograms (DVH) of proton and other light ion patient plans even for complex cases such as lung irradiation [23]. However, analytical codes are usually designed for a specific task, making the introduction of new features such as MR-guidance [14, 24], positron emission tomography [25, 26] and prompt gammas [27] require large development effort and substantial changes in the physics engine. Fast MC engines have been introduced for proton beams [28–33] and helped streamline the development while reaching various levels of agreement when compared against gold standard MC codes such as FLUKA and TOPAS/Geant [34].
Several recent works have investigated the impact of MR-guidance on particle beam physics and modelling distortion due to the Lorentz force [13, 35–38]. Despite these characterizations however, no fast MC engine has been presented in literature which is able to perform clinically relevant particle therapy calculations in magnetic fields. In this work, a CPU-based fast MC dose engine for proton beams (MonteRay) was developed and benchmarked for supporting ongoing clinical activity and introducing novel treatment modalities, particularly within the MRI-guided particle therapy program at HIT.
Materials and Methods
Programming Languages and Libraries
With performance and extensibility to GPUs in mind, the MonteRay MC engine was written in C++. Several external libraries were used either during development or execution of the MC code. The frameworks GoogleTest [39] and Benchmark [40] are used for testing and microbenchmarking the source code. The Boost library [41] is used for filesystem operations and parsing of configuration files. RapidXml [42] is used for reading of irradiation plans in XML format. ITK [43] and DCMTK [44] are used for reading CT images. FLUKA simulations were performed using FLUKA version 2020 0.6.
Geometry and Materials
Voxelized water phantom and patient geometries are implemented from computed tomography (CT) scans using the approach described in [45, 46], i.e. the Hounsfield Unit (HU) of each voxel is converted to a water equivalent path length, density and elemental composition. In total, 36 different materials, covering an HU range between -1000 HU and 3070 HU are used. HU values larger than 3070 are assumed to be metallic implants made from titanium. Each material is modeled as a combination of up to ten elements. Additionally, five extra materials (water, RW3, PMMA, air and carbon fiber) can be defined by the user for dosimetric studies. For the calculation of nuclear interactions, only the most abundant isotope of each element is considered: 1H, 12C, 14N, 16O, 23Na, 24Mg, 31P, 32S, 35Cl,40Ar, 39K, 40Ca and 48Ti. However, just H, C, O and Ca already constitute more than 90% of a human’s weight [47]. Including more materials in MonteRay is trivial if they consist only of the ten base elements already defined. Adding additional elements requires the generation of additional inelastic nuclear interaction databases (Inelastic Nuclear Interactions).
Handling the HIT-specific Beamline
The HIT beamline consists of various layers of different materials, including tungsten [48], with which the particle beam interacts before reaching the patient, resulting in a unique phase-space of particles. To avoid modelling and simulating the whole beamline in MonteRay, the approach described in [49] was used, i.e., sampling from a phase-space for each of the 255 quasi-monoenergetic proton beams available at the HIT facility. Each file contains the location, direction and energy of 10 million particles sampled on a plane perpendicular to the beam’s direction before the patient’s entrance. The phase space was generated using FLUKA and besides primary protons, secondary protons generated due to the primary particle’s interactions with the beamline are also considered. For now, however, all other secondary particles (deuterons, tritons, 3He, 4He and neutrons) are neglected. During simulation, our MC code randomly samples individual particles from these phase space files.
Transport
For the simulation of proton beams, MonteRay performs the transport of protons, deuterons, tritons, 3-Helium and 4-Helium. Of these particles, only protons undergo elastic and Inelastic Nuclear Interactions as described in Nuclear Interactions. All transported particles experience energy loss and scattering through electromagnetic interactions as described in Electromagnetic Interactions.
Energy is deposited either on a Cartesian or a cylindrical grid. Energy depositions from heavy nuclear recoils are recorded locally while energy lost through electromagnetic interactions are deposited along a track via the method described in [50]: given the particle’s location at the beginning of the transport step
where
The energy loss over the distance
where
After updating the particle’s position, energy and direction, if a nuclear interaction occurred, the type of nuclear interaction is determined, and the nuclear interaction performed as will be described in Nuclear Interactions. The transport step is repeated until the particle’s energy falls below a threshold of 1 MeV. The remaining energy is deposited in a single step. During transport, only protons undergo nuclear interactions. For all other particles, only electromagnetic energy losses are considered.
Angular deflections due to nuclear or electromagnetic interactions, expressed through a polar angle
where the vectors
Electromagnetic Interactions
Interactions with electrons cause charged particles to continuously lose energy while travelling through matter. The mean energy loss per unit distance due to this process is called the stopping power
where
This recurrence relation is evaluated up to a depth of n = 3 to arrive at an accurate estimate of
Scattering is a statistical process, so the stopping power only describes the mean energy loss per unit distance traveled. Theoretical treatments of this process have for example been done in [55, 56]. The distributions derived therein are complex and their sampling costly. But in the limit were
where
and
where
The log-normal distribution’s parameters are determined through a fit, matching the first four moments of the Vavilov distribution [57]. For very small
Besides inelastic collisions with atomic electrons, charged particles also undergo elastic collisions with atomic nuclei. These interactions do not contribute to the particle’s energy loss but deflect the particle. This too, is a statistical process. Commonly, MC simulations base their scattering model on Moliere’s theoretical treatment [58]. The formula derived by Moliere is a series of functions
where the reduced angle
and where
Sampling from higher order terms of the Moliere distribution is computationally expensive, but approximations can be made. Perhaps the simplest is dropping higher order terms, i.e. terms where
or a Gaussian distribution in
Single Gaussian approximations of the scattering angle have for example been introduced by Rossi [60] or Highland [61]. For the width
where
For small
For the simulations, the value
Here,
Sampling of an angle
Nuclear Interactions
Elastic Nuclear Interactions
The kinematics involved in elastic nuclear interactions are implemented fully relativistically. The total elastic cross section
where,
With
Inelastic Nuclear Interactions
In particle therapy, inelastic nuclear scattering events generate the mixed radiation field, i.e. photons, protons, neutrons, deuterons, tritons, 3He, 4He and heavier fragments (nuclear recoils). In MonteRay, similarly to other works in literature [31, 32], photons and neutrons are assumed to be dosimetrically irrelevant and they are neither transported nor produced. The total inelastic cross section
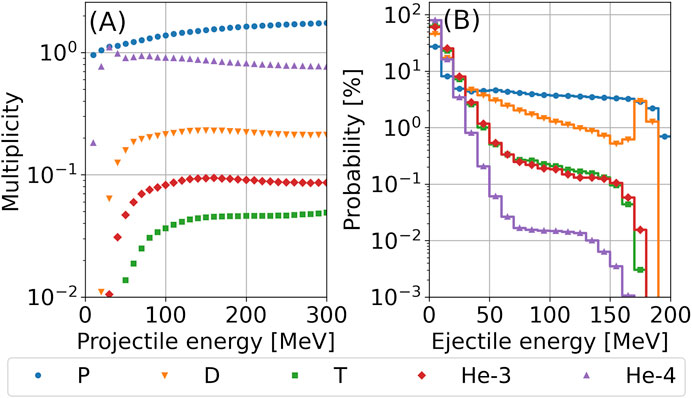
FIGURE 1. (A) Average number of particles produced per p + 16O collision as a function of the energy of the incoming proton. (B) For 200 MeV p + 16O collisions, the angularly integrated probability (in %) of a secondary particle being produced in a certain energy bin (bin size: 10 MeV) is shown. Abbreviations stand for Protons (P), Deuterons (D), Tritons (T), Helium-3 (3He) and Helium-4 (4He).
Benchmarking of the Developed Dose Engine
To benchmark MonteRay, its predictions were compared against experimental data acquired at HIT over the last years, published in [71, 72]. For scenarios where experimental data was not available, e.g. in presence of magnetic fields and for patient calculations, FLUKA predictions were used as a reference.
Comparison Metrics
To judge MonteRay’s agreement with measurements or against other TPS, several common radiotherapy metrics were used. The relative error
was used to quantify the relative disagreement between two dose profiles,
To judge the deflection of a single beam in a magnetic field, we introduce the center of mass (COM) of the beam. Given a lateral profile scored in N bins at locations
Dosimetric Data
Various experimental data that was previously recorded at HIT was used to evaluate MonteRay’s performance in terms of dosimetric accuracy. This data, included pencil-beam depth-dose distributions [71], lateral profiles of vertically scanned line profiles [75] and Spread-Out Bragg Peak (SOBP) plans [72]. Details on the measurement procedures were given in the mentioned references so only a quick overview will be given here.
Pencil beam depth-dose distributions in water were recorded using a PeakFinder water column (PTW, Freiburg) with a diameter of 8.16 cm. In total, 17 Bragg curves with beam energies spanning the entire energy range available at HIT (from 48.5 to 222.6 MeV) have been measured. The measurements took place in a clinical room at HIT. The resolution was 0.05 mm in the region of the BP.
Measurements of lateral profiles of vertically scanned irradiation lines in a water phantom were obtained at three energies (81.5, 158.5 and 222.6 MeV) using an array of 24 motorized pinpoint chambers (PTW, 0.03 cm3) arranged in a block of six rows and four columns. The profiles were recorded perpendicularly to the direction of the vertically scanned line. Each scanned line consisted of 101 pencil beams ranging from -50 mm to +50 mm with a 1 mm spacing. The horizontal profiles were recorded starting from about 16 mm in water to 30 mm after the BP. For each energy, profiles at 42 depths were recorded. The distance between consecutive profiles was between 0.5 and 10 mm.
Three SOBP plans centered around 5 cm, 12.5 and 20 cm in water were created using a FLUKA-based treatment planning tool. The planned dose was 1 Gy within the 3 × 3 × 3 cm target region. Delivery of the plans happened in the experimental room at HIT with measurements being done with the same block of pinpoint ionization chambers used for acquiring the lateral profiles described earlier. The profiles were recorded starting at a depth of 16 mm to approximately 20 mm after the end of the SOBP. The step size between measurements in regions of high gradient and in regions of high dose was 1 mm.
FLUKA Calculations
Due to the lack of dosimetric data in magnetic fields, the transport in magnetic fields was benchmarked by comparing MonteRay against FLUKA. For this the effect of homogenous magnetic fields, applied perpendicular to the beam’s direction, was studied for field strengths of 0.5, 1.0 and 2 T. In FLUKA, magnetic fields were enabled using the MGNFIELD card with default settings. The DEFAULTS card with value PRECISIO was enabled during FLUKA simulations to ensure high precision simulations.
Patient Planning
Patient planning was performed in the clinical TPS RayStation 10 A (RaySearch Laboraries, Stockholm, Sweden) on an anonymized DICOM patient data set representative of a meningioma treatment. A proton treatment plan using a single beam at 90° was optimized for evaluation of dose calculation accuracies in a patient anatomy. The initial spot positioning (hexagonal grid with spot spacing of 3.6 mm, energy spacing of 2.1 mm) and minimum number of particles (580.000 particles) settings follow clinical practice at HIT. Optimization was made on the planning target volume (PTV, ∼112 cm³) for 49.1 Gy/ 54 GyRBE in 30 fractions using a constant radiobiological effectiveness of 1.1. The resultant energy range spanned from ∼78 to 151 MeV. The dose grid was set to 2 × 2 × 2 mm³ in RayStation with a dose uncertainty of 0.5%. The treatment plan was exported in FLUKA and MonteRay for forward calculation with and without a magnetic field. The statistical uncertainty of the MonteRay and FLUKA runs was 1%. The dose uncertainty was estimated using the batch method. Dose cubes stemming from FLUKA MC and MonteRay were ultimately imported in RayStation for dosimetric analysis (DVH and line profile evaluation). All doses were computed as dose-to-water and dose comparisons were made in Gy.
Results
Pristine Bragg Peaks in Water
To evaluate the accuracy of MonteRay, we first compare the simulated dose in water
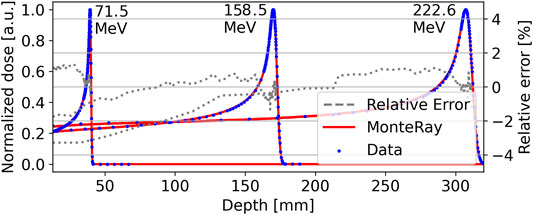
FIGURE 2. Integrated depth-dose profiles of quasi-monoenergetic beams with energies of 71 MeV, 158.5, and 222.6 MeV are shown. Peakfinder measurements are indicated by blue points and MonteRay simulations as solid red lines. The relative error, after correcting for a lateral shift, between measurements and MonteRay simulations is shown with grey dotted lines after correcting for the lateral shift.
For the verification of the lateral parametrization in water, measurements of vertically scanned proton beam lines, as described in Dosimetric Data, were compared against MonteRay simulations. Lateral relative dose profiles at three energies, 81.5, 158.5 and 222.6 MeV, and at 40 different depths were compared. In Figure 3 and for each energy, lateral profiles at three depths are visualized: at the entrance (top row), in the BP region (bottom row) and in the middle of these two (middle row). The depths are reported in each panel of Figure 3. The corresponding energy is given at the top of each column. After correcting for the error in FWHM already present at the entrance due to daily variations in the beam’s shape, on average, the simulated FWHM matched the experimental data’s FWHM within 0.1, 0.3 and 0.5 mm for the three energies, respectively. Likewise, the FW10%M values matched to within 0.1, 0.3 and 0.9 mm.
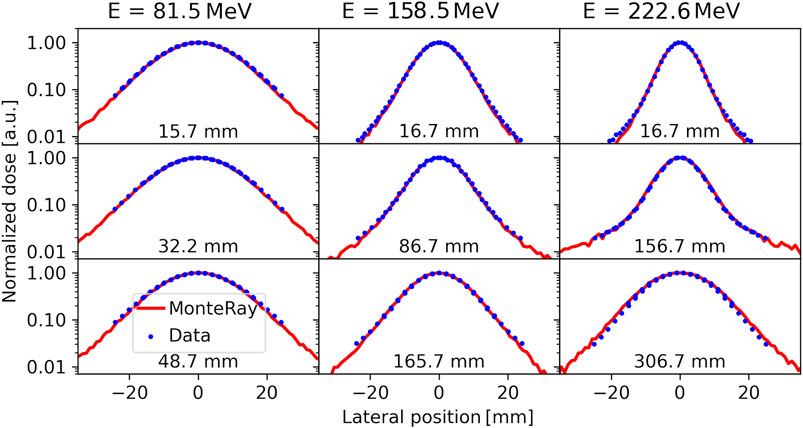
FIGURE 3. Lateral dose profiles of vertically scanned proton lines at 81.5 MeV (left column), 158.5 MeV (central column) and 222.6 MeV (right column) at different depths as reported in the panels. Measurements (blue points) are compared against MonteRay simulations (red lines).
Spread Out Bragg Peaks in Water
Next, MonteRay’s simulated dose was compared with dosimetric data from SOBP plans. The measurement process was described in Dosimetric Data. The resulting depth-dose distributions are displayed in Figure 4, together with the measured values. The mean absolute relative error between measurements and predictions (excluding data in regions of high dose gradients, as performed in clinical routine) was (0.69%, 0.74%, 1.0%) with a standard deviation of (0.7%, 0.6%, 1.0%). The
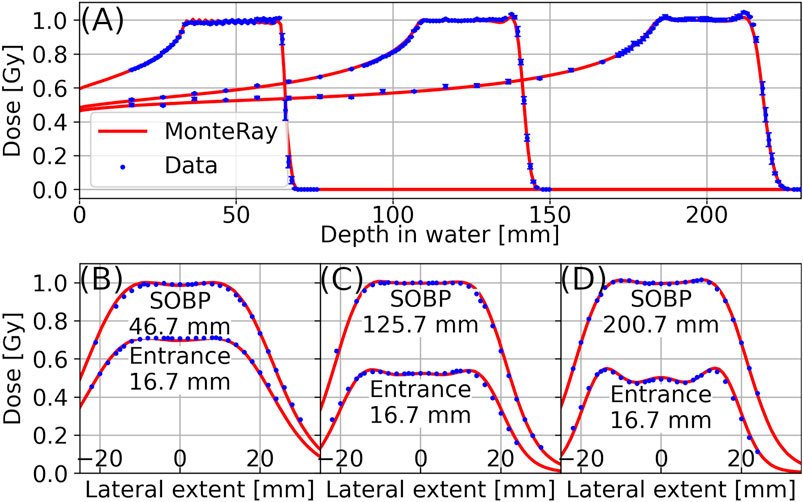
FIGURE 4. In panel (A), Longitudinal dose distributions of three proton SOBP plans in water with plateau depths of approximately 5 cm, 12.5, and 20 cm are shown. In panels (B), (C), and (D), lateral profiles corresponding to the three SOBP plans are displayed. For each SOBP, one lateral profile at the entrance and one lateral profile in the middle of the SOBP is shown. Measurements (points) are compared against MonteRay’s simulated values (lines).
Magnetic Field Deflection in Homogenous Fields
To judge the accuracy of MonteRay when dealing with homogenous magnetic fields, MonteRay’s simulations were first compared to FLUKA’s for monoenergetic proton beams incident on water. The magnetic field was applied perpendicular to the beam’s direction and four field strengths of 0 T, 0.5 T, 1 T and 2 T were compared. Planar profiles were scored with a resolution of 1 × 1 × 1 mm3 but were afterwards integrated along 1 cm in the direction of the magnetic field axis to provide higher statistics. In Figures 5A,B, 2D dose distributions, perpendicular to the magnetic field, are shown for the case where the magnetic field strength was 2 T. In panel (A), MonteRay’s results are shown while FLUKA’s results are displayed in panel (B). For all tested field strengths, the gamma passing rate (as defined in Comparison Metrics) was above 99.8%
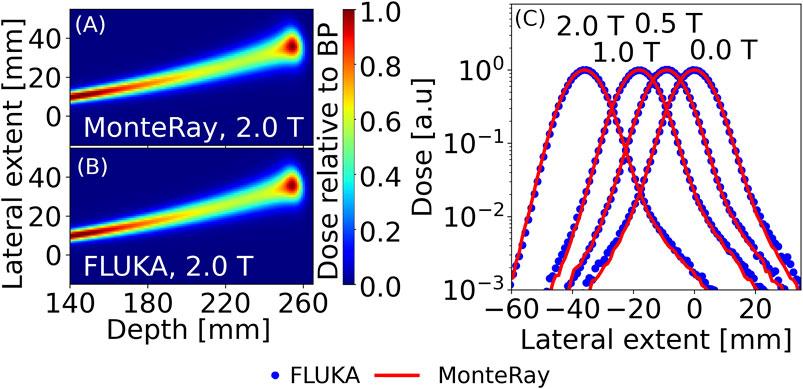
FIGURE 5. For 200 MeV protons in water, 2D dose distributions calculated with MonteRay (A) and FLUKA (B) are shown in a plane perpendicular to the 2 T magnetic field. In (C), Lateral profiles for 200 MeV protons in water and with magnetic field strengths of 0 T, 0.5 T, 1 T, and 2 T are displayed at the location of the BP. MonteRay’s results are indicated by a red line while FLUKA’s results are displayed as blue dots.
In Figure 5C, lateral profiles at the BP position for the four field strengths are shown. From lateral profiles, COM, FWHM and FW%10M were computed at each depth up to the BP. The maximum differences in COMs (

TABLE 1. Comparison of MonteRay against Fluka for a 200 MeV proton beam incident on water with different homogenous magnetic fields applied perpendicular to the beam. The maximum differences in the COM (
Patient Case
In Figure 6 panels (A) and (B), the doses for a patient plan, calculated with FLUKA and MonteRay are shown in the axial plane. The gamma passing rate between MonteRay and FLUKA was computed to be 99.8%. In panel (C), longitudinal profiles and in panel (D), lateral profiles are shown. The profiles are shown for simulated doses obtained from RayStation, FLUKA and MonteRay, and their locations are indicated in panel (A) through red horizontal (longitudinal) and vertical (lateral) lines. For RayStation, FLUKA and MonteRay, the lateral profile’s FWHMs were 67.6, 68.1, and 68.3 mm. The widths at 10% of the maximum were 85.3, 86.1, and 85.9 mm. The differences in range between MonteRay/FLUKA and RayStation/FLUKA were calculated from the longitudinal profiles and found to be 0.4 and 0.6 mm, respectively. Both in terms of lateral and longitudinal profiles, MonteRay agrees well with FLUKA.
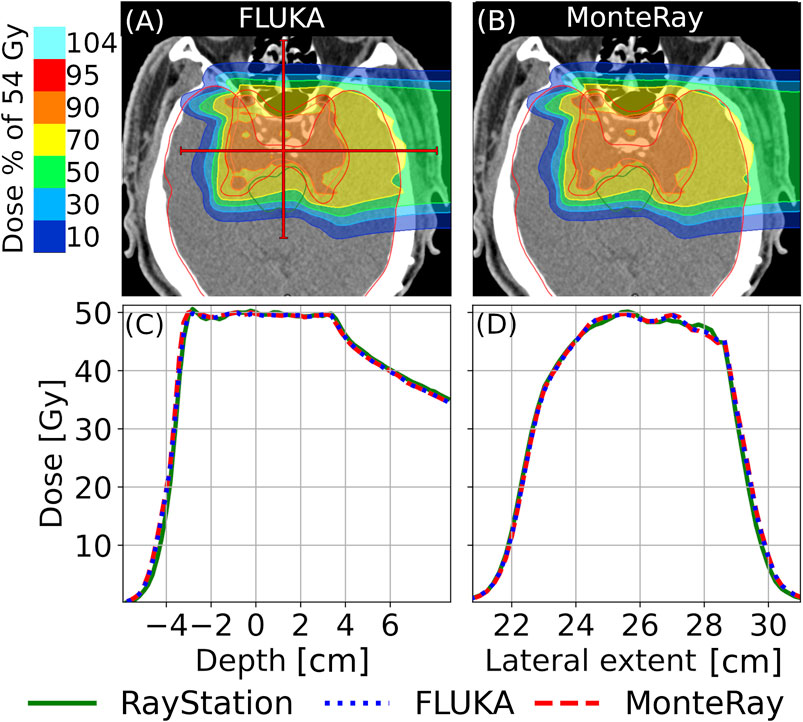
FIGURE 6. Axial views of calculated doses for the plan described in Section 2.2.4 are shown for (A) FLUKA and (B) MonteRay. In panels (C) and (D), longitudinal and lateral profiles are shown, respectively. The locations of the profiles relative to the 2D plots are indicated trough red lines in panel (A). RayStation profiles are indicated by a solid green line, FLUKA profiles by a dotted blue line and MonteRay profiles by a dashed red line.
In Figure 7A, DVHs calculated for several regions of interest (ROI) are displayed: the CTV, the brain, the brainstem and the right optical nerve. The
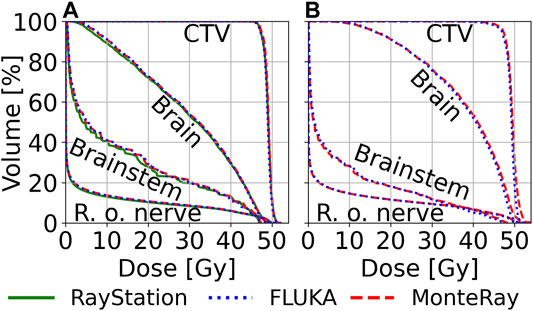
FIGURE 7. Computed DVHs for the CTV, the brain, the brainstem and the right optical nerve (r. o. nerve) are shown. DVHs were computed for RayStation (green, solid line), FLUKA (blue, dotted line) and MonteRay (red, dashed line). In panel (A), DVHs for the patient case without a magnetic field are shown while in panel (B) DVHs calculated for the case with an applied magnetic field are shown.
Patient Case With a Magnetic Field
To benchmark our magnetic field implementation, the previous patient plan was reused but for the dose calculation in MonteRay and FLUKA, a homogenous magnetic field of 1 T was applied throughout the CT volume. In Figure 8, the calculated doses in FLUKA (Panel (A)) and MonteRay (Panel (B)) are displayed. With the magnetic field enabled, the gamma passing rate between MonteRay and FLUKA was found to be 98.8%.
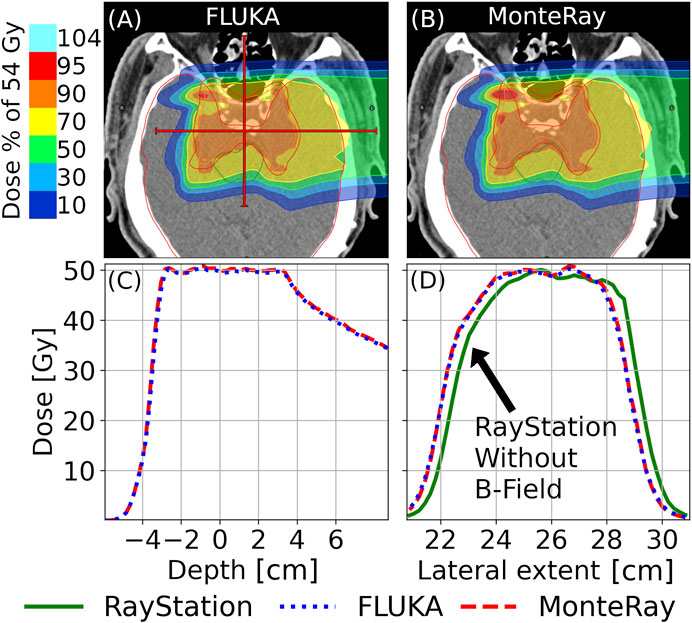
FIGURE 8. Axial views of calculated doses for the plan described in Section 2.2.4 with an added perpendicular magnetic field of 1 T are shown for (A) FLUKA and (B) MonteRay. In panels (C) and (D), longitudinal and lateral profiles are shown, respectively. Besides the lateral profiles obtained from FLUKA and MonteRay, we also show the lateral profile of the RayStation dose calculated without a magnetic field. The locations of the profiles relative to the 2D plots are indicated trough red lines in panel (A). RayStation profiles are indicated by a solid green line, FLUKA profiles by a dotted blue line and MonteRay profiles by a dashed red line.
In panel (C), longitudinal profiles and in panel (D), lateral profiles are shown, and their locations are indicated in panel (A) through horizonal (longitudinal) and vertical (lateral) lines. Profiles are shown for simulated doses obtained with MonteRay and FLUKA. Additionally, in panel (D), the lateral profile obtain d from RayStation without an applied magnetic field is shown. The deflection observed at the lateral profile’s position was ∼5 mm. Computed for FLUKA and MonteRay, the lateral profile’s FWHMs were 67.4 mm, 67.5 mm. The widths at 10% of the maximum were 86.0 and 85.0 mm. The difference in range between MonteRay and FLUKA, calculated from the longitudinal profiles, was found to be 0.4 mm.
In Figure 7B, DVHs calculated on the same ROIs as in the previous section are shown.
Runtime Benchmarks
The performance of MonteRay was evaluated for various test cases. All tests were performed on a six-core AMD Ryzen 5,3600 processor. The transport grid’s resolution was set to 2 × 2 × 2 mm3. This resolution is used clinically at HIT and other fast MC codes have used this resolution for benchmarking [31]. For 150 MeV monoenergetic Protons in water with a FWHM of 1 cm, a throughput of 31 k primaries per second on a single core and 180 k primaries per second when using all six cores of the CPU, was measured. Under parallel load, the throughput therefore was 30 k primaries per second per core. In comparison, the computational throughput of FLUKA on the same problem on the same hardware was 1.1 k primaries per second.
For the patient plan, benchmarks were run on a 2 × 2 × 2 mm3 grid with 5,000 particles per pencil beam per core. In total, the plan consisted of 8313 pencil beams. On a single core, a throughput of 33 k particles per second was observed while the throughput on six core was measured to be 193 k primaries per second which corresponds to 32 k primaries per seconds per core.
Discussion
The comparison of MonteRay predictions against dosimetric data and FLUKA simulations confirms that the implemented electromagnetic and nuclear models correctly reproduce the underlying physics. In terms of depth-dose distributions for pencil beams in water (Pristine Bragg Peaks in Water), the mean absolute relative error over all 17 compared energies was 0.56%, ranging from 0.33 to 0.60% for 102.6 and 222.6 MeV protons, respectively. The depth-dependent maximum absolute relative error varied from 0.95% (48.5 MeV) to 3.4% (222.6 MeV). The latter is located at the entrance channel of the highest energy (222.6 MeV) which is typically not used for clinical purpose. This underestimation could in part be explained through the fact that the current approach for sampling the initial particles neglects secondary d, t, 3He and 4He particles produced in the beamline. Our predictions are in line with other fast MC engines available in literature, for example [73], using FRED have found relative differences of up to about 3% for 200 MeV protons in water.
In terms of lateral evolution as function of depth, MonteRay matched satisfactorily the experimental data in terms of FWHM/FW10%M within on average 0.1, 0.3, and 0.9 mm for low, medium and high energies. The largest difference has been found in the Bragg peak region for 222.6 MeV protons with a maximum variation of the FW10%M of 2 mm. To evaluate possible shortcomings in the scattering model, we have compared FLUKA and MonteRay predictions for 200 MeV proton beams in water without the HIT beamline. The maximum FWHM(FW10%M) variation found was 0.17 mm (0.24 mm) and the 3D gamma pass rate was 99.8% confirming the quality of the implemented model.
Prediction of SOBPs centered at different depths confirmed MonteRay’s beam-model with an average agreement of 1% when compared against experimental data, well fulfilling clinical criteria. MonteRay’s results have been found to be in line with FLUKA results for the same set of experimental SOBP data [71], with average FLUKA dose deviations of 0.9%.
Evaluation of MonteRay on a patient plan showed good agreement against simulations performed with FLUKA. In terms of D2, D50, and D98 we achieved similar agreement to FLUKA as RayStation did. The 3D gamma pass rate was calculated to be 99.8% showing that the implemented models and approximations for electromagnetic and nuclear interactions approximate the underlying physics well, also in a clinical setting. Computed 3D gamma pass rates were in line with those obtained by other fast MC engines [28, 33, 73].
Similarly, we evaluated the quality of our simulation when an additional magnetic field was applied to an irradiation plan. Compared to FLUKA, we found adequate agreement in terms of D2, D50, and D98 between 0.5 and 2.3%. The 3D gamma pass rate was 98.9%, showing that a simple approximation of the Lorentz force is adequate at describing the transport of charged particles in homogenous magnetic fields.
In terms of computational throughput, MonteRay was able to simulate 31 k primaries per second for a 150 MeV proton beam incident on water, transported on a 2 × 2 × 2 mm3 grid. Parallel execution on six cores was found to scale linearly, achieving a throughput of 180 k primaries per second. When benchmarked on a patient plan containing ∼8300 pencil beams with energies ranging from ∼78 to ∼150 MeV, we measured a throughput of 33 k particles per seconds on a single core and 193 k particles on six cores. Again, linear scaling was observed which demonstrates that reading the phase space from disk is not a bottleneck, even when multiple cores are competing for random read access.
Conclusion and Outlook
In this work we have presented a novel MC engine, specialized for proton therapy calculations, currently under development at HIT. Good agreement with measured data and a full-fledged MC engine (FLUKA) has been found. MonteRay achieved fast tracking rates of more than 30 k proton primaries per second at 150 MeV on a 2 × 2 × 2 mm3 grid. In a next step, work will begin on porting our fast CPU engine onto GPUs. Following a heterogenous approach, i.e. using both CPUs and GPUs, we hope to achieve sub-minute runtimes even for large irradiation plans.
A custom Monte Carlo engine will also allow us to easily implement custom features such as computing the linear energy transfer or to add imaging capabilities by producing positrons or prompt gammas.
With helium beam treatment commencing at HIT, inclusion of helium beams in MonteRay is underway with inelastic nuclear databases having already been generated.
With the aim of MR guided ion therapy, we are the first fast MC engine to include magnetic field support. In the future we will expand our evaluation to inhomogeneous fields with a focus on simulating MRIs which are being installed at HIT for the purpose of MR guided ion therapy.
Data Availability Statement
The raw data supporting the conclusions of this article will be made available by the authors, without undue reservation.
Author Contributions
AM, AF, and PL were responsible for the conceptual design of the Monte Carlo engine. PL, BK, and AM developed the source code of the Monte Carlo engine. AM generated the materials database, including elastic and inelastic nuclear cross sections. AF developed the code for the generation of inelastic nuclear databases from FLUKA. JB generated the inelastic nuclear databases. PL, TT, and AM worked on the analysis of data. TT, AM, and SM collected and provided experimental data used in this work. TT computed and provided the patient plan and SOBP plans. JD and TH provided clinical direction during project development, manuscript writing and project administration and funding acquisition. All authors read and contributed to the preparation of the manuscript.
Funding
The authors acknowledge financial support through the German Federal Ministry of Education and Research (BMBF) within the project (Grant number: 13GW0436A).
Conflict of Interest
The authors declare that the research was conducted in the absence of any commercial or financial relationships that could be construed as a potential conflict of interest.
Publisher’s Note
All claims expressed in this article are solely those of the authors and do not necessarily represent those of their affiliated organizations, or those of the publisher, the editors and the reviewers. Any product that may be evaluated in this article, or claim that may be made by its manufacturer, is not guaranteed or endorsed by the publisher.
Acknowledgments
The authors would like to acknowledge Eric Heim’s work on the initial setup of the C++ code base and unit testing framework. The authors would like to acknowledge Ahmad Neishabouri for his help with performing Fluka calculations and Eric Heim for his work on the initial setup of the C++ code base and the unit testing framework.
References
1. Chandarana H, Wang H, Tijssen RHN, Das IJ Emerging Role of MRI in Radiation Therapy. J Magn Reson Imaging (2018) 48:1468–78. doi:10.1002/jmri.26271
2. Pollard JM, Wen Z, Sadagopan R, Wang J, Ibbott GS The Future of Image-Guided Radiotherapy Will Be MR Guided. Bjr (2017) 90:20160667. doi:10.1259/bjr.20160667
3. Mutic S, Dempsey JF The ViewRay System: Magnetic Resonance-Guided and Controlled Radiotherapy. Semin Radiat Oncol (2014) 24:196–9. doi:10.1016/j.semradonc.2014.02.008
4. Liney GP, Whelan B, Oborn B, Barton M, Keall P MRI-linear Accelerator Radiotherapy Systems. Clin Oncol (2018) 30:686–91. doi:10.1016/j.clon.2018.08.003
5. Acharya S, Fischer-Valuck BW, Kashani R, Parikh P, Yang D, Zhao T, et al. Online Magnetic Resonance Image Guided Adaptive Radiation Therapy: First Clinical Applications. Int J Radiat Oncology*Biology*Physics (2016) 94:394–403. doi:10.1016/j.ijrobp.2015.10.015
6. Durante M, Loeffler JS Charged Particles in Radiation Oncology. Nat Rev Clin Oncol (2010) 7:37–43. doi:10.1038/nrclinonc.2009.183
7. Durante M, Orecchia R, Loeffler JS Charged-particle Therapy in Cancer: Clinical Uses and Future Perspectives. Nat Rev Clin Oncol (2017) 14:483–95. doi:10.1038/nrclinonc.2017.30
8. Hoffmann A, Oborn B, Moteabbed M, Yan S, Bortfeld T, Knopf A, et al. MR-guided Proton Therapy: a Review and a Preview. Radiat Oncol (2020) 15:129. doi:10.1186/s13014-020-01571-x
9. Haberer T, Debus J, Eickhoff H, Jäkel O, Schulz-Ertner D, Weber U The heidelberg Ion Therapy center. Radiother Oncol (2004) 73:S186–S190. doi:10.1016/s0167-8140(04)80046-x
10. Rankine LJ, Mein S, Cai B, Curcuru A, Juang T, Miles D, et al. Three-Dimensional Dosimetric Validation of a Magnetic Resonance Guided Intensity Modulated Radiation Therapy System. Int J Radiat Oncol Biol Phys (2017) 97:1095–104. doi:10.1016/j.ijrobp.2017.01.223
11. Klüter S Technical Design and Concept of a 0.35 T MR-Linac. Clin Translational Radiat Oncol (2019) 18:98–101. doi:10.1016/j.ctro.2019.04.007
12. Chamberlain M, Krayenbuehl J, van Timmeren JE, Wilke L, Andratschke N, Garcia Schüler H, et al. Head and Neck Radiotherapy on the MR Linac: a Multicenter Planning challenge Amongst MRIdian Platform Users. Strahlenther Onkol (2021) 1–11. doi:10.1007/s00066-021-01771-8
13. Raaijmakers AJE, Raaymakers BW, Lagendijk JJW Magnetic-field-induced Dose Effects in MR-Guided Radiotherapy Systems: Dependence on the Magnetic Field Strength. Phys Med Biol (2008) 53:909–23. doi:10.1088/0031-9155/53/4/006
14. Wolf R, Bortfeld T An Analytical Solution to Proton Bragg Peak Deflection in a Magnetic Field. Phys Med Biol (2012) 57:N329–N337. doi:10.1088/0031-9155/57/17/N329
15. Moteabbed M, Schuemann J, Paganetti H Dosimetric Feasibility of Real-Time MRI-Guided Proton Therapy. Med Phys (2014) 41:111713. doi:10.1118/1.4897570
16. Ferrari A, Sala PR, Fasso A, Ranft J FLUKA: A Multi-Particle Transport Code. Stanford: Stanford linear accelerator center (2005). doi:10.2172/877507
17. Böhlen TT, Cerutti F, Chin MPW, Fassò A, Ferrari A, Ortega PG, et al. The FLUKA Code: Developments and Challenges for High Energy and Medical Applications. Nucl Data Sheets (2014) 120:211–4. doi:10.1016/j.nds.2014.07.049
18. Bauer J, Sommerer F, Mairani A, Unholtz D, Farook R, Handrack J, et al. Integration and Evaluation of Automated Monte Carlo Simulations in the Clinical Practice of Scanned Proton and Carbon Ion Beam Therapy. Phys Med Biol (2014) 59:4635–59. doi:10.1088/0031-9155/59/16/4635
19. Mein S, Choi K, Kopp B, Tessonnier T, Bauer J, Ferrari A, et al. Fast Robust Dose Calculation on GPU for High-Precision 1H, 4He, 12C and 16O Ion Therapy: the FRoG Platform. Sci Rep (2018) 8:14829. doi:10.1038/s41598-018-33194-4
20. Mein S, Kopp B, Tessonnier T, Ackermann B, Ecker S, Bauer J, et al. Dosimetric Validation of Monte Carlo and Analytical Dose Engines with Raster-Scanning 1H, 4He, 12C, and 16O Ion-Beams Using an Anthropomorphic Phantom. Physica Med (2019) 64:123–31. doi:10.1016/j.ejmp.2019.07.001
21. Choi K, Mein S, Kopp B, Magro G, Molinelli S, Ciocca M, et al. FRoG-A New Calculation Engine for Clinical Investigations with Proton and Carbon Ion Beams at CNAO. Cancers (2018) 10:395. doi:10.3390/cancers10110395
22. Kopp B, Fuglsang Jensen M, Mein S, Hoffmann L, Nyström H, Falk M, et al. FRoG: An Independent Dose and LET D Prediction Tool for Proton Therapy at ProBeam Facilities. Med Phys (2020) 47:5274–86. doi:10.1002/mp.14417
23. Magro G, Mein S, Kopp B, Mastella E, Pella A, Ciocca M, et al. FRoG Dose Computation Meets Monte Carlo Accuracy for Proton Therapy Dose Calculation in Lung. Physica Med (2021) 86:66–74. doi:10.1016/j.ejmp.2021.05.021
24. Fuchs H, Moser P, Gröschl M, Georg D Magnetic Field Effects on Particle Beams and Their Implications for Dose Calculation in MR-Guided Particle Therapy. Med Phys (2017) 44:1149–56. doi:10.1002/mp.12105
25. Parodi K Vision 20/20: Positron Emission Tomography in Radiation Therapy Planning, Delivery, and Monitoring. Med Phys (2015) 42:7153–68. doi:10.1118/1.4935869
26. Parodi K, Paganetti H, Shih HA, Michaud S, Loeffler JS, DeLaney TF, et al. Patient Study of In Vivo Verification of Beam Delivery and Range, Using Positron Emission Tomography and Computed Tomography Imaging after Proton Therapy. Int J Radiat Oncol Biol Phys (2007) 68:920–34. doi:10.1016/j.ijrobp.2007.01.063
27. Parodi K, Polf JC In Vivo range Verification in Particle Therapy. Med Phys (2018) 45:e1036–e1050. doi:10.1002/mp.12960
28. Jia X, Schümann J, Paganetti H, Jiang SB GPU-based Fast Monte Carlo Dose Calculation for Proton Therapy. Phys Med Biol (2012) 57:7783–97. doi:10.1088/0031-9155/57/23/7783
29. Jia X, Pawlicki T, Murphy KT, Mundt AJ Proton Therapy Dose Calculations on GPU: Advances and Challenges. Translational Cancer Res (2012) 1:207–16. doi:10.3978/j.issn.2218-676X.2012.10.03
30. Giantsoudi D, Schuemann J, Jia X, Dowdell S, Jiang S, Paganetti H Validation of a GPU-Based Monte Carlo Code (gPMC) for Proton Radiation Therapy: Clinical Cases Study. Phys Med Biol (2015) 60:2257–69. doi:10.1088/0031-9155/60/6/2257
31. Schiavi A, Senzacqua M, Pioli S, Mairani A, Magro G, Molinelli S, et al. Fred: a GPU-Accelerated Fast-Monte Carlo Code for Rapid Treatment Plan Recalculation in Ion Beam Therapy. Phys Med Biol (2017) 62:7482–504. doi:10.1088/1361-6560/aa8134
32. Deng W, Younkin JE, Souris K, Huang S, Augustine K, Fatyga M, et al. Technical Note: Integrating an Open Source Monte Carlo Code "MCsquare" for Clinical Use in Intensity‐modulated Proton Therapy. Med Phys (2020) 47:2558–74. doi:10.1002/mp.14125
33. Tian Z, Shi F, Folkerts M, Qin N, Jiang SB, Jia X A GPU Opencl Based Cross-Platform Monte Carlo Dose Calculation Engine (Gomc). Phys Med Biol (2015) 60:7419–35. doi:10.1088/0031-9155/60/19/7419
34. Faddegon B, Ramos-Méndez J, Schuemann J, McNamara A, Shin J, Perl J, et al. The TOPAS Tool for Particle Simulation, a Monte Carlo Simulation Tool for Physics, Biology and Clinical Research. Physica Med (2020) 72:114–21. doi:10.1016/j.ejmp.2020.03.019
35. Oborn BM, Dowdell S, Metcalfe PE, Crozier S, Mohan R, Keall PJ Proton Beam Deflection in MRI fields: Implications for MRI-Guided Proton Therapy. Med Phys (2015) 42:2113–24. doi:10.1118/1.4916661
36. Padilla-Cabal F, Georg D, Fuchs H A Pencil Beam Algorithm for Magnetic Resonance Image-Guided Proton Therapy. Med Phys (2018) 45:2195–204. doi:10.1002/mp.12854
37. Schellhammer SM, Hoffmann AL, Gantz S, Smeets J, van der Kraaij E, Quets S, et al. Integrating a Low-Field Open MR Scanner with a Static Proton Research Beam Line: Proof of Concept. Phys Med Biol (2018) 63:23LT01. doi:10.1088/1361-6560/aaece8
38. Schellhammer SM, Hoffmann AL Prediction and Compensation of Magnetic Beam Deflection in MR-Integrated Proton Therapy: a Method Optimized Regarding Accuracy, Versatility and Speed. Phys Med Biol (2017) 62:1548–64. doi:10.1088/1361-6560/62/4/1548
39.GitHub, Google/Googletest (2021) Available from: https://github.com/google/googletest. (Accessed July 08, 2021).
40.GitHub, Google/Benchmark (2021) Available from: https://github.com/google/benchmark (Accessed July 08, 2021).
41.Boost C++ Libraries (2021) Available from: https://www.boost.org/ (Accessed July 09, 2021).
42.RapidXml (2009) Available from: http://rapidxml.sourceforge.net/ (Accessed July 08, 2021).
43. McCormick M, Liu X, Jomier J, Marion C, Ibanez L ITK: Enabling Reproducible Research and Open Science. Front Neuroinform (2014) 8:13. doi:10.3389/fninf.2014.00013
44. Wilkens T dicom.offis.de - Home (2018). [cited 2021 Jul 10]. Available from: https://dcmtk.org/.
45. Schneider U, Pedroni E, Lomax A The Calibration of CT Hounsfield Units for Radiotherapy Treatment Planning. Phys Med Biol (1996) 41:111–24. doi:10.1088/0031-9155/41/1/009
46. Parodi K, Ferrari A, Sommerer F, Paganetti H Clinical CT-based Calculations of Dose and Positron Emitter Distributions in Proton Therapy Using the FLUKA Monte Carlo Code. Phys Med Biol (2007) 52:3369–87. doi:10.1088/0031-9155/52/12/004
47. Qin N, Pinto M, Tian Z, Dedes G, Pompos A, Jiang SB, et al. Initial Development of goCMC: a GPU-Oriented Fast Cross-Platform Monte Carlo Engine for Carbon Ion Therapy. Phys Med Biol (2017) 62:3682–99. doi:10.1088/1361-6560/aa5d43
48. Parodi K, Mairani A, Sommerer F Monte Carlo-Based Parametrization of the Lateral Dose Spread for Clinical Treatment Planning of Scanned Proton and Carbon Ion Beams. J Radiat Res (2013) 54(1):i91–i96. doi:10.1093/jrr/rrt051
49. Tessonnier T, Marcelos T, Mairani A, Brons S, Parodi K Phase Space Generation for Proton and Carbon Ion Beams for External Users' Applications at the Heidelberg Ion Therapy Center. Front Oncol (2015) 5:297. doi:10.3389/fonc.2015.00297
50. Seltzer SM An Overview of ETRAN Monte Carlo Methods. In: Monte Carlo Transport of Electrons and Photons. Boston, MA: Springer (1988). p. 153–81. doi:10.1007/978-1-4613-1059-4_7
51. Alex F Bielajew. “Electron Transport in E and B Fields. In: Monte Carlo Transport of Electrons and Photons. Boston, MA: Springer (1988). p. 421–34.
52. Duff T, Burgess J, Christensen P, Hery C, Kensler A, Liani M, et al. Building an Orthonormal Basis, Revisited. J Comp Graphics Tech (2017) 6:1–8.
54. Fano U Penetration of Protons, Alpha Particles, and Mesons. Annu Rev Nucl Sci (1963) 13:1–66. doi:10.1146/annurev.ns.13.120163.000245
57. Chibani O New Algorithms for the Vavilov Distribution Calculation and the Corresponding Energy Loss Sampling. IEEE Trans Nucl Sci (1998) 45:2288–92. doi:10.1109/23.725266
58. Moliere G Theorie der Streuung schneller geladener Teilchen II Mehrfach-und Vielfachstreuung. Z für Naturforschung A (1948) 3:78–97. doi:10.1515/zna-1948-0203
59. Scott WT The Theory of Small-Angle Multiple Scattering of Fast Charged Particles. Rev Mod Phys (1963) 35:231–313. doi:10.1103/RevModPhys.35.231
60. Rossi B, Greisen K Cosmic-Ray Theory. Rev Mod Phys (1941) 13:240–309. doi:10.1103/RevModPhys.13.240
61. Highland VL Some Practical Remarks on Multiple Scattering. Nucl Instr Methods (1975) 129:497–9. doi:10.1016/0029-554x(75)90743-0
62. Frühwirth R, Regler M On the Quantitative Modelling of Core and Tails of Multiple Scattering by Gaussian Mixtures. Nucl Instr Methods Phys Res Section A: Acc Spectrometers, Detectors Associated Equipment (2001) 456:369–89. doi:10.1016/s0168-9002(00)00589-1
63. Bellinzona VE, Ciocca M, Embriaco A, Fontana A, Mairani A, Mori M, et al. On the Parametrization of Lateral Dose Profiles in Proton Radiation Therapy. Physica Med (2015) 31:484–92. doi:10.1016/j.ejmp.2015.05.004
64. Kuhn SE, Dodge GE A Fast Algorithm for Monte Carlo Simulations of Multiple Coulomb Scattering. Nucl Instr Methods Phys Res Section A: Acc Spectrometers, Detectors Associated Equipment (1992) 322:88–92. doi:10.1016/0168-9002(92)90361-7
65. Adelmann A, Calvo P, Frey M, Gsell A, Locans U, Metzger-Kraus C, et al. OPAL a Versatile Tool for Charged Particle Accelerator Simulations. arxiv:1905.06654 (2019).
66. Bellinzona VE A Non Gaussian Model for the Lateral Dose Evaluation in Hadrontherapy. [PhD thesis]. Ludwig-Maximillians-University Munich (2017).
67. Tripathi RK, Wilson JW, Cucinotta FA A Method for Calculating Proton-Nucleus Elastic Cross-Sections. Nucl Instr Methods Phys Res Section B: Beam Interactions Mater Atoms (2002) 194:229–36. doi:10.1016/s0168-583x(02)00690-0
68. Ranft J Estimation of Radiation Problems Around High-Energy Accelerators Using Calculations of the Hadronic cascade in Matter. Part Accel (1972) 3:129–61.
69. Tripathi RK, Cucinotta FA, Wilson JW Accurate Universal Parameterization of Absorption Cross Sections. Nucl Instr Methods Phys Res Section B: Beam Interactions Mater Atoms (1996) 117:347–9. doi:10.1016/0168-583X(96)00331-X
70. Tripathi RK, Cucinotta FA, Wilson JW Accurate Universal Parameterization of Absorption Cross Sections III - Light Systems. Nucl Instr Methods Phys Res Section B: Beam Interactions Mater Atoms (1999) 155:349–56. doi:10.1016/s0168-583x(99)00479-6
71. Tessonnier T, Mairani A, Brons S, Haberer T, Debus J, Parodi K Experimental Dosimetric Comparison of1H,4He,12C and16O Scanned Ion Beams. Phys Med Biol (2017) 62:3958–82. doi:10.1088/1361-6560/aa6516
72. Tessonnier T, Böhlen TT, Ceruti F, Ferrari A, Sala P, Brons S, et al. Dosimetric Verification in Water of a Monte Carlo Treatment Planning Tool for Proton, Helium, Carbon and Oxygen Ion Beams at the Heidelberg Ion Beam Therapy Center. Phys Med Biol (2017) 62:6579–94. doi:10.1088/1361-6560/aa7be4
73. Gajewski J, Garbacz M, Chang C-W, Czerska K, Durante M, Krah N, et al. Commissioning of GPU-Accelerated Monte Carlo Code FRED for Clinical Applications in Proton Therapy. Front Phys (2021) 8:403. doi:10.3389/fphy.2020.567300
74. Garbacz M, Battistoni G, Durante M, Gajewski J, Krah N, Patera V, et al. Proton Therapy Treatment Plan Verification in CCB Krakow Using Fred Monte Carlo TPS Tool. In: World Congress on Medical Physics and Biomedical Engineering 2018. Singapore: Springer (2019). p. 783–7. doi:10.1007/978-981-10-9035-6_144
Keywords: Monte Carlo (MC), dose calculation, radiotherapy, magnetic field, proton
Citation: Lysakovski P, Ferrari A, Tessonnier T, Besuglow J, Kopp B, Mein S, Haberer T, Debus J and Mairani A (2021) Development and Benchmarking of a Monte Carlo Dose Engine for Proton Radiation Therapy. Front. Phys. 9:741453. doi: 10.3389/fphy.2021.741453
Received: 14 July 2021; Accepted: 15 October 2021;
Published: 03 November 2021.
Edited by:
Miguel Antonio Cortés-Giraldo, Sevilla University, SpainReviewed by:
Adam Aitkenhead, The Christie National Health Service Foundation Trust, United KingdomMatteo Duranti, Istituto Nazionale di Fisica Nucleare di Perugia, Italy
Copyright © 2021 Lysakovski, Ferrari, Tessonnier, Besuglow, Kopp, Mein, Haberer, Debus and Mairani. This is an open-access article distributed under the terms of the Creative Commons Attribution License (CC BY). The use, distribution or reproduction in other forums is permitted, provided the original author(s) and the copyright owner(s) are credited and that the original publication in this journal is cited, in accordance with accepted academic practice. No use, distribution or reproduction is permitted which does not comply with these terms.
*Correspondence: Andrea Mairani, QW5kcmVhLk1haXJhbmlAbWVkLnVuaS1oZWlkZWxiZXJnLmRl
 Peter Lysakovski
 Alfredo Ferrari1
 Thomas Tessonnier
 Judith Besuglow
 Thomas Haberer
 Andrea Mairani