- 1Institute of Space Physics, Luoyang Normal University, Luoyang, China
- 2Henan Key Laboratory of Electromagnetic Transformation and Detection, Luoyang, China
The small-scale interplanetary magnetic flux ropes (SIMFRs) are common magnetic structures in the interplanetary space, yet their origination is still an open question. In this article, we surveyed 63 SIMFRs found within 6-day window around the heliospheric current sheet (HCS) and investigated their axial direction, as well as the local normal direction of the HCS. Results showed that the majority (48/63) of the SIMFRs were quasi-parallel to the associated HCS (i.e., the axial direction of SIMFRs was quasi-perpendicular to the normal direction of the associated HCS). They also showed that the SIMFRs quasi-parallel to the associated HCS statistically had shorter duration than the cases quasi-perpendicular. The results indicate that most of these SIMFRs may be generated in the nearby HCSs.
Highlights
1 Most of the small-scale interplanetary magnetic flux ropes were parallel to the nearby heliospheric current sheet.
2 Among the ropes parallel to the nearby heliospheric current sheet, the majority of the ropes had a short duration.
3 Most of the small-scale interplanetary magnetic flux ropes were generated within the nearby heliospheric current sheet.
Introduction
Magnetic flux ropes (MFRs) are a helical magnetic structure that is very common in solar corona, the interplanetary space, planetary ionosphere, and earth magnetosphere [1]. The interplanetary MFRs (IMFRs) play an important role in connecting the earth magnetosphere and the solar atmosphere. For example, it is found that IMFRs (e.g., magnetic cloud [MCs]) usually have strong geomagnetic effect [2–5]. Therefore, the generation, evolution, and propagation of IMFRs structure are important problems in research of solar-terrestrial space physics. According to the size and duration, IMFRs can generally be divided into two categories. One is large-scale MCs, whose diameter ranges from 0.2 to 0.4 AU near the Earth [2, 6–9]. The other one is small-scale IMFR (SIMFRs). Unlike large-scale MCs, the diameters of the SIMFRs are approximately 0.02 AU, and their durations are usually less than 12 h [10, 11, 34]. Moldwin et al. [12] first reported an SIMFR detected by Ulysses spacecraft near 5 AU. From then, SIMFRs have aroused researchers’ great interest. It is generally believed that the solar corona and interplanetary medium are two important source regions of SIMFRs [10, 11, 13–28, 30]. Moldwin et al. [13] found the SIMFRs and MCs had both similar and different characteristics, and they suggested that the SIMFRs and MCs are two different categories and have different source regions. Feng et al. [10] investigated the data of Wind during 1995–2005 and identified 144 IMFRs. They found that the diameters of these events showed a continuous distribution; thus, they proposed that all IMFRs had the same source regions, namely, originated from solar eruptions. Then, based on the counterstreaming suprathermal electrons (CSEs), the average ionized state distribution of iron or oxygen, and the interplanetary observational characteristics, the idea that the SIMFRs originated from the sun was adopted by many researchers [16, 19, 24]. And some researchers [29–32] have found direct observational evidence for some SIMFRs to come from solar explosive events. In addition, the view that SIMFRs could be generated by heliospheric current sheet (HCS) was also proposed by many studies based on the observational data [10, 13, 20, 33–35]. Magnetic reconnection is one of the important mechanisms forming MFRs. Figure 1 illustrates the formation of MFRs by multiple X-line reconnection in the x-z plane of the Geocentric Solar Ecliptic (GSE) coordinate system [36]. If SIMFRs were formed by magnetic field reconnection in the HCS, these SIMFRs should lie in the plane of HCS (i.e., the axis of the SIMFRs should be perpendicular to the normal of the HCS). Besides, as solar wind and structures embedded in it mainly move in the Sun–Earth line direction, assuming that the magnetic field points from the Sun to the Earth in the upper hemisphere and points from the Earth to the Sun on the bottom hemisphere, as illustrated in Figure 1, the spacecraft should detect negative to positive variation of the z component of the magnetic field. In this article, we surveyed SIMFRs detected near the HCS. The results indicated that most of these SIMFRs may be generated in the HCS.
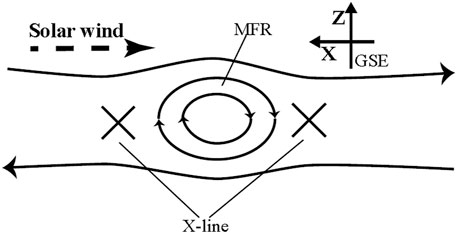
FIGURE 1. An illustration of a magnetic flux rope (MFR) formed by multiple X-line magnetic reconnection. The dashed arrowed line indicates the direction of the movement of the solar wind.
Data and Methods
In this study, the high-resolution magnetic field and plasma data are provided by instruments on Wind spacecraft. We used the magnetic field data from the Magnetic Field Investigation instrument and the plasma data from the WIND 3-D Plasma instrument, both with time resolution of 3s [37]. For events during which there are no plasma data from the WIND 3-D Plasma, data with time resolution of 92s from the Solar Wind Experiment [38] are used. The GSE coordinate system is used in this article, if not specified.
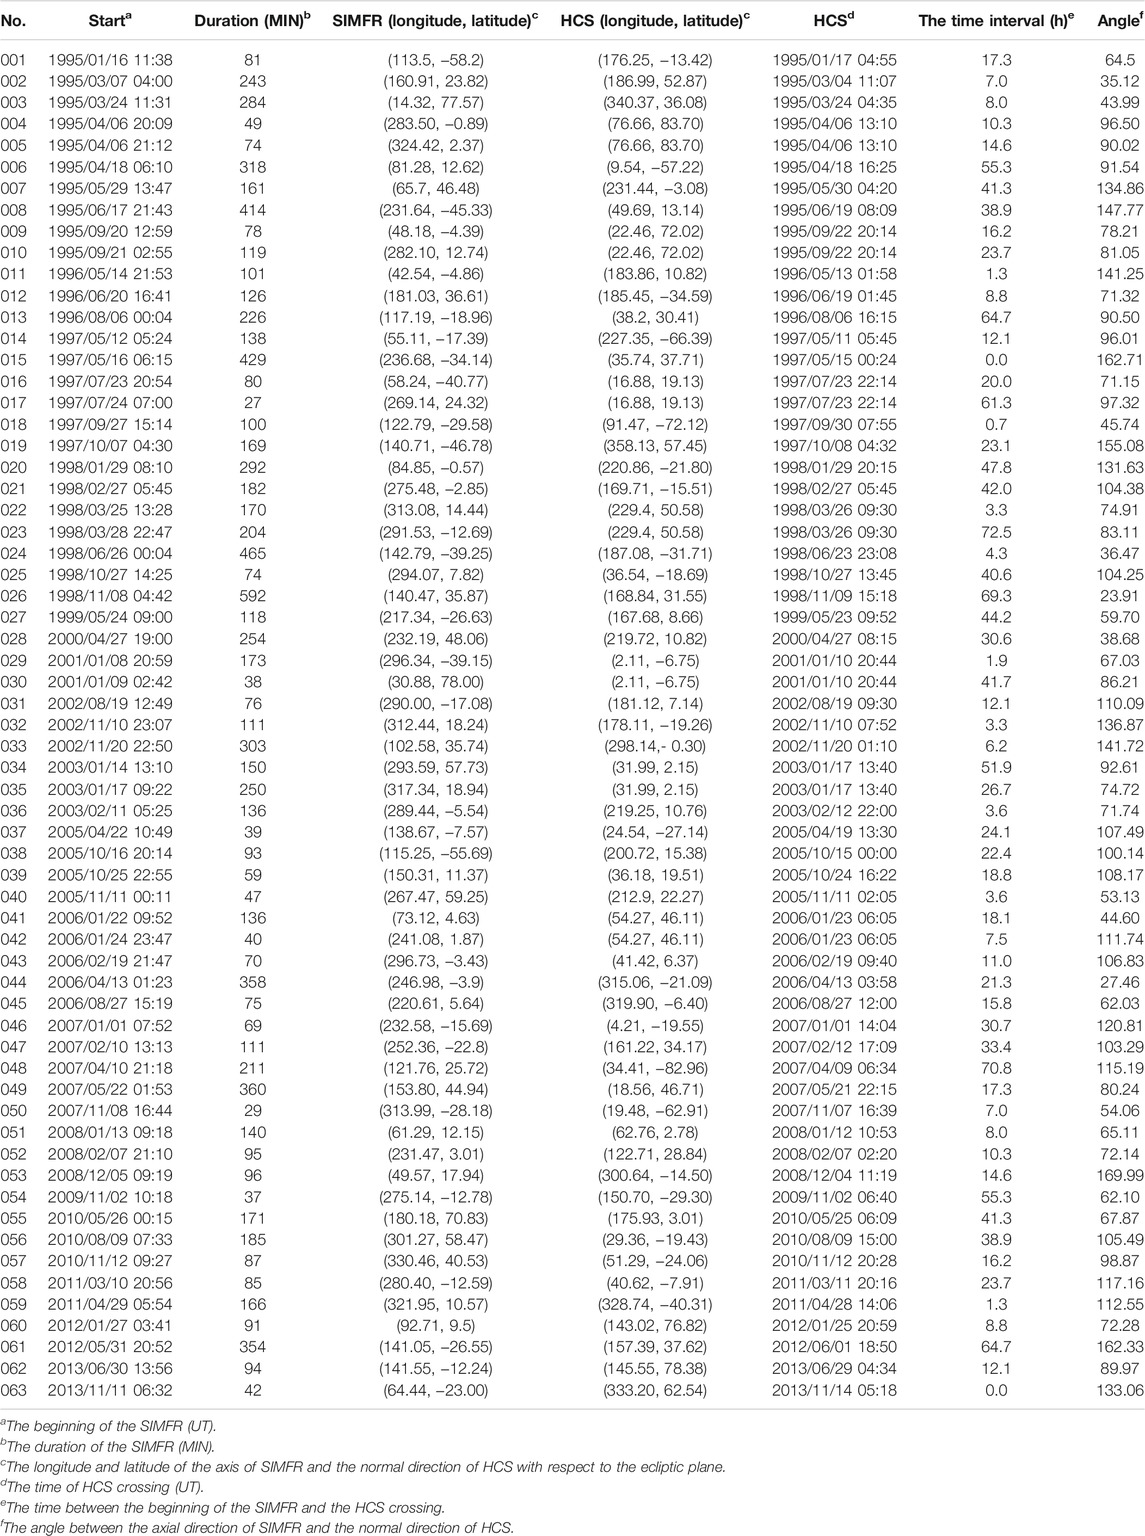
The SIMFRs studied in this article were detected by Wind from 1995 to 2013 in the vicinity of HCSs. The crossing of an HCS is identified by a flip in at least one component of the magnetic field, and the polarity of the magnetic field should be kept several hours or more before and after the flip. The width of the HCS is approximately 10,000 km near 1 AU, and its surrounding plasma sheet is approximately 30 times thicker [39]. The transit of the HCS varies from several seconds to hours [39]. However, due to, for example, waves, the spacecraft could cross the HCS several times in relatively short time interval. In such cases, the center one crossing would be considered as the crossing time of the HCS. Feng et al. [2015] shows that CSEs were found in most SIMFRs, and the CSEs usually are detected within 3 days of sector boundary [19, 40]. Therefore, we investigate SIMFRs found within 6-day window around HCS [19]. The identification of SIMFRs is based on a bipolar variation of the one component of the magnetic field and enhancement of the magnitude of magnetic field near the center of the bipolar variation. Part of the studied SIMFRs is adopted from the SIMFRs in the study of Feng et al. (2015) [19]. We estimate the axial direction of flux ropes using the Grad–Shafranov (G-S) reconstruction method [41–44]. The basic idea of the G-S method is that assuming a flux rope is two-dimensional and quasi-steady, the thermal pressure and the magnitude of the axial magnetic field should be constant along one magnetic field line in the plane perpendicular to the axial direction, according to the G-S equation [41]. The normal of the HCS was obtained by applying minimum variance analysis to the magnetic field data and that the minimum variance direction is thought to be the normal direction the HCS [45–47]. As the movement of the solar wind and the magnetic structures within it is mainly in the x direction, to improve the reliability of estimation of the normal direction of HCSs, only HCSs with the angle between the normal and the y directions within the range of 30°–150° are considered. Finally, we obtained a total of 63 cases, and the properties of these flux ropes are shown in Table 1. In Table 1, the second and third columns show the front boundary and duration of SIMFRs. The fourth and fifth columns show the longitude and latitude of the axis of SIMFRs and the normal direction of HCS with respect to the ecliptic plane. The sixth column shows the time when the spacecraft crosses the HCS. The seventh column shows the time difference between the beginning of the SIMFR and the HCS crossing. The eighth column shows the angle between the axis of SIMFRs and the normal direction of the associated HCSs.
Results
Figure 2 shows an example of an SIMFR in the vicinity of an HCS on February 27, 1998. From top to bottom, Figure 2 shows the pitch angle distribution of electrons with energy of 228 eV, the magnitude and the three components of the magnetic field, the angular coordinates of the magnetic field vector, the three components of velocity, the number density, the temperature of protons, and the plasma β values. From 04:45, the By component decreased from ∼+5 nT to zero around 05:45 and then changed sign and increased in magnitude. The pitch angle of electrons also changed from 0° to 180° around 05:45. Such a variation in the magnetic field is thought to be caused by crossing of an HCS. Just after crossing the HCS, the spacecraft detected a bipolar variation in the Bz component (varied from −5 to 5 nT). In the meantime, the magnitude of the magnetic field and the By component peaked. Therefore, the bipolar signal in Bz is thought to be caused by crossing of an MFR. The direction of the axis of the flux rope is (275.48°, −2.85°). The normal direction of the HCS is (169.71°, −15.51°). The angle between the axis of the flux rope and the normal of the HCS is 104.38, which means that the flux rope almost lied in the plane of the HCS. Consider the observations were made in the increasing phase of the 23rd solar cycle, the dipolar Bz varying from −5 to 5 nT is consistent with an MFR generated by magnetic reconnection in the HCS moving to further heliosphere.
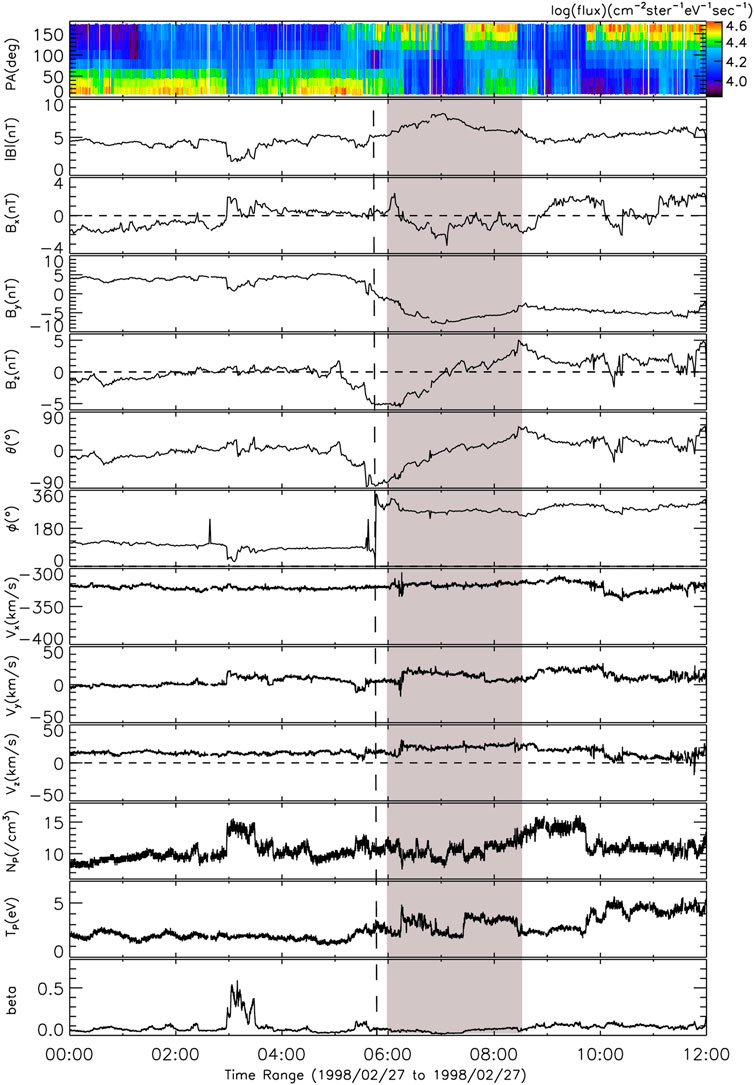
FIGURE 2. An example of a magnetic flux rope detected in the vicinity of an HCS on February 27, 1998. From top to bottom, the pitch angle distribution of electrons with energy of 228 eV, the magnitude and the three components of the magnetic field, the angular coordinates of the magnetic field vector, the three components of velocity, the number density, the temperature of protons, and the plasma β values. The vertical dashed line indicates the crossing time of the HCS by the space craft. The shadow region indicates the magnetic flux rope.
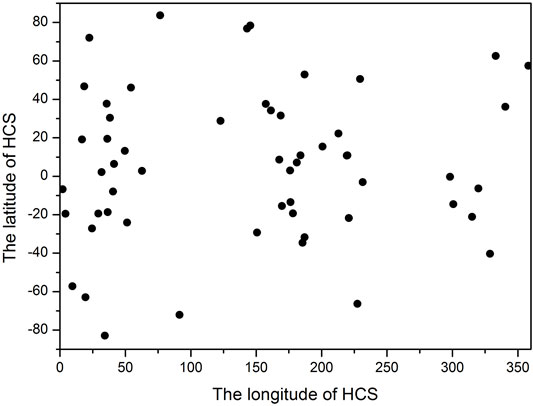
Figure 3 plots the distribution of the latitude and longitude of the normal direction of the HCSs. The distribution of the latitude is mainly in the range between −60° and 60°, which is reasonable, considering that the movement of the solar wind is mainly in the x direction, which make the detection of HCSs relatively difficult. The longitude of the HCS normal is mainly near 45° and 225°, which is not unexpected considering that the parker spiral angle is 135° at Earth. Figure 4 displays the distribution of the latitude and longitude of the axial direction of the studied flux ropes. The longitude of the axis ranges from 25° to 325°, whereas the latitude mainly lies between −60° and 60°.
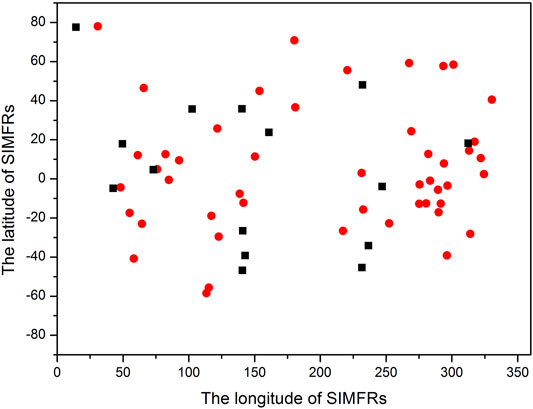
FIGURE 4. The distribution of the latitude and longitude of the axial direction of the studied SIMFRs. The red dots represent cases that the SIMFRs quasi-parallel to the associated HCS (CAT1). The black squares represent the SMIFRs of CAT2 category.
In order to explore the possible connection between SIMFRs and HCSs, the angle between the axis of the flux rope and the normal of the associated HCS is investigated. Based on the angle, the studied flux ropes are divided into two categories. The first category (CAT1) is for the flux ropes quasi-parallel to the HCS; that is, the angle between the axial direction of the flux ropes and the normal direction of the associated HCS are within the range of 45° and 135°. The other category (CAT2) is for ropes quasi-perpendicular to the HCS, and their angles are less than 45° or greater than 135°. A total of 48 flux ropes are found in the CAT1 category; the percentage is 76.2%. That is, most of SIMFRs were quasi-parallel to the associated HCS.
Out results also show that, among the ropes quasi-parallel to the associated HCS, the majority of the ropes have a short duration. Figure 5 presents the scatter plot of the angle between the axis of the rope and the normal of the associated HCS as a function of the duration of the flux ropes. The red dots represent the SIMFRs of CAT1 category, which are quasi-parallel to the HCS. The black squares represent the SMIFRs of CAT2 category. Based on the duration, one may find that, for ropes with duration less than 350 min, the ropes of CAT1 category dominated, and the ratio is 83.9% (47 of 56 ropes). For those with duration greater than 350 min, the ropes of CAT2 category dominated, and the ratio is 85.7% (six of seven ropes).
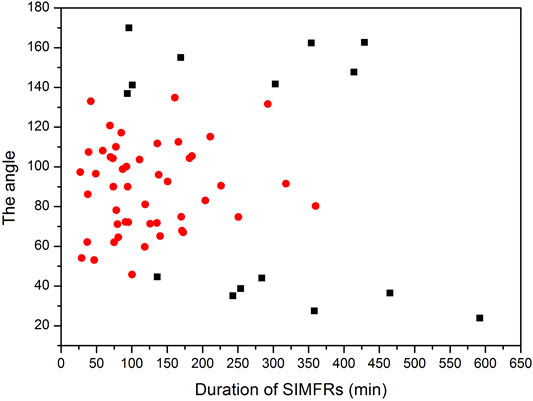
FIGURE 5. The distribution of the angle between the axis of the rope and the normal of the associated HCS as a function of the duration of the flux ropes. The red dots represent the SIMFRs of CAT1 category. The black squares represent SIMFRs of CAT2 category.
Figures 6, 7 plot the distributions of the plasma (proton) β and the average field magnitude of SIMFRs as a function of the angle between the axis of the rope and the normal of the associated HCS, respectively, where the red dots are for the SIMFRs of CAT1 category, and the black squares are for the SMIFRs of CAT2 category. Note that we only consider the size of the angle, the direction of the angle is ignored, and the range of the angle is from 0° to 90°. It seems that there was weak but negative relation between the plasma β and the angle, whereas there was positive relation between the average field magnitude and the angle.
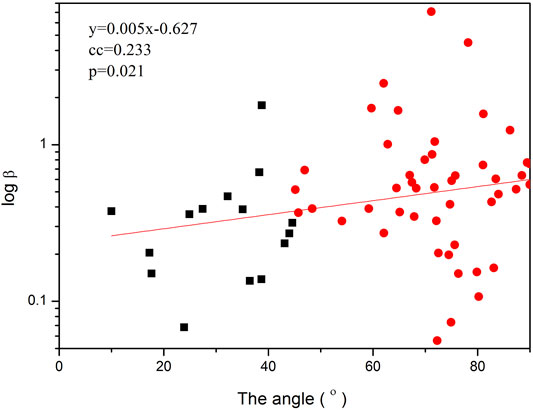
FIGURE 6. The distribution of plasma β with the angle between the axis of the rope and the normal of the associated HCS. The red dots represent the SIMFRs of CAT1 category. The black squares represent SIMFRs of CAT2 category. The correlation coefficient (cc) and p value (p) are shown in the upper left corner.
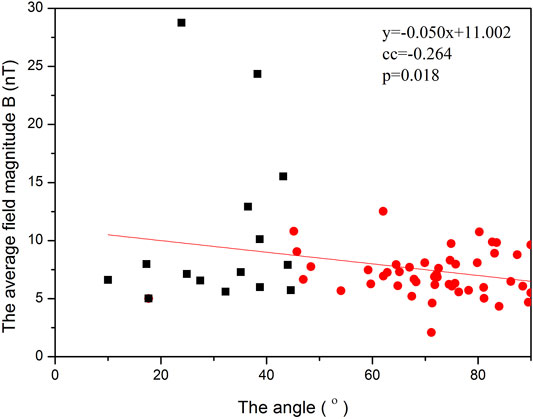
FIGURE 7. The distribution of the average field magnitude with the angle between the axis of the rope and the normal of the associated HCS. The red dots represent the SIMFRs of CAT1 category. The black squares represent SIMFRs of CAT2 category. The correlation coefficient (cc) and p value (p) are shown in the upper right corner.
Assuming that one SIMFR was generated by HCS magnetic reconnection and lay in the HCS plane. The spacecraft traversing it should detect south-to-north (SN) or north-to-south (NS) variation of the z component of the magnetic field (Bz) [11]. Furthermore, as Janivier et al. [2014] pointed out that the variation of Bz depends on the globe solar dipole magnetic field [21, 48]. The change of the sign of the global solar dipole happens typically 1 year after the solar maximum (∼2003 years in this work) [49]. Figure 8 shows the distributions of the two-type variation of the Bz component of CAT1 category flux ropes with the angle range from 60°””” to 120°. One can see that before the year of 2003, the ratio of SN to NS type was 3:1 and became 1:2 after 2003.
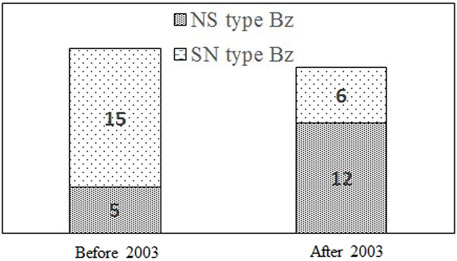
FIGURE 8. The distribution of the Bz type of the SIMFRs with axial direction near the y direction. The left (right) histogram represents SIMFRs observed before (after) 2003.
Summary and Discussion
SIMFRs are common structures in the interplanetary space and play an important role in space weather [16]. Determining the source region of SIMFRs is important for understanding of their generation and evolution. In this article, we surveyed the axial distribution of SIMFRs detected within 6-day window around HCS and found that most of the ropes (76.2%) was quasi-parallel to the HCS. If SIMFRs are originated from HCS (e.g., generated during magnetic reconnection), then the axis of the ropes should tend to have large angle (be perpendicular) to the normal of the associated current sheet [11]. Therefore, our result indicated that these flux ropes detected near the HCSs may be generated within the HCS. Except for the angle distribution feature, the scales of flux ropes originated in HCS should also be limited by the thickness of the HCS bearing them [11, 21]. From Figure 4, one can see that for most of the ropes (56 of 63 ropes) with short duration (<350 min), and most of these ropes (47 of 56 ropes) are quasi-parallel to the associated HCS. While for those with long duration (>400 min), the ropes are all quasi-perpendicular to the HCS. That is, these short-duration flux ropes are probably generated within the associated HCSs. For those long-duration ropes, the angle distribution is not consistent with those predicted by HCS magnetic reconnection. These ropes may have their source region in the solar corona.
The total average plasma β of CAT1 and CAT2 ropes was
The data studied in this work cover the whole 23rd solar cycle and the increasing phase of the 24th solar cycle. According to Janivier et al. [2014], if SIMFRs are formed in HCS, the dominate type of SIMFRs (i.e., the variation of Bz) should be different in different phase of solar cycle. We selected the variation of Bz of flux ropes with the angle range from 60° to 120° in the CAT1 category, and then comparing them before and after the time when the sign of the global solar dipole field changes (∼2003 years), we found that the SN type dominated before 2003, whereas after 2003, the NS type dominated. Such a change was consistent with the magnetic topology of HCS during this period and thus consistent with the conclusion that MFRs of CAT1 may be generated in HCS. Moldwin et al. [2008] found no dependence of variation of Bz of SIMFRs on solar cycle, which is inconsistent with the result present here. The possible reason of such contrary is that unlike in the study by Moldwin et al. [2008], this article only focuses on the SIMFRs near the HCS.
In summary, we surveyed the SIMFRs detected within 6-day window around HCS. The results indicate that most of these SIMFRs may have their source region within the HCS.
Data Availability Statement
Publicly available datasets were analyzed in this study. This data can be found here: http://cdaweb.gsfc.nasa.gov/cdaweb/istp_public/.
Author Contributions
QL drafted the manuscript and led the observational analysis. YZ and GZ provided heuristic advice and revised the manuscript. All authors contributed to the interpretation of the results and helped draft the manuscript.
Funding
This work is also supported in part by the Plan for Scientific Innovation Talent of Henan Province (No. 174100510019).
Conflict of Interest
The authors declare that the research was conducted in the absence of any commercial or financial relationships that could be construed as a potential conflict of interest.
Publisher’s Note
All claims expressed in this article are solely those of the authors and do not necessarily represent those of their affiliated organizations, or those of the publisher, the editors and the reviewers. Any product that may be evaluated in this article, or claim that may be made by its manufacturer, is not guaranteed or endorsed by the publisher.
Acknowledgments
We acknowledge supports from NSFC under Grant Nos.: 41674170, 41974197, and 41874204. We thank NASA/GSFC for the use of data from the Wind spacecraft mission, which are available freely from the Coordinated Data Analysis Web (https://cdaweb.gsfc.nasa.gov/misc/NotesW.html).
References
1. Russell CT, Priest ER, Lee L-C. Physics of Magnetic Flux Ropes. Washington, D.C.: American Geophysical Union (1990).
2. Burlaga LF. Magnetic Clouds and Force-free fields with Constant Alpha. J Geophys Res (1988) 93(A7):7217–24. doi:10.1029/JA093iA07p07217
3. Feng HQ, Chao JK, Lyu LH, Lee LC. The Relationship between Small Interplanetary Magnetic Flux Rope and the Substorm Expansion Phase. J Geophys Res (2010) 115:A09108. doi:10.1029/2009ja015191
4. Gonzalez WD, Tsurutani BT, Clúa de Gonzalez AL. Interplanetary Origin of Magnetic Storms. Space Sci Rev (1999) 88:529–62. doi:10.1023/A:1005160129098
5. Gonzalez WD, Echer E, Clua-Gonzalez AL, Tsurutani BT. Interplanetary Origin of Intense Geomagnetic Storms (Dst. Geophys Res Lett (2007) 34:340. doi:10.1029/2006GL028879
6. Burlaga L, Sittler E, Mariani F, Schwenn R. Magnetic Loop behind an Interplanetary Shock: Voyager, Helios, and IMP 8 Observations. J Geophys Res (1981) 86:6673–84. doi:10.1029/JA086iA08p06673
7. Bothmer V, Schwenn R. The Structure and Origin of Magnetic Clouds in the Solar Wind. Ann Geophys (1998) 16:1–24. doi:10.1007/s00585-997-0001-x
8. Goldstein H. On the Field Configuration in Magnetic Clouds. In: M Neugebauer, editor. Solar Wind Five, 2280. Pasadena, CA: NASA Conf. Publ. (1983). p. 731–3.
9. Lepping RP, Jones JA, Burlaga LF. Magnetic Field Structure of Interplanetary Magnetic Clouds at 1 AU. J Geophys Res (1990) 95(A8):11957–65. doi:10.1029/JA095iA08p11957
10. Feng HQ, Wu DJ, Chao JK. Size and Energy Distributions of Interplanetary Magnetic Flux Ropes. J Geophys Res (2007) 112:a–n. doi:10.1029/2006JA011962
11. Cartwright M, Moldwin M. Comparison of Small-Scale Flux Rope Magnetic Properties to Large-Scale Magnetic Clouds: Evidence for Reconnection across the HCS? J Geophys Res Space Phys (2008) 113(A9). doi:10.1029/2008ja013389
12. Moldwin MB, Phillips JL, Gosling JT, Scime EE, McComas DJ, Bame SJ, et al. Ulysses Observation of a Noncoronal Mass Ejection Flux Rope: Evidence of Interplanetary Magnetic Reconnection. J Geophys Res (1995) 100(A10):19903–10. doi:10.1029/95ja01123
13. Moldwin MB, Ford S, Lepping R, Slavin J, Szabo A. Small-scale Magnetic Flux Ropes in the Solar Wind. Geophys Res Lett (2000) 27(1):57–60. doi:10.1029/1999GL010724
14. Feng HQ, Wu DJ, Lin CC, Chao JK, Lee LC, Lyu LH. Interplanetary Small- and Intermediate-Sized Magnetic Flux Ropes during 1995-2005. J Geophys Res (2008) 113:a–n. doi:10.1029/2008JA013103
15. Feng HQ, Wu DJ. Observations of a Small Interplanetary Magnetic Flux Rope Associated with a Magnetic Reconnection Exhaust. ApJ (2009) 705(2):1385–7. doi:10.1088/0004-637x/705/2/1385
16. Feng HQ, Wang JM. Observations of Several Unusual Plasma Compositional Signatures within Small Interplanetary Magnetic Flux Ropes. Astrophys J (2010) 809:11. doi:10.1088/0004-637X/809/2/112
17. Feng HQ, Wu DJ, Wang JM, Chao JW. Magnetic Reconnection Exhausts at the Boundaries of Small Interplanetary Magnetic Flux Ropes. A&A (2011) 527:A67. doi:10.1051/0004-6361/201014473
18. Feng H, Wang J, Wu D. The Evidence for the Evolution of Interplanetary Small Flux Ropes: Boundary Layers. Chin Sci Bull (2012) 57:1415–20. doi:10.1007/s11434-011-4960-7
19. Feng HQ, Zhao GQ, Wang JM. Counterstreaming Electrons in Small Interplanetary Magnetic Flux Ropes. J Geophys Res Space Phys (2015) 120:175–10. doi:10.1002/2015JA021643
20. Tian H, Yao S, Zong Q, He J, Qi Y. Signatures of Magnetic Reconnection at Boundaries of Interplanetary Small-Scale Magnetic Flux Ropes. ApJ (2010) 720(1):454–64. doi:10.1088/0004-637x/720/1/454
21. Janvier M, Démoulin P, Dasso S. In Situ properties of Small and Large Flux Ropes in the Solar Wind. J Geophys Res Space Phys (2014) 119(9):7088–107. doi:10.1002/2014ja020218
22. Janvier M, Démoulin P, Dasso S. Are There Different Populations of Flux Ropes in the Solar Wind? Sol Phys (2014) 289(7):2633–52. doi:10.1007/s11207-014-0486-x
23. Huang J, Liu YCM, Peng J, Li H, Klecker B, Farrugia CJ, et al. A Multispacecraft Study of a Small Flux Rope Entrained by Rolling Back Magnetic Field Lines. J Geophys Res Space Phys (2017) 122:6927–39. doi:10.1002/2017JA023906
24. Huang J, Liu YC-M, Peng J, Qi Z, Li H, Klecker B, et al. The Distributions of Iron Average Charge States in Small Flux Ropes in Interplanetary Space: Clues to Their Twisted Structures. J Geophys Res Space Phys (2018) 123:7167–80. doi:10.1029/2018ja025660
25. Zhao Y, Feng H, Liu Q, Zhao G. Coalescence of Magnetic Flux Ropes within Interplanetary Coronal Mass Ejections: Multi-Cases Studies. Front Phys (2019) 7:151. doi:10.3389/fphy.2019.00151
26. Xu M, Shen C, Hu Q, Wang Y, Chi Y. Whether Small Flux Ropes and Magnetic Clouds Have the Same Origin: A Statistical Study of Small Flux Ropes in Different Types of Solar Wind. ApJ (2020) 904:122. doi:10.3847/1538-4357/abbe21
27. Yu W, Farrugia CJ, Lugaz N, Galvin AB, J. Kilpua EK, Kucharek H, et al. A Statistical Analysis of Properties of Small Transients in the Solar Wind 2007-2009: STEREO and Wind Observations. J Geophys Res Space Phys (2014) 119:689–708. doi:10.1002/2013JA019115
28. Kilpua EKJ, Jian LK, Li Y, Luhmann JG, Russell CT. Observations of ICMEs and ICME-like Solar Wind Structures from 2007 - 2010 Using Near-Earth and STEREO Observations. Sol Phys (2012) 281:391–409. doi:10.1007/s11207-012-9957-0
29. Rouillard AP, Savani NP, Davies JA, Lavraud B, Forsyth RJ, Morley SK, et al. A Multispacecraft Analysis of a Small-Scale Transient Entrained by Solar Wind Streams. Sol Phys (2009) 256:307–26. doi:10.1007/s11207-009-9329-6
30. Rouillard AP, Sheeley NR, Cooper TJ, Davies JA, Lavraud B, Kilpua EKJ, et al. The Solar Origin of Small Interplanetary Transients. ApJ (2011) 734:7. doi:10.1088/0004-637x/734/1/7
31. Mandrini CH, Pohjolainen S, Dasso S, Green LM, Démoulin P, van Driel-Gesztelyi L, et al. Interplanetary Flux Rope Ejected from an X-ray Bright point. A&A (2005) 434:725–40. doi:10.1051/0004-6361:20041079
32. Chi Y, Zhang J, Shen C, Hess P, Liu L, Mishra W, et al. Observational Study of an Earth-Affecting Problematic ICME from STEREO. ApJ (2018) 863:108. doi:10.3847/1538-4357/aacf44
33. Cartwright ML, Moldwin MB. Heliospheric Evolution of Solar Wind Small-Scale Magnetic Flux Ropes. J Geophys Res (2010) 115:A08102. doi:10.1029/2009ja014271
34. Wang JM, Feng HQ, Zhao GQ. Observations of a Small Interplanetary Magnetic Flux Rope Opening by Interchange Reconnection. ApJ (2018) 853:94. doi:10.3847/1538-4357/aaa131
35. Zheng J, Hu Q. Observational Evidence for Self-Generation of Small-Scale Magnetic Flux Ropes from Intermittent Solar Wind Turbulence. ApJ (2018) 852:L23. doi:10.3847/2041-8213/aaa3d7
36. Lee LC, Fu ZF. A Theory of Magnetic Flux Transfer at the Earth's Magnetopause. Geophys Res Lett (2013) 12:105–8. doi:10.1029/GL012i002p00105
37. Lepping RP, Acũna MH, Burlaga LF, Farrell WM, Slavin JA, Schatten KH, et al. The Wind Magnetic Field Investigation. Space Sci Rev (1995) 71:207–29. doi:10.1007/BF00751330
38. Ogilvie KW, Chornay DJ, Fritzenreiter RJ, Hunsaker F, Keller J, Lobell J, et al. SWE, a Comprehensive Plasma Instrument for the WIND Spacecraft. Space Sci Rev (1995) 71:55–77. doi:10.1007/BF00751326
39. Smith EJ. The Heliospheric Current Sheet. J Geophys Res (2001) 106:819–15832. doi:10.1029/2000ja000120
40. Shodhan S, Crooker NU, Kahler SW, Fitzenreiter RJ, Larson DE, Lepping RP, et al. Counterstreaming Electrons in Magnetic Clouds. J Geophys Res (2000) 105:27261–8. doi:10.1029/2000JA000060
41. Hu Q, Sonnerup BUÖ. Reconstruction of Magnetic Flux Ropes in the Solar Wind. Geophys Res Lett (2001) 28:467–70. doi:10.1029/2000gl012232
42. Hu Q, Bu Ö S. Reconstruction of Magnetic Clouds in the Solar Wind: Orientations and Configurations. J Geophys Res (2002) 107(A7):1142. doi:10.1029/2001JA000293
43. Hu Q, Smith CW, Ness NF, Skoug RM. Double Flux-Rope Magnetic Cloud in the Solar Wind at 1 AU. Geophys Res Lett (2003) 30(7):1385. doi:10.1029/2002GL016653
44. Hu Q, Smith CW, Ness NF, Skoug RM. Multiple Flux Rope Magnetic Ejecta in the Solar Wind. J Geophys Res (2004) 109:A03102. doi:10.1029/2003JA010101
45. Sonnerup BUÖ, Cahill LJ. Magnetopause Structure and Attitude from Explorer 12 Observations. J Geophys Res (1967) 72:171. doi:10.1029/JZ072i001p00171
46. Sonnerup BUÖ, Guo M. Magnetopause Transects. Geophys Res Lett (1996) 23:3679–82. doi:10.1029/96gl03573
47. Sonnerup BUÖ, Scheible M. Minimum and Maximum Variance Analysis (1998). Bern, Switzerland: ISSI Scientific Reports Series
48. Yan L, Luhmann J. Solar Cycle Control of the Magnetic Cloud Polarity and the Geoeffectiveness. J Atmos Solar-Terrestrial Phys (2004) 66(3-4):323–31. doi:10.1016/j.jastp.2003.12.001
Keywords: interplanetary magnetic structure, interplanetary current sheet, magnetic reconnection, solar wind, reconnection exhaust
Citation: Liu Q, Zhao Y and Zhao G (2021) Statistical Study of Small-Scale Interplanetary Magnetic Flux Ropes in the Vicinity of the Heliospheric Current Sheet. Front. Phys. 9:745152. doi: 10.3389/fphy.2021.745152
Received: 21 July 2021; Accepted: 07 October 2021;
Published: 11 November 2021.
Edited by:
Hongqiang Song, Shandong University, ChinaReviewed by:
Mengjiao Xu, University of Science and Technology of China, ChinaEmilia Kilpua, University of Helsinki, Finland
Copyright © 2021 Liu, Zhao and Zhao. This is an open-access article distributed under the terms of the Creative Commons Attribution License (CC BY). The use, distribution or reproduction in other forums is permitted, provided the original author(s) and the copyright owner(s) are credited and that the original publication in this journal is cited, in accordance with accepted academic practice. No use, distribution or reproduction is permitted which does not comply with these terms.
*Correspondence: Qiang Liu, bGl1cTUyM0AxNjMuY29t
 Qiang Liu
 Yan Zhao
 Guoqing Zhao