 Jianchao Xue
 - 1Key Laboratory of Dark Matter and Space Astronomy, Purple Mountain Observatory, Chinese Academy of Sciences, Nanjing, China
- 2School of Astronomy and Space Science, University of Science and Technology of China, Hefei, China
Prominence eruption is closely related to coronal mass ejections and is an important topic in solar physics. Spectroscopic observation is an effective way to explore the plasma properties, but the spectral observations of eruptive prominences are rare. In this paper we will introduce an eruptive polar crown prominence with spectral observations from the Interface Region Imaging Spectrograph (IRIS), and try to explain some phenomena that are rarely reported in previous works. The eruptive prominence experiences a slow-rise and fast-rise phase, while the line-of-sight motions of the prominence plasma could be divided into three periods: 2 hours before the fast-rise phase, opposite Doppler shifts are found at the two sides of the prominence axis; then, red shifts dominate the prominence gradually; in the fast-rise phase, the prominence gets to be blue-shifted. During the second period, a faint component appears in Mg ii k window with a narrow line width and a large red shift. A faint region is also found in AIA
1 Introduction
Solar prominences are composed of cold and dense plasma suspended in the hot corona [1–4]. Prominence eruptions have a close relationship with flares and coronal mass ejections (CMEs), and the latter two phenomena are main causes of the space weather storms. Hence studying the triggering mechanism and evolution of prominence eruptions are important topics in solar physics. Spectroscopic observation is an effective way to reveal plasma properties and line-of-sight (LOS) motions. However, high-quality spectral data of eruptive prominences are rare due to limited field of view (FOV) of general spectroscopic observations and randomness of prominence eruptions.
The Interface Region Imaging Spectrograph (IRIS [5]), is a small explorer spacecraft launched in 2013 June. It provides simultaneous high-resolution spectral and imaging data from the photosphere to the corona. The IRIS especially has an advantage of observing chromosphere and transition region with some strong resonance lines of Mg ii (temperature of formation of log T [K] ∼ 4.0), C ii (log T [K] ∼ 4.3), and Si iv (log T [K] ∼ 4.8). The prominence core has a chromospheric temperature, and prominence also has a prominence-corona transition region (PCTR). So the IRIS is also suitable to observe prominences and filaments. The IRIS has been widely used to study the dynamics of quiescent prominences [6–9], but the spectroscopic observations of eruptive prominences are still rare. Among the few works [10], reported an erupting prominence in active region using IRIS observations; the authors found a faint component with a LOS velocity up to 460 km s−1, and revealed the unwinding motions during the prominence eruption [11]. studied an eruptive prominence in quiet region with radiative transfer computations; they derived the electron densities of the prominence between 1.3 × 10⁹ and 6.0 × 1010 cm−3, the mean temperature around 1.1 × 10⁴ K, and the total hydrogen mass between 1.3 × 10¹⁴ and 3.2 × 10¹⁴ g.
In this work, we focus on the spectral evolution of an eruptive polar crown prominence (the prominence located at high latitude) on 2015 April 28th, which erupts successfully with a CME. The high-quality IRIS observations reveal some phenomena that have not been reported, and we try to give reasonable explanations on them. This event was studied by Reference [12] using extreme ultraviolet (EUV) images, who were interested in the outflows within the dimming region and proposed that the outflows are the origin of CME-induced solar wind. Dai et al. (submitted) used EUV images to explore the eruption mechanism of this event, and thought that the eruption is related to the prominence oscillation and mass drainage. Our paper is organized as follows: Section 2 introduces the observations and data reduction; Section 3 shows the prominence eruption process and its spectral features; we give our explanations on some observed phenomena in Section 4, which is followed by conclusion in Section 5.
2 Observations and Data Reduction
An eruption of a polar crown prominence on 2015 April 28th was well observed by the IRIS. Figure 1A-E show the snapshots of the eruptive prominence in EUV images from the Atmospheric Imaging Assembly (AIA [13]), onboard the Solar Dynamics Observatory (SDO [14]). The observational channels and times are denoted in each panel. The IRIS observations were carried out between 10:59–14:54 UT with 24 large coarse raster scans, and each scan had 64 × 2″ raster steps. The binned pixel size along the raster slit is 0.33″, the same as the slit width. The resulting FOV is 126″ × 119″ centered at − 742″ east and 666″ north (see the blue rectangle in Figure 1B). In the snapshot of a slit-jaw image (SJI) at
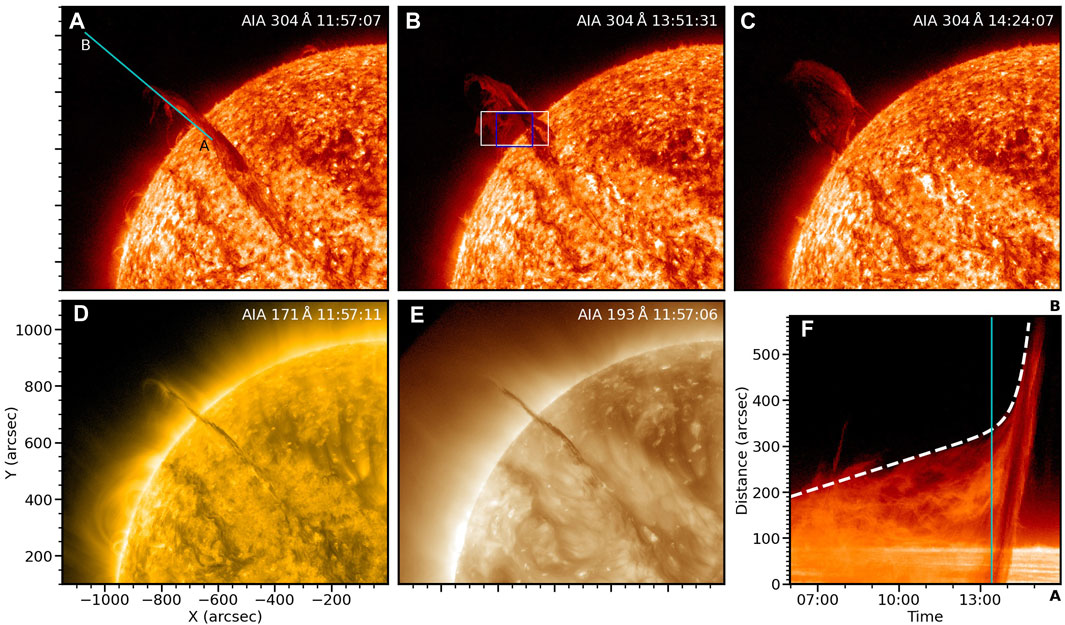
FIGURE 1. Evolution of the eruptive prominence in EUV images. (A–C) AIA
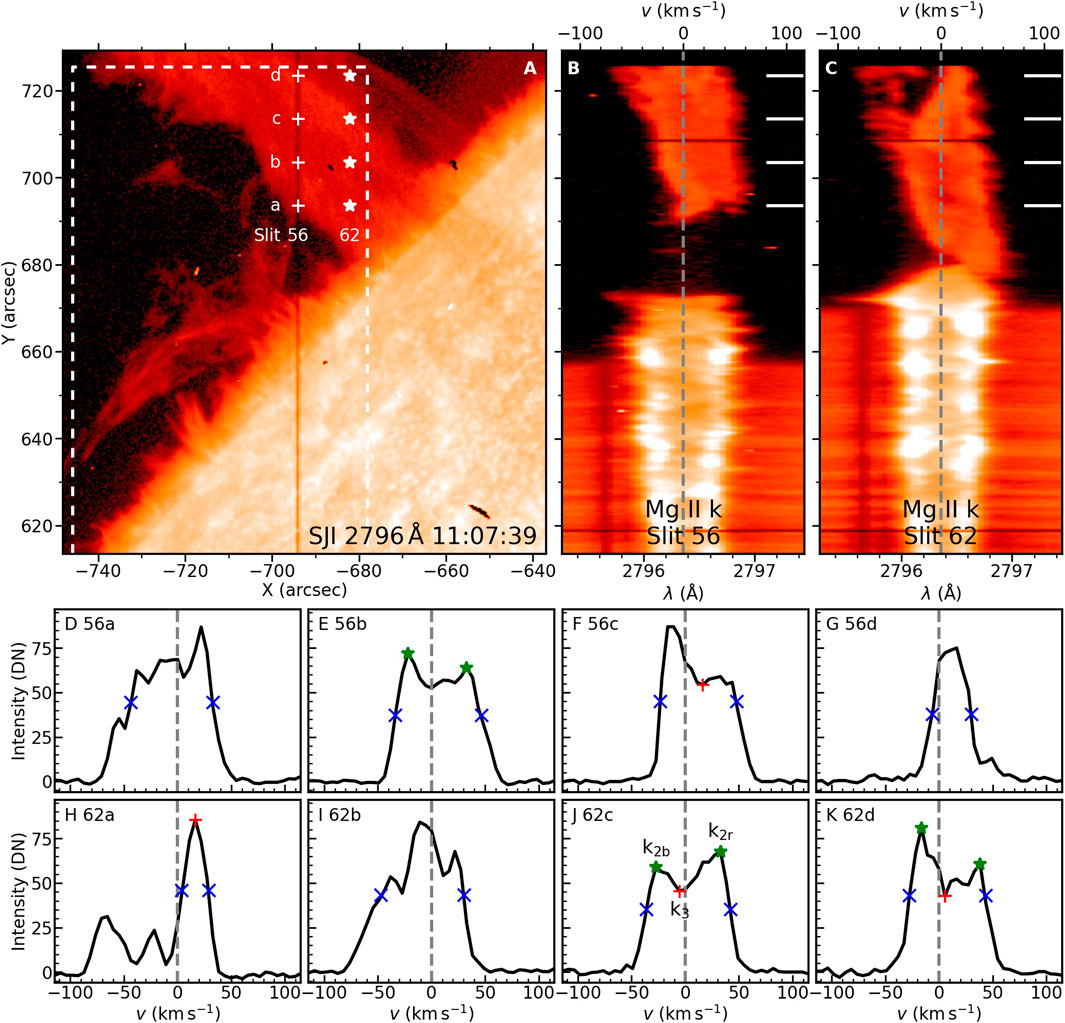
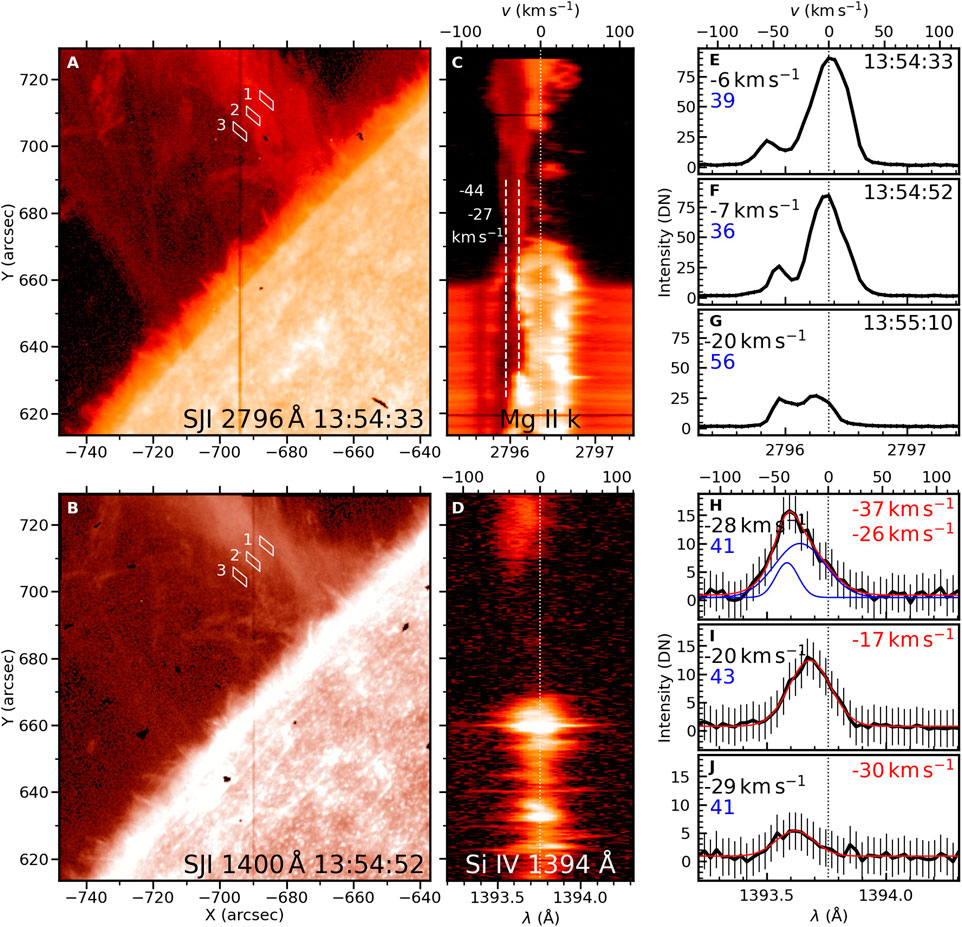
FIGURE 2. Estimation of LOS velocities from Mg ii k line profiles. (A) SJI
IRIS level 2 data are used, for which dark current and offsets are removed, flat field is corrected, and geometric and wavelength calibrations (for spectrograph channels) are done. The FOV of SJIs is checked by comparing them with the AIA
EUV images from the SDO/AIA and LOS magnetograms from the SDO/HMI (Helioseismic and Magnetic Imager [15]), are used. The former has pixel size of 0.6″ and temporal resolution of 12 s; the latter has pixel size of 0.5″. Both AIA and HMI images are processed to level 1.5.
2.1 Estimation of Prominence LOS Velocity
It is almost impossible to describe LOS (Doppler) velocities of a prominence strictly, due to that a prominence consists of many threads with different velocities [6, 8]. For optically thin lines, such as Si iv
The center of gravity (COG) method can be used to derive the Doppler shifts of purely absorption (photospheric lines [21]) or purely emission lines. When there are multi-velocity components in a spectral profile, the COG method gives a weighted average result. However, the COG method is physically wrong for the emission profiles with central reversals, although this method is sometimes still useful in such case [11]. The COG method is expressed as
where vD is Doppler velocity, I is intensity, C is continuum, and wavelength λ is converted into velocity (v) in the unit of “km s−1” using
in which λ0 is the rest wavelength and c is the light speed.
To check the reliability of the COG method, we compare it with the methods proposed by Ref. [20]. Figure 2A is a slit-jaw

TABLE 1. Estimation of LOS velocities of the eight profiles shown in Figure 2D–K using different methods: shift of k3, average shift of k2b and k2r, average shift at half maximum, and COG. The velocities are in the unit of “km s−1”.
We will see that some Mg ii k line profiles are reversed deeply during the prominence eruption. In most cases, the signs of LOS velocities derived from the COG method are generally consistent with the images of the spectra. We will give quantitative results using Gaussian fitting or directly from the images of the spectra, and use the COG method to derive LOS velocities statistically (not physically for profiles with self-absorption) and qualitatively.
3 Results
3.1 Eruption Overview
The long filament, when the prominence is seen against the solar disk, extends from nearly solar disk center to beyond the northeastern solar limb on 2015 April 28th. Figure 1A–E show its EUV images, including the eruption process in AIA
where h represents height, t is time, t0 is arbitrary, and τ, c0, c1, c2 are parameters obtained by fitting. The obtained initial rise speed is c1 = 3.78 km s−1, and the erupting speed at the end of our tracking is ∼ 103 km s−1. Onset of the fast-rise phase is defined by
which is calculated to be 13:25:30 UT (the cyan vertical line in Figure 1F).
3.2 Spectral Evolution
We have seen in Figure 2 around 11:07 UT that the top part of the raster is slightly blue-shifted and the lower part of the prominence is red-shifted. In this section, we will introduce the spectral evolution, especially the variations of LOS velocities of the erupting prominence in detail. Figure 3 shows IRIS observations around 11:17 UT (the second raster scan), including SJI snapshots (Figure 3 left column), images of the spectra along the dark slit in Figure 3A (middle), and spectral profiles (right) of the Mg ii k line (upper part) and the Si iv line (lower part), respectively. Comparing the prominence images in the two wavelengths, SJI
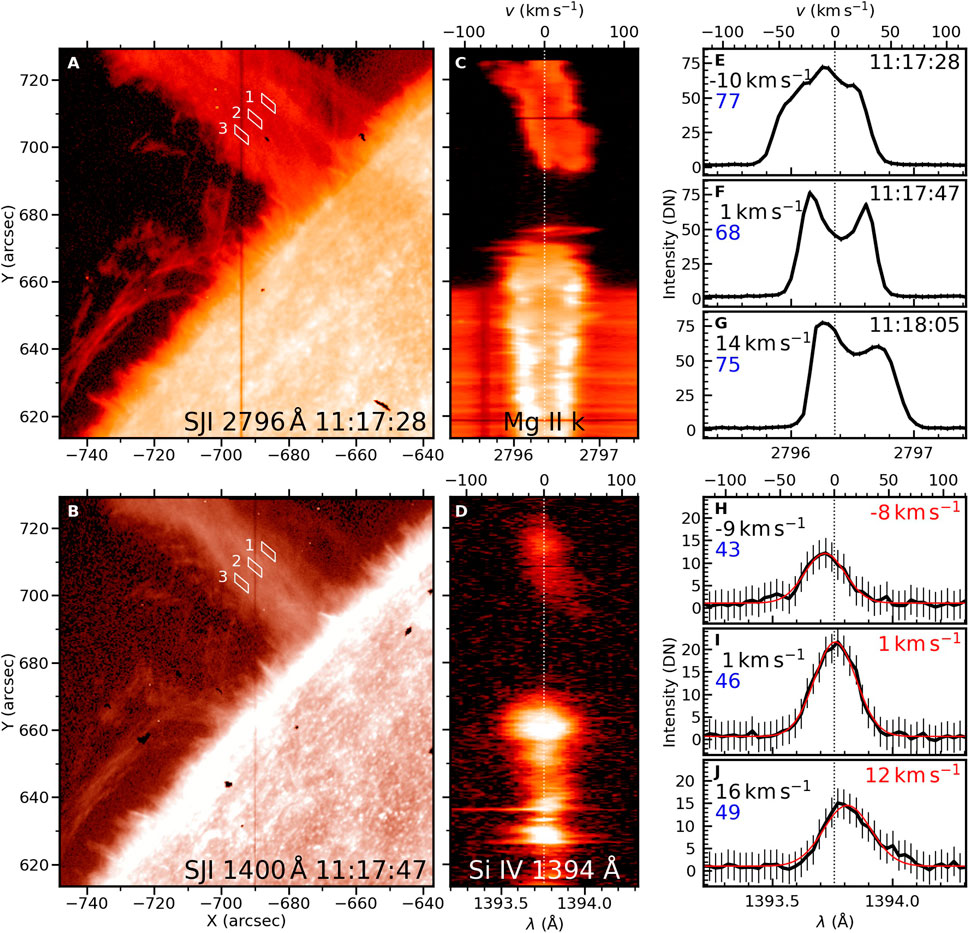
FIGURE 3. Spectral observations around 11:17 UT. First column: IRIS SJIs. Second column: images of the spectra at the slit position as shown in panel (A). Third column: average spectral profiles from boxes 1-3tbox1-3 in panels (A–B), sequentially. The first row is for Mgii observations and the second row is for the Si iv window. The vertical dotted lines in (C–J) mark the positions of rest wavelengths. In panels (E–J), Doppler velocities derived from the COG method (black fonts) and FWHMs in the units of “km s−1” (blue fonts) are noted in left. In panels (H–J), the Doppler velocities derived from Gaussian fitting (red curves) are marked in right (red fonts).
In both of the images of the Mg ii k and Si iv
The prominence spectra vary obviously when the prominence approaches eruption. The layout of Figure 4 is similar to Figure 3 but observed at ∼13:15 UT, about 10 min before the onset of the fast-rise phase. In Figures 4C, a red-shifted (around 60 km s−1) faint component appears, which can be seen in SJI at the prominence edges (Figure 4A, B). The Mg ii k line profiles in Figure 4E–G are red-asymmetry with multi-velocity components, and another red Gaussian profile is necessary to fit the Si iv
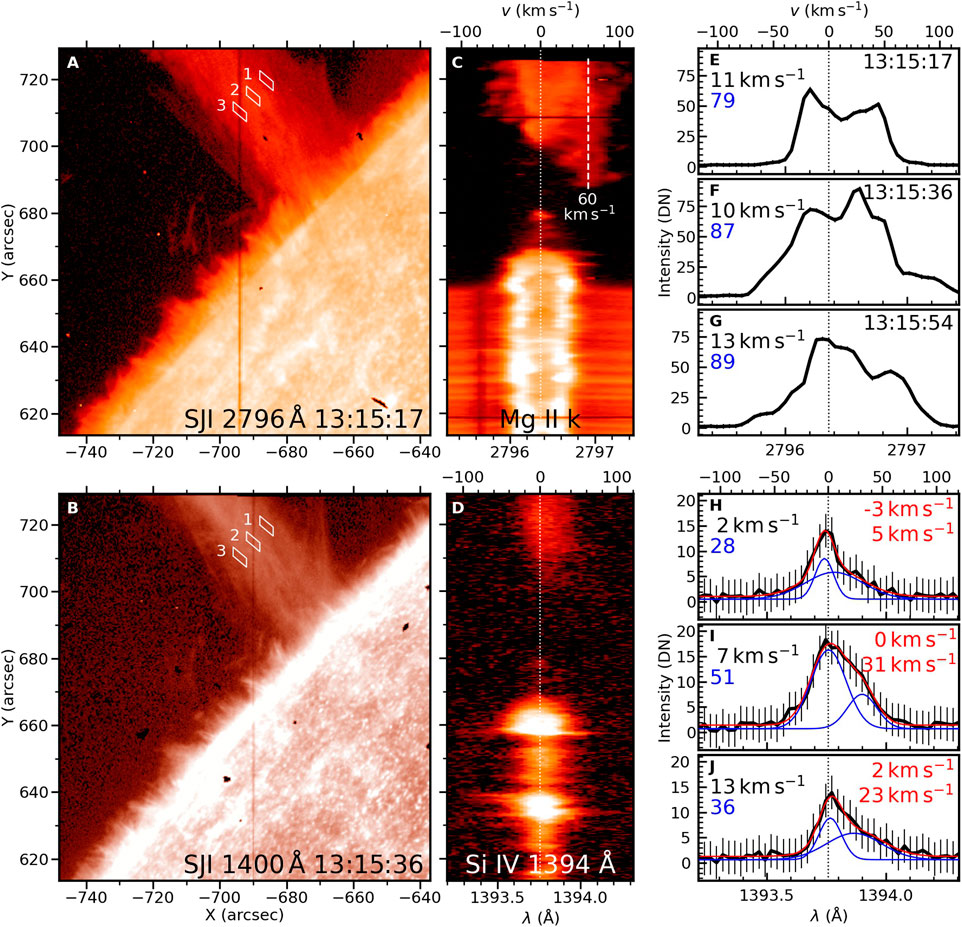
FIGURE 4. Spectral observations around 13:15 UT. The layout is similar to Figure 3 but double Gaussian fitting is used for Si iv
During the fast-rise phase in Figure 5, the faint components changes to be blue-shifted, with two main Doppler velocities shown in the image of the Mg ii k line spectra (Figure 5C): -44 and −27 km s−1. In the image of Si iv
To analyze the evolution of the prominence LOS velocities in detail, we calculate Doppler images from both the Mg ii k and Si iv
The obtained Doppler images are shown in Figure 6, where the first row shows AIA
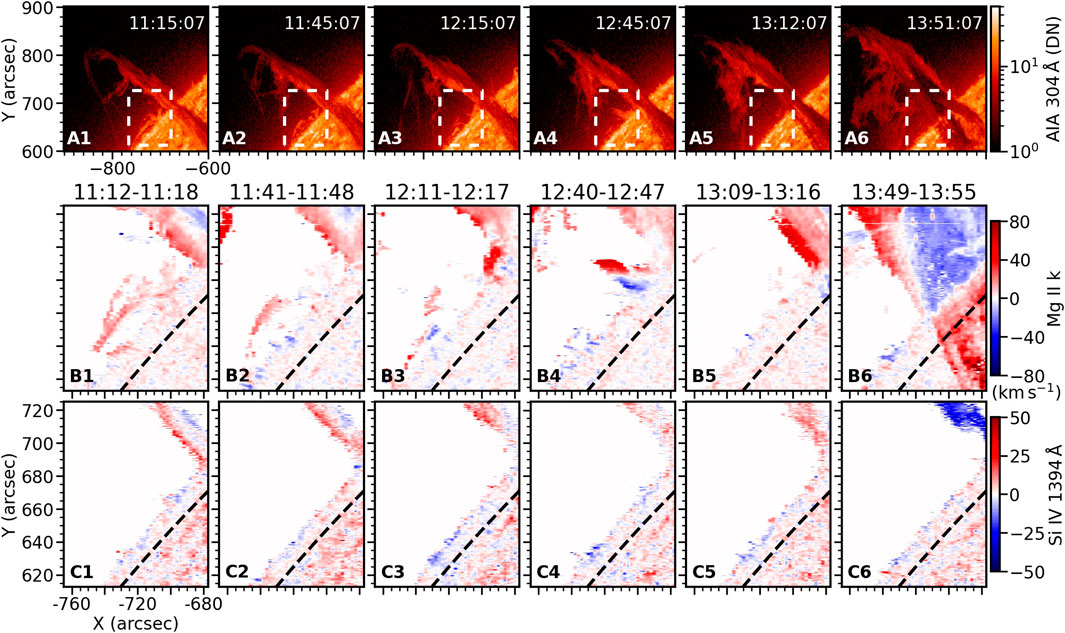
FIGURE 6. Doppler images derived from the spectra of Mg ii k (first row) and Si iv
3.3 Faint Component
A detailed view on the evolution of the faint component is shown in Figure 7, where the AIA
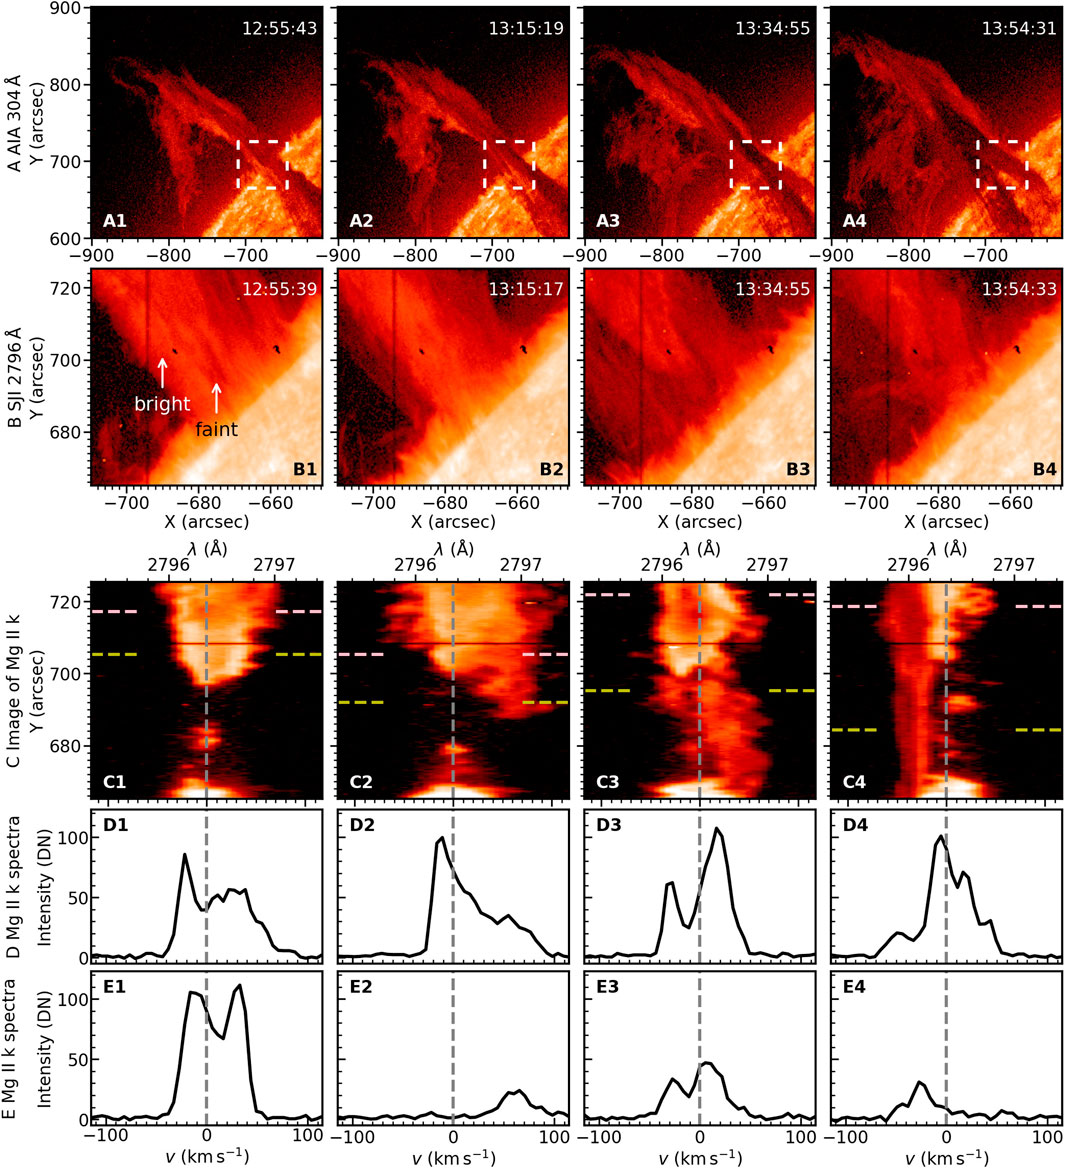
FIGURE 7. AIA
4 Discussion
The prominence eruption in the FOV of SDO/AIA can be divided into slow- and fast-rise phases, and the onset of the fast-rise phase is around 13:25 UT. However, The prominence Doppler shifts experience three periods: 1) 2 hours before the fast-rise phase, the left part of prominence, with respect to the prominence axis, is red-shifted and the right part is mainly blue-shifted (first column in Figure 6); 2) then, red-shifted area increases, and almost the whole prominence (in IRIS FOV) is red-shifted at 10 min before the fast-rise phase; 3) during the fast-rise phase, the prominence gets to be blue-shifted. A faint component is clearly identified at 12:55:39 UT (first column in Figure 7). The faint component in Mg ii k window has a narrow line width (∼ 30 km s−1, Figure 4) and significant variations of Doppler shifts. Besides, the faint component can absorb the radiation from the bright part, which leaves a single profile peak when the faint component has a significant Doppler shift, or results in a deep central reversal when the shift is slight. In Si iv window, the faint component can still be identified in SJI despite the lower S/N; two Gaussian profiles are necessary to fit the Si iv
4.1 Magnetic Configuration and View of the Prominence
A knowledge about the magnetic configuration and viewing angle of the prominence is helpful for understanding its observational features. The left image in Figure 8 is a AIA
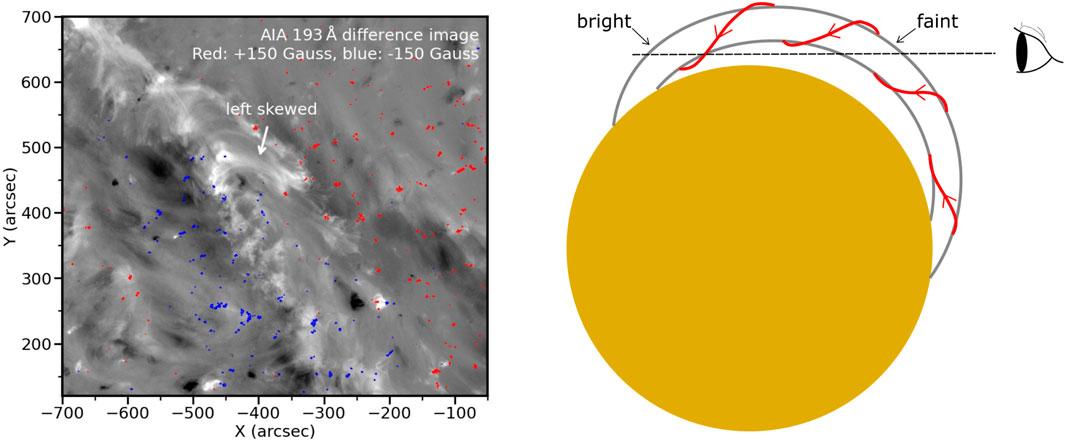
FIGURE 8. Prominence chirality and view. (A) AIA
4.2 Causes of Doppler Evolutions
Opposite Doppler shifts observed in a same prominence are generally explained as counter-streaming. In previous observations of counter-streaming, bidirectional flows were seen thread by thread [26], or blue- and red-wing images showed different directional flows [27]. Some of counter-streaming observations could be explained by local motions of plasma, such as small-scale oscillations [28] or magnetic reconnection [29]. In our event, the opposite Doppler shifts are found from the beginning of IRIS observations, and are possibly a property of the polar crown prominence that we studied. A major difference from previous observations is that the opposite Doppler shifts are distributed much regularly, i.e., the left half is red-shifted and the right part is mainly blue-shifted. This phenomenon reveals large-scale flows along the prominence spine, and cannot be explained by the local plasma motions.
Unidirectional flows along the flux rope could also cause opposite Doppler shifts when the LOS is perpendicular to the flux rope axis [24, 30–32]. Despite that the LOS is mainly along the prominence spine in the FOV of the IRIS in our case, we assume that the opposite Doppler shifts are caused by the flows within the spine. In this case, in the cartoon of Figure 8, the flows of the part marked with “bright” should move toward the observer, or the flows marked with “faint” should move away from the observer, or both, to cause the left being red-shifted and the right being blue-shifted with respect to the prominence axis. In the following period, the spine is dominantly red-shifted, but the blue shifts are not enhanced. The different evolutions of the red and blue shifts makes this assumption questionable.
During the fast-rise phase in the third column in Figure 7, the faint component shows opposite Doppler shift along the slit, which is possibly caused by untwisting motion of the erupting prominence [10], which could be seen in AIA
When approaching the fast-rise phase, red shifts dominate the prominence, and the faint component has a large LOS velocity. In the Mg ii k window, the LOS velocity of the bright component is not clear due to the fact that its emission is absorbed partly by the faint component. But from the Si iv window, the results of the double Gaussian fitting (Figure 4H–J) suggest that the Doppler shift of the bright component is not obvious. The red shifts could be explained by the mass drainage during the elevation of the prominence spine, which could accelerate the prominence eruption in return [33]. In our case, if the prominence mass moves toward the prominence footpoint behind the solar disk, the direction of LOS velocity is consistent with the red shifts (see the cartoon in Figure 8). The large Doppler velocity of the faint component suggests that the mass near the spine center moves faster than the mass near the footpoint, which is possibly due to more significant elevation of the prominence spine center, and that the large density near the footpoint may slow down the flows.
During the fast-rise phase, the prominence gets to be blue-shifted, which reveals the overall movement of the erupting prominence away from the solar disk and toward the observer.
4.3 Formation of the Faint Component
Reference [10] did also observe a faint and narrow component with a large Doppler velocity up to 460 km s−1 in an erupting active region prominence. The authors proposed that the two components with different Doppler velocities suggest that the erupting material is distributed in a hollow cone shape. The faint component in our observations share most of features as reported by Reference [10]; despite that the Doppler velocity is relatively small. In addition, there are some phenomena only seen in our observations. Firstly, we could see the faint component in AIA
The intensity ratio of Mg ii k and h lines is widely used to check the opacity [7, 10, 11, 20]: the ratio is generally in the range of 1–2, and approaches 2 under the optically thin assumption and gets small with the increase of opacity. Figure 9 shows the images of Mg ii k integrated intensity (panels A,B) and k/h ratio (panels C,D) from spectral observations. Continuum intensity is subtracted when calculating the images. The left column in Figure 9 is observed between 11:13 UT and 13:19 UT before the occurrence of the faint component, and the k/h ratio is relatively homogeneous. A region is selected in Figure 9C with yellow box, and the mean k/h ratio is 1.25. The right column in Figure 9 is observed between 13:11 UT and 13:17 UT, and a faint region is seen at the prominence left edge (Figure 9B). The k/h ratio image in Figure 9D shows that the faint component has a larger k/h ratio (1.40) than the bright prominence (mainly between 1.2 and 1.3), which suggests that the faint component has a lower opacity. It should be noticed that the k/h ratios vary for different prominences with different viewing angles Reference [11]. reported the k/h value around 1.4 in the main body of an eruptive prominence in quiet region, but in the erupting prominence studied by Reference [10]; the intensity ratio of the primary bright component varies from 1.4 to 1.9.
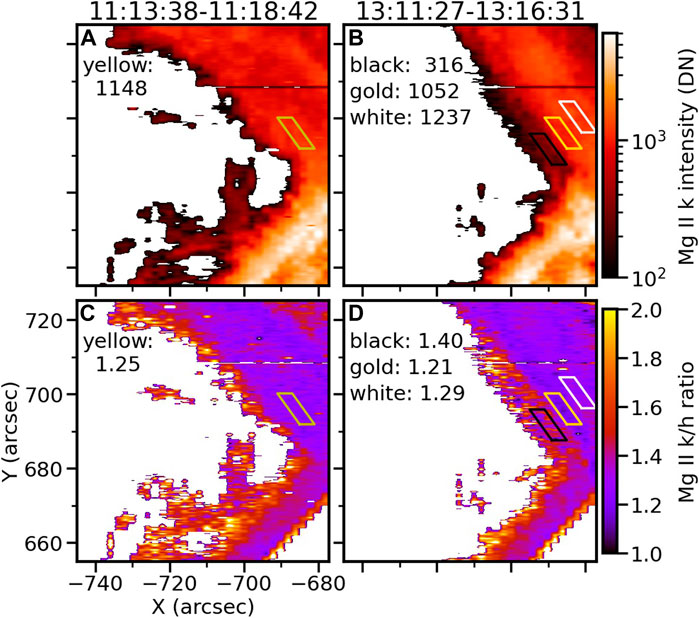
FIGURE 9. Images of integrated uncalibrated intensity of the Mg ii k line (A–B) and the Mg ii k/h intensity ratio (C–D). Mean values of the marked regions are noted in each panel.
Prominence Mg ii k radiation is partly from the emission of local plasma, and partly from the scattering of the chromospheric radiation [7, 34]. In our observations, the faint component can absorb or scatter the light from the bright part behind. Using non-LTE radiative transfer techniques Reference [20], simulated emergent Mg ii k and h lines in solar disk; the authors found that Mg ii k core intensity is weak if the line core forms at a high position due to a low density and three-dimensional scattering, although temperature increases along height in the chromosphere. In our observations, the low emission (Figure 7E2-E4) and deep central reversal (Figure 7D3) of the faint component possibly result from the scattering of low-density plasma. In addition, line width is mainly determined by plasma temperature and micro-turbulence. The narrow Mg ii k line profiles suggest that the faint component is mainly prominence core, whose temperature is lower than the PCTR. Therefore, we propose that the faint component consists of low-density and cold plasma, which appear due to the expansion of the prominence core during the prominence eruption. In this process, the flows move fast along the prominence spine and result in significant Doppler shifts. However, non-LTE modeling is necessary to give a strict explanation on the characteristics of the AIA
5 Conclusion
We studied spectral evolution of an eruptive polar crown prominence using its IRIS observations in the Mg ii and Si iv lines and AIA EUV images. The main observational results of this work are listed in Table 2. The AIA observations suggest that the prominence experiences a slow- and fast-rise phase before it leaves the FOV of AIA. Simultaneously, the variation of Doppler shifts of the erupting prominence could be divided into three periods. In the first period, more than 2 h before the onset of the fast-rise phase, opposite Doppler shifts at the two sides of the prominence axis are found with maximum LOS velocity between 20–30 km s−1. In the second period, around the onset of the fast-rise phase, the whole prominence gets to be red-shifted gradually. In the third period, the prominence is dominantly blue-shifted. The possible cause of the opposite Doppler shifts in the first period is large-scale counter-streaming, or unidirectional flows along the prominence spine (as a flux rope). More observations are necessary to determine which mechanism results in the opposite shifts, then reveal the mode of flows within the prominence spine. Besides, the opposite Doppler shifts of the faint component during the fast-rise phase may result from the untwisting motion of the erupting prominence. The obvious red shifts in the second period may reveal mass drainage along the prominence spine due to the elevation of the prominence, and the mass drainage might accelerate the prominence eruption in return. The blue shifts in the last period is likely to result from the eruption of the prominence toward the observer.
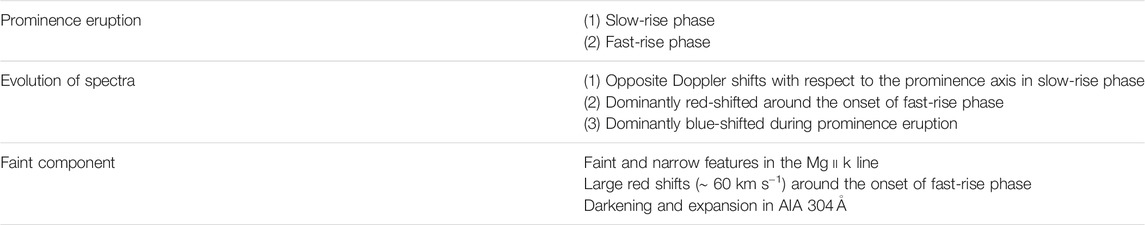
TABLE 2. Main observational results of this work.
During the second period, a faint component appears in AIA
Hence we can relate the evolution of the spectra and the formation of the faint component to the prominence eruption. The opposite Doppler shifts are properties of the polar crown prominence that we studied. When the prominence approaches eruption, the prominence spine elevates and expands, and the acceleration of the mass drainage causes the obvious red shifts. Simultaneously, a faint region along the prominence spine forms and gets darker due to the decreasing of the plasma density during the spine expansion. Finally, the acceleration of the prominence eruption results in the blue shifts. Despite the consistence of above explanations, however, non-LTE radiative transfer simulations in future are necessary to interpret the observational characteristics of the Mg ii k line and AIA
Data Availability Statement
Publicly available datasets were analyzed in this study. This data can be found here: https://iris.lmsal.com/search.
Author Contributions
JX processed the observational data, decided the main content of the paper, plotted figures, and wrote the article. HL selected the topic, joined discussion, and modified the article. YS joined discussion, offered ideas about the explanation on the observed phenomena, and modified the article.
Funding
This work is supported by the NSFC grants (11427803, U1731241, U1631242, 11820101002) and by CAS Strategic Pioneer Program on Space Science, grant Nos. XDA15052200, XDA15320103, XDA15320300, and XDA15320301.
Conflict of Interest
The authors declare that the research was conducted in the absence of any commercial or financial relationships that could be construed as a potential conflict of interest.
Publisher’s Note
All claims expressed in this article are solely those of the authors and do not necessarily represent those of their affiliated organizations, or those of the publisher, the editors and the reviewers. Any product that may be evaluated in this article, or claim that may be made by its manufacturer, is not guaranteed or endorsed by the publisher.
Acknowledgments
The authors thank the reviewers for their suggestions, some findings and ideas in this paper are proposed by them. JX thanks Jean-Claude Vial, Yingna Su, and Ping Zhang for discussion, thanks Ying Li and Hui Tian for a guidance on processing IRIS data. We thank the IRIS, AIA, and HMI teams for providing the data. YS acknowledges the Jiangsu Double Innovation Plan.
References
1. Labrosse N, Heinzel P, Vial JC, Kucera T, Parenti S, Gunár S, et al. Physics of Solar Prominences: I—Spectral Diagnostics and Non-LTE Modelling. Space Sci Rev (2010) 151:243–332. doi:10.1007/s11214-010-9630-6
2. Parenti S. Solar Prominences: Observations. Living Rev Solar Phys (2014) 11:1. doi:10.12942/lrsp-2014-1
4. Chen P-F, Xu A-A, Ding M-D. Some Interesting Topics Provoked by the Solar Filament Research in the Past Decade. Res Astron Astrophys (2020) 20:166. doi:10.1088/1674-4527/20/10/166
5. De Pontieu B, Title AM, Lemen JR, Kushner GD, Akin DJ, Allard B, et al. The Interface Region Imaging Spectrograph (IRIS). Sol Phys (2014) 289:2733–79. doi:10.1007/s11207-014-0485-y
6. Schmieder B, Tian H, Kucera T, López Ariste A, Mein N, Mein P, et al. Open Questions on Prominences from Coordinated Observations by IRIS, Hinode, SDO/AIA, THEMIS, and the Meudon/MSDP. A&A (2014) 569:A85. doi:10.1051/0004-6361/201423922
7. Vial J-C, Pelouze G, Heinzel P, Kleint L, Anzer U. Observed IRIS Profiles of the H and K Doublet of Mg Ii and Comparison with Profiles from Quiescent Prominence NLTE Models. Sol Phys (2016) 291:67–87. doi:10.1007/s11207-015-0820-y
8. Okamoto TJ, Liu W, Tsuneta S. Helical Motions of Fine-structure Prominence Threads Observed by Hinode and IRIS. ApJ (2016) 831:126. doi:10.3847/0004–637X/831/2/126
9. Ruan G, Schmieder B, Mein P, Mein N, Labrosse N, Gunár S, et al. On the Dynamic Nature of a Quiescent Prominence Observed by IRIS and MSDP Spectrographs. ApJ (2018) 865:123. doi:10.3847/1538-4357/aada08
10. Liu W, De Pontieu B, Vial J-C, Title AM, Carlsson M, Uitenbroek H, et al. First High-Resolution Spectroscopic Observations of an Erupting Prominence within a Coronal Mass Ejection by the Interface Region Imaging Spectrograph (IRIS). ApJ (2015) 803:85. doi:10.1088/0004-637X/803/2/85
11. Zhang P, Buchlin É, Vial JC. Launch of a CME-Associated Eruptive Prominence as Observed with IRIS and Ancillary Instruments. A&A (2019) 624:A72. doi:10.1051/0004-6361/201834259
12. Lörinčík J, Dudík J, Aulanier G, Schmieder B, Golub L. Imaging Evidence for Solar Wind Outflows Originating from a Coronal Mass Ejection Footpoint. ApJ (2021) 906:62. doi:10.3847/1538-4357/abc8f6
13. Lemen JR, Title AM, Akin DJ, Boerner PF, Chou C, Drake JF, et al. The Atmospheric Imaging Assembly (AIA) on the Solar Dynamics Observatory (SDO). Sol. Phys. (2012) 275:17–40. doi:10.1007/s11207-011-9776-8
14. Pesnell WD, Thompson BJ, Chamberlin PC. The Solar Dynamics Observatory (SDO). Sol Phys (2012) 275:3–15. doi:10.1007/s11207-011-9841-3
15. Scherrer PH, Schou J, Bush RI, Kosovichev AG, Bogart RS, Hoeksema JT, et al. The Helioseismic and Magnetic Imager (HMI) Investigation for the Solar Dynamics Observatory (SDO). Sol Phys (2012) 275:207–27. doi:10.1007/s11207-011-9834-2
16. Schwartz P, Heinzel P, Schmieder B, Anzer U. Study of an Extended EUV Filament Using SoHO/SUMER Observations of the Hydrogen Lyman Lines. A&A (2006) 459:651–61. doi:10.1051/0004-6361:20065619
17. Schwartz P, Gunár S, Curdt W. Non-LTE Modelling of Prominence fine Structures Using Hydrogen Lyman-line Profiles. A&A (2015) 577:A92. doi:10.1051/0004-6361/201425138
18. Gunár S, Heinzel P, Anzer U, Schmieder B. On Lyman-line Asymmetries in Quiescent Prominences. A&A (2008) 490:307–13. doi:10.1051/0004-6361:200810127
19. Gunár S, Schwartz P, Schmieder B, Heinzel P, Anzer U. Statistical Comparison of the Observed and Synthetic Hydrogen Lyman Line Profiles in Solar Prominences. A&A (2010) 514:A43. doi:10.1051/0004-6361/200913411
20. Leenaarts J, Pereira TMD, Carlsson M, Uitenbroek H, De Pontieu B. The Formation of IRIS Diagnostics. II. The Formation of the Mg II H&k Lines in the Solar Atmosphere. ApJ (2013) 772:90. doi:10.1088/0004-637X/772/2/90
21. Uitenbroek H. The Accuracy of the Center-of-Gravity Method for Measuring Velocity and Magnetic Field Strength in the Solar Photosphere. ApJ (2003) 592:1225–33. doi:10.1086/375736
22. Cheng X, Zhang J, Ding MD, Olmedo O, Sun XD, Guo Y. Investigating Two Successive Flux Rope Eruptions in a Solar Active Region. ApJ (2013) 769:L25. doi:10.1088/2041-8205/769/2/L25
23. Su Y, van Ballegooijen A, McCauley P, Ji H, Reeves KK, DeLuca EE. Magnetic Structure and Dynamics of the Erupting Solar Polar Crown Prominence on 2012 March 12. ApJ (2015) 807:144. doi:10.1088/0004-637X/807/2/144
24. Chen PF, Harra LK, Fang C. Imaging and Spectroscopic Observations of a Filament Channel and the Implications for the Nature of Counter-streamings. ApJ (2014) 784:50. doi:10.1088/0004-637X/784/1/50
25. Ouyang Y, Zhou YH, Chen PF, Fang C. Chirality and Magnetic Configurations of Solar Filaments. ApJ (2017) 835:94. doi:10.3847/1538-4357/835/1/94
26. Zirker JB, Engvold O, Martin SF. Counter-streaming Gas Flows in Solar Prominences as Evidence for Vertical Magnetic fields. Nature (1998) 396:440–1. doi:10.1038/24798
27. Lin Y, Engvold OR, Wiik JE. Counterstreaming in a Large Polar Crown Filament. Sol Phys (2003) 216:109–20. doi:10.1023/A:1026150809598
28. Ahn K, Chae J, Cao W, Goode PR. Patterns of Flows in an Intermediate Prominence Observed Byhinode. ApJ (2010) 721:74–9. doi:10.1088/0004-637X/721/1/74
29. Shen Y, Liu Y, Liu YD, Chen PF, Su J, Xu Z, et al. Fine Magnetic Structure and Origin of Counter-streaming Mass Flows in a Quiescent Solar Prominence. ApJ (2015) 814:L17. doi:10.1088/2041-8205/814/1/L17
30. Li LP, Peter H, Chen F, Zhang J. Conversion from Mutual Helicity to Self-Helicity Observed with IRIS. A&A (2014) 570:A93. doi:10.1051/0004-6361/201424377
31. Li LP, Peter H. Plasma Injection into a Solar Coronal Loop. A&A (2019) 626:A98. doi:10.1051/0004-6361/201935165
32. Zou P, Fang C, Chen PF, Yang K, Cao W. Magnetic Separatrix as the Source Region of the Plasma Supply for an Active-Region Filament. ApJ (2017) 836:122. doi:10.3847/1538-4357/836/1/122
33. Fan Y. Simulations of Prominence Eruption Preceded by Large-Amplitude Longitudinal Oscillations and Draining. ApJ (2020) 898:34. doi:10.3847/1538-4357/ab9d7f
Keywords: Sun: corona, Sun: coronal mass ejections (CMEs), Sun: filaments, prominences, Sun: UV radiation, techniques: spectroscopic
Citation: Xue J, Li H and Su Y (2021) Spectral Evolution of an Eruptive Polar Crown Prominence With IRIS Observations. Front. Phys. 9:750097. doi: 10.3389/fphy.2021.750097
Received: 30 July 2021; Accepted: 06 September 2021;
Published: 21 September 2021.
Edited by:
HengQiang Feng, Luoyang Normal University, ChinaReviewed by:
Leping Li, National Astronomical Observatories (CAS), ChinaPavol Schwartz, Astronomical Institute of Slovak Academy of Sciences, Slovakia
Copyright © 2021 Xue , Li and Su . This is an open-access article distributed under the terms of the Creative Commons Attribution License (CC BY). The use, distribution or reproduction in other forums is permitted, provided the original author(s) and the copyright owner(s) are credited and that the original publication in this journal is cited, in accordance with accepted academic practice. No use, distribution or reproduction is permitted which does not comply with these terms.
*Correspondence: Hui Li , nj.lihui@pmo.ac.cn