 Mengsi Ruan
1
Mengsi Ruan
1
 Pingbing Zuo
1*
Pingbing Zuo
1* Zilu Zhou2Zhenning Shen1Yi Wang1Xueshang Feng1Chaowei Jiang1
 Xiaojun Xu
2Jiayun Wei1Yanyan Xiong1Ludi Wang1
Xiaojun Xu
2Jiayun Wei1Yanyan Xiong1Ludi Wang1
- 1 Institute of Space Science and Applied Technology, Harbin Institute of Technology, Shenzhen, China
- 2 State Key Laboratory of Lunar and Planetary Sciences, Macau University of Science and Technology, Macao, China
Solar wind dynamic pressure pulses (DPPs) are small-scale plasma structures with abrupt and large-amplitude plasma dynamic pressure changes on timescales of seconds to several minutes. Overwhelming majority of DPP events (around 79.13%) reside in large-scale solar wind transients, i.e., coronal mass ejections, stream interaction regions, and complex ejecta. In this study, the intermittency, which is a typical feature of solar wind turbulence, is determined and compared during the time intervals in the undisturbed solar wind and in large-scale solar wind transients with clustered DPP events, respectively, as well as in the undisturbed solar wind without DPPs. The probability distribution functions (PDFs) of the fluctuations of proton density increments normalized to the standard deviation at different time lags in the three types of distinct regions are calculated. The PDFs in the undisturbed solar wind without DPPs are near-Gaussian distributions. However, the PDFs in the solar wind with clustered DPPs are obviously non-Gaussian distributions, and the intermittency is much stronger in the large-scale solar wind transients than that in the undisturbed solar wind. The major components of the DPPs are tangential discontinuities (TDs) and rotational discontinuities (RDs), which are suggested to be formed by compressive magnetohydrodynamic (MHD) turbulence. There are far more TD-type DPPs than RD-type DPPs both in the undisturbed solar wind and large-scale solar wind transients. The results imply that the formation of solar wind DPPs could be associated with solar wind turbulence, and much stronger intermittency may be responsible for the high occurrence rate of DPPs in the large-scale solar wind transients.
1 Introduction
Small-scale plasma structures with abrupt and large-amplitude plasma dynamic pressure changes (increase or decrease) on timescales of seconds to several minutes and small pressure variations in the preceding and succeeding regions, are frequently observed in the solar wind. They are usually named as solar wind dynamic pressure pulses (DPPs) [1–5]. DPPs are associated with many fundamental physical processes, such as plasma instability [1, 6], turbulence [7], magnetic reconnection [8], and interactions between different kinds of solar wind streams [9]. Meanwhile, DPPs are very geoeffective, which could affect the transport of energy and momentum from the solar wind to the magnetosphere-ionosphere coupling system [10], compress the Earth’s magnetosphere and cause various types of disturbances in the magnetosphere and ionosphere [5, 11–14]. It is important to investigate the origin of DPPs and their evolution in interplanetary space to understand the basic plasma physical process and the space weather effects.
In the past two decades, the properties of DPPs have been investigated in depth. The sudden dynamic pressure changes of DPPs, which are accompanied by variations in the magnetic field and proton temperature, result mainly from increase or decrease in density, rather than the bulk speed change [1–3]. For the majority of DPPs, the sum of the thermal pressure and magnetic pressure remains in equilibrium. Barkhatov et al. [15] indicated that the balance of the total pressure across the sharp pressure changes could affect the evolution of small-scale solar wind structures. Nearly constant total pressure across the small-scale structures can be regarded as the evidence of pressure balance [6, 16]. Hence, most DPPs can be considered as pressure balance structures (PBSs). According to the jump conditions, Dalin et al. (2002) [1] and Riazantseva et al. (2005a) [16] indicated that most DPPs can be classified into tangential discontinuities (TDs), or rotational discontinuities (RDs) with anisotropic thermal pressure. Zuo et al. (2015b) [3] performed a statistical survey on the properties of DPPs based on nearly 20 years of observations from the WIND spacecraft, and verified that the main components of DPPs may be shocks and directional discontinuities (DDs) and the occurrence rate of shocks is extremely smaller comparing with that of DDs. Specially, DPPs have the feature of grouping occurrence and may exist in specific solar wind environments. Zuo et al. (2015b) [4] and Xie et al. (2015) [2] both found that the overwhelming majority of DPP events in different solar phases reside in large-scale solar wind transients, i.e., coronal mass ejection-related flows, stream interaction regions (SIRs), as well as complex ejecta. Since interplanetary coronal mass ejections (ICMEs), SIRs and complex ejecta, which usually containing sustaining southward interplanetary magnetic field (IMF), are the main drivers of geomagnetic storms [17–20], Zuo et al. (2015b) [4] proposed that the feature of grouping occurrence may be regarded as an indicator of space weather events. Zuo et al. (2015c) [5] inferred that DPPs in different solar wind flows may have different origins. In-situ observations and numerical simulations of magnetohydrodynamic (MHD) turbulence show that magnetic discontinuities closely relate to the intermittent turbulence [21–27]. Zuo et al. (2015b) [4] also found some clues that DPPs may be the product of magnetic turbulence or repeated magnetic reconnections.
In this paper, we comparatively analyze the different features of intermittency and component of DPP events in the undisturbed solar wind and in the large-scale solar wind transients based on nearly 21 years of WIND observations (1995–2016). The origin of DPPs is also discussed. In Section 2, we briefly introduce the data set and DPP event selection approach. Section 3 presents the results of statistical and comparative investigation of the dynamic pressure change and the relative dynamic pressure change in the undisturbed solar wind and solar wind transients. We then compare the intermittency during the time intervals in the undisturbed solar wind and in large-scale solar wind transients with clustered DPP events, respectively, as well as in the undisturbed solar wind without DPPs in Section 4. In the next section, the classification of DPPs is shown. A brief discussion and summary are given in the last section.
2 Data and Event Selection
In this investigation, we primarily use high time resolution solar wind plasma and magnetic field data from the Three-Dimensional Plasma and Energetic Particle Investigation (3DP) [28] and the Magnetic Field Investigation (MFI) [29] instruments onboard the WIND spacecraft, respectively. The solar wind plasma and magnetic field data during the period from 1995 to 2016, used to the DPP event identification, analysis on DPPs component and associated intermittency, are available with a cadence of 3-s in this work.
To identify DPPs in the solar wind, we apply an automated DPP-hunting computer procedure developed by Zuo et al. (2015a) [3]. The procedure is capable of: 1) correctly identifying the DPPs, 2) functionally determining their transition region where abrupt dynamic pressure changes occur, 3) and simultaneously selecting representative preceding and succeeding regions as the upstream and downstream, for which there are very small variations in solar wind dynamic pressure to represent the quiet plasma status. The selection criteria are guided as follows: 1) The sharp change of dynamic pressure exceeds a given threshold value dp
0 = 1 nPa in less than dt
0 = 5 min. 2) The transition region should be isolated in the sense that only small variations in dynamic pressure occur in the preceding and succeeding 3 min. The preceding and succeeding 3-min regions are selected to be representative of the upstream and downstream region. 3) In the upstream and downstream regions, the change in the amplitude of the dynamic pressure is less than 60% of that in the transition region, and the ratio of the square deviation of the dynamic pressure to its corresponding average value is less than 0.6. In order to ensure that the detected DPPs do not occur in the magnetosphere and its foreshock region, the events are discarded if the spacecraft was located in the region with X
WIND
< 60R
E
and
An example of DPP event in the solar wind on January 2, 2016 is presented in Figure 1. The region between two red vertical lines is defined as the transition region and the code-given adjacent upstream and downstream regions are marked by the red transverse lines. The top four panels present the magnetic field magnitude, the three magnetic components (in GSM coordinates), latitude angle and azimuthal angle of the magnetic field. As seen in Figure 1, the magnetic field magnitude drops from ∼ 7.5 to ∼ 1.0 nT, with abrupt directional changes (latitude angle change: Δθ > 50°), suggesting the existence of intermittent structures. The subsequent panels show the proton temperature, proton number density, solar wind bulk speed and solar wind dynamic pressure from the 3DP instruments. The values of the four plasma parameters all increase from upstream to downstream.
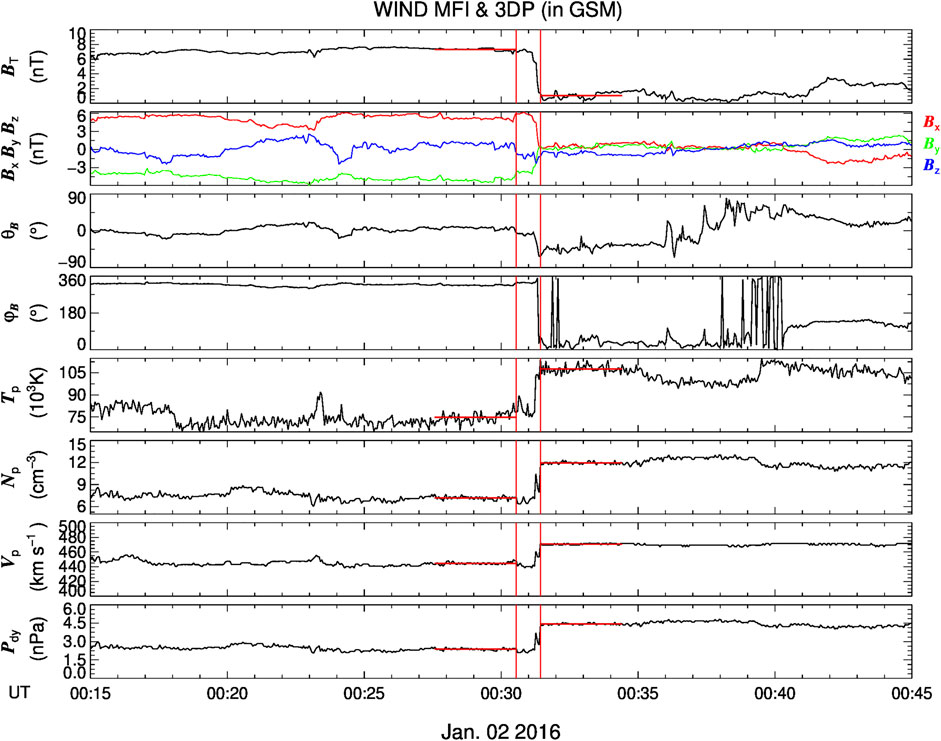
FIGURE 1. One typical DPP event in the solar wind observed by WIND on January 2, 2016. The boundaries of the DPP transition region are marked by the red vertical lines, and the transverse lines before and after the DPP transition region denote DPP’s upstream and downstream regions. The panels from top to bottom are: magnetic-field magnitude, the three components (x, y, z) of the magnetic field in Geocentric Solar Magnetospheric (GSM) coordinates, magnetic-field latitude angle, magnetic-field azimuthal angle, proton temperature, proton density, proton bulk speed, and solar wind dynamic pressure, respectively.
ICMEs and SIRs are two types of dominant solar wind transients [30–32]. A combined ICME list in 1995–2016 is obtained from publicly available catalogues compiled by Chi Yutian (USTC list) 1 , Jian Lan (UCLA list) 2 and Richardson & Cane (R& C list) 3 . The lists of SIRs obtained from the websites 4 , 5 are also referred. We classify the near-Earth solar wind into two types: the undistributed solar wind and the large-scale solar wind transients including ICMEs, CIRs and the complex ejecta formed due to their interaction. A DPP event is considered to be associated with the solar wind transients if its transition region occurs within the time interval of the solar wind transient passages.
3 Statistic of DPP Events
12,077 DPP events in the solar wind from 1995 to 2016 are identified with the automatic searching code. There are 2,521 (20.87%) and 9,556 (79.13%) DPP events residing in the undisturbed solar wind and solar wind transients, respectively. Table 1 shows the annual number of DPPs in undisturbed solar wind and solar wind transients. Figure 2 shows the distribution of DPPs that are associated with the undisturbed solar wind (indian red) and solar wind transients (sky blue) in each year during 1995–2016. It is found that except for 1996 (55.81%), the proportion of DPPs in undisturbed solar wind is much lower than that related to the solar wind transients, ranging from 3.46 to 28.99%, which is consistent with Zuo et al. (2015b) [4].
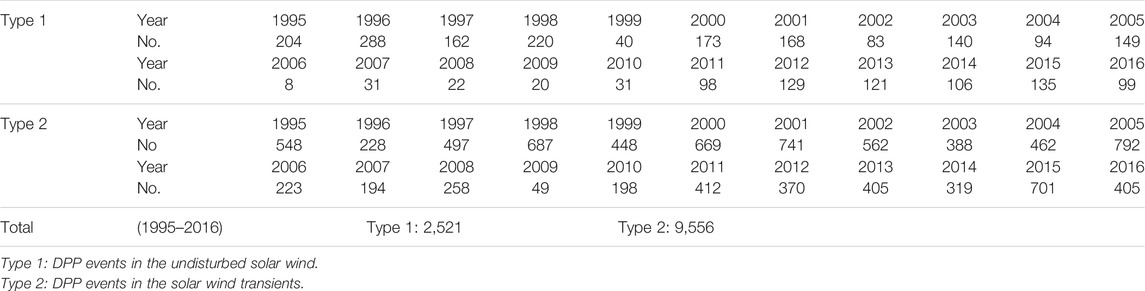
TABLE 1. List of Solar Wind Dynamic Pressure Pulses (DPPs) in the undisturbed solar wind and solar wind transients.
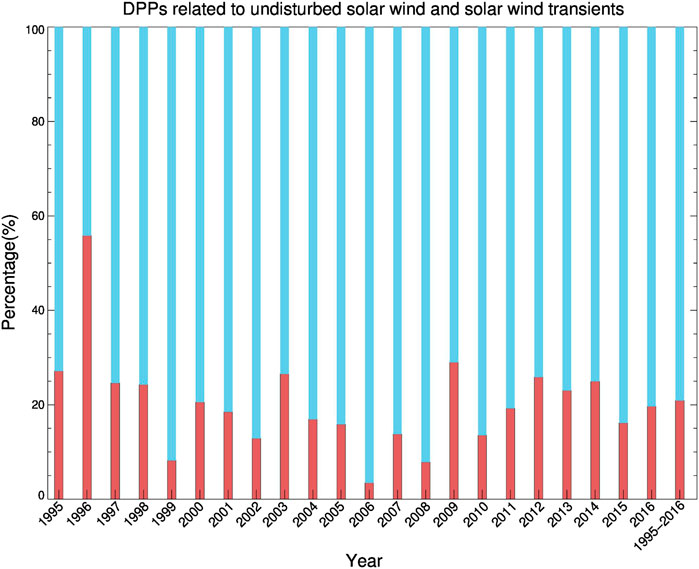
FIGURE 2. Proportion of DPPs associated with the undisturbed solar wind (indian red) and solar wind transients (sky blue).
Figure 3 presents the comparison of the dynamic pressure change in the undisturbed solar wind (indian red) and solar wind transients (sky blue). The distribution of the absolute value of the dynamic pressure amplitude change from upstream to downstream, i.e., dP
dy
= |p
down
− p
up
|, is displayed in Figure 3A. The value of
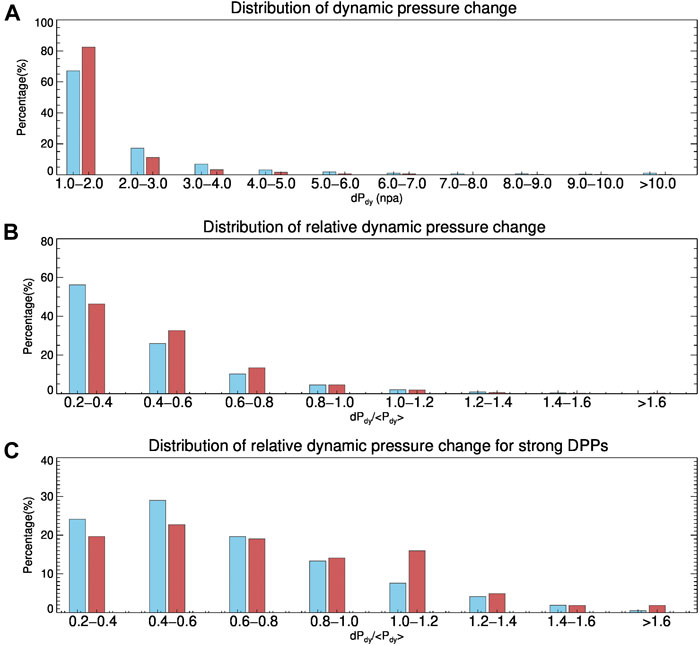
FIGURE 3. The distributions of absolute dynamic pressure changes for all DPPs (A), relative pressure changes for all DPPs (B) and relative pressure changes for strong DPPs (C) in the undisturbed solar wind (indian red) and solar wind transients (sky blue).
The strength of the DPP compared with the background condition it resides in is determined by the ratio of the absolute value of the dynamic pressure amplitude change to the average dynamic pressure value, i.e., dp relative = dP dy /[(p up + p down )/2] [2]. Figure 3B shows the distribution of the relative dynamic pressure change. Comparison between the two types of solar wind flows suggests little difference in the distributions. The most probable relative pressure changes are 0.2–0.4 in the undisturbed solar wind and solar wind transients. The value of d relative for all cases in the undisturbed solar wind varies from 0.20 to 1.97 with an average value of 0.47, and 3.00% of the events have values greater than 1.0. The value of dp relative for all cases in solar wind transients varies from 0.20 to 1.99 with an average of 0.44, and about 3.40% of the events have values greater than 1.0. However, the most probable relative pressure changes are 0.4–0.6 for strong DPPs (Figure 3C). About 24.54% of the strong DPPs in the undisturbed solar wind and 14.02% of the strong DPPs in solar wind transients have a value of relative change larger than 1.0.
4 Turbulence Associated With DPP Events
Turbulence in the solar wind describes the fluctuation of solar wind parameters over different spatial and temporal scales [33]. Intermittency, manifesting inhomogeneity in the energy transfer between scales [34–37], is a typical feature of turbulence [38]. If the probability distribution function (PDF) of the fluctuations for a given solar wind parameter is not Gaussian at different scales and increasingly departs from a normalized distribution when the time-scale gets smaller, it reveals the presence of intermittency [36].
DPPs mainly reside in the solar wind transients. Here we selected sixteen events containing ICME, CIR or complex ejecta with clustered DPP occurrence, and in front of the solar wind transient, clustered distributed DPPs are also existed. So it is convenient to compare the intermittency during the successive intervals of the undisturbed solar wind without DPPs, the undisturbed solar wind with DPPs, and the solar wind transient with DPPs. For simplicity, these regions are termed as the ndpp-USW region, the dpp-USW region, and the dpp-LSSWT region, respectively. The time information of these events is listed in Table 2. Considering the pressure changes of DPPs are dominated by density variations, we analyzed the intermittency of density fluctuation in this work. The proton density increments are defined by δρ(τ) = ρ(t + τ) − ρ(t), and the function [δρ(τ) − ⟨δρ(τ)⟩] represents the fluctuations of proton density increments. Here, ρ and τ are the proton density, and the time lag between two samples, respectively. The angle bracket denotes ensemble averaging over time.
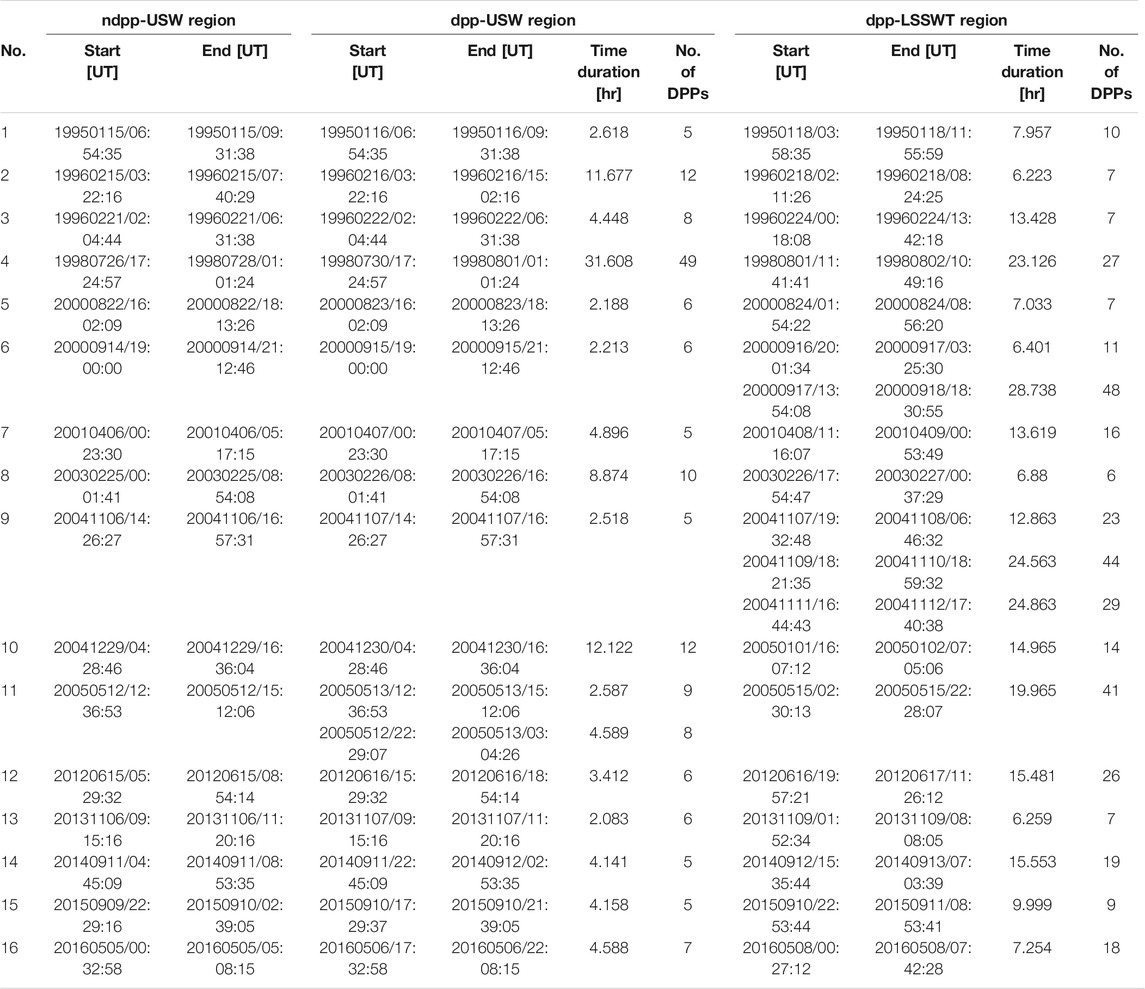
TABLE 2. The time information of selected 16 events. The start time, end time, time duration, and number of DPP events are listed separately. The time duration of ndpp-USW region is same as that of the dpp-USW region and listed in Column 6.
Figure 4 presents the magnetic field and plasma data observed by WIND during September 14–19, 2000. An ICME, which started at 16:09:00 UT on September 17, 2000 and ended at 06:25:00 UT on September 19, 2000, was observed to interact with a SIR during 18:30:00 UT on September 16 and 23:21:25 UT on September 17, 2000, and formed a complex ejecta. Four remarkably different regions labeled by the red vertical lines can be defined in sequence: the ndpp-USW region, the dpp-USW region, the dpp-LSSWT I region and the dpp-LSSWT II region. The dpp-LSSWT I and dpp-LSSWT II regions are both inside the complex ejecta. The time information of each region is given for the Event with NO. 6 in Table 2. The time scale of ndpp-USW region is same as that of the dpp-USW region and different from that of two dpp-LSSWT regions. The center position of the transition regions of the captured DPP events are marked by sky blue vertical lines. The number of DPP events captured in the dpp-USW, dpp-LSSWT I, dpp-LSSWT II regions is six, eleven and forty-eight, respectively (see also in Table 2).
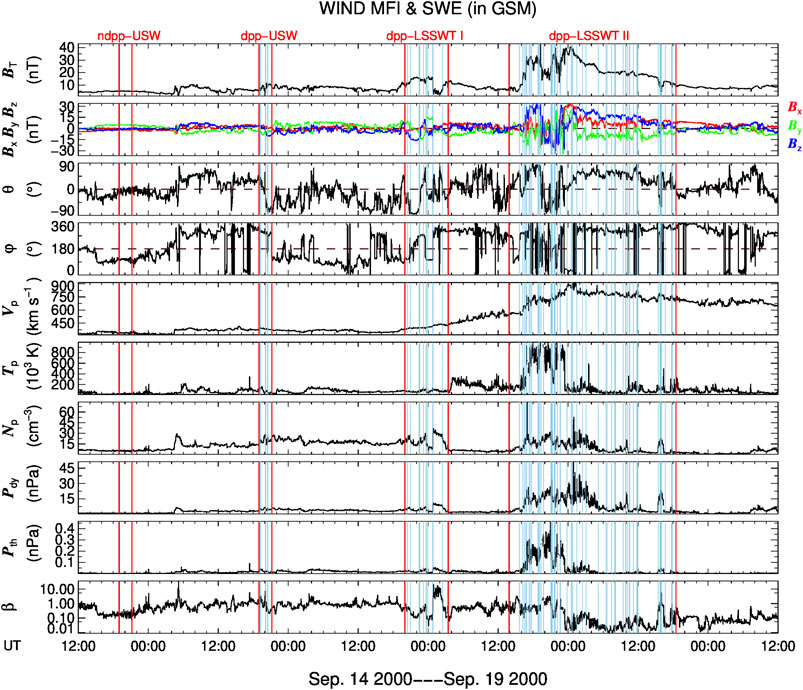
FIGURE 4. Magnetic field and plasma parameters of solar wind observed by WIND from 12:00 UT on September 14, 2000 to 12:00 UT September 19, 2000. The panels from top to bottom are: magnetic-field magnitude, the three components (x, y, z) of the magnetic field in Geocentric Solar Magnetospheric (GSM) coordinates, magnetic-field latitude angle, magnetic-field azimuthal angle, proton bulk speed, proton temperature, proton density, solar wind dynamic pressure, proton thermal pressure, and plasma beta, respectively. The solar wind dynamic pressure, the thermal pressure and plasma beta are calculated as the functions,
Figure 5 shows the PDFs of solar wind proton density increments normalized to the standard deviation, i.e., [δρ(τ) − ⟨δρ(τ)⟩]/σ ρ , for different time lags τ of the corresponding ndpp-USW region (Figure 5A), dpp-USW region (Figure 5B), dpp-LSSWT I region (Figure 5C) and dpp-LSSWT II (Figure 5D), respectively. σ ρ is the standard deviation of δρ(τ). The black curves in Figure 5 denote the standard Gaussian distribution with ⟨δρ(τ)⟩ = 0 and σρ = 1. The different degrees of red lines illustrate the actual distribution function among different time lags (τ = 12, 24, 48, 96, 192, and 384 s). It can be seen that the PDFs in the ndpp-USW region are near-Gaussian with all given time lags ranging from 12 to 384 s. But the PDFs are obviously non-Gaussian and the distributions become more self-similar at larger time lags in the dpp-USW, dpp-LSSWT I, dpp-LSSWT II regions. Deviation from a Gaussian distribution indicates that intermittency exists in the dpp-USW and two dpp-LSSWT regions.
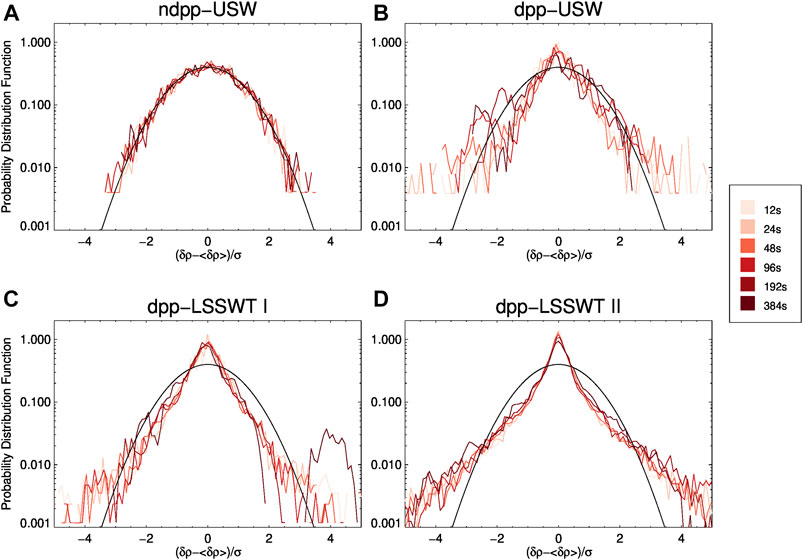
FIGURE 5. Probability distribution functions of solar wind proton density increments normalized to the standard deviation for different time lags of ndpp-USW region (A), dpp-USW region (B) and dpp-LSSWT I region (C) and dpp-LSSWT II region (D). The time intervals of four distinct regions are presented in Figure 4. The black curve is the standard Gaussian distribution with unit variance. The different degrees of red lines illustrate the actual distribution function between different time lags ranging from 12 to 384 s.
In order to unravel the intermittent character of the density fluctuations, the method described in Bruno et al. (2003, 2014) [39, 40] is used to estimate the flatness factor F at different time lags. The flatness factor F, the fourth-order moment of distribution, is defined as:
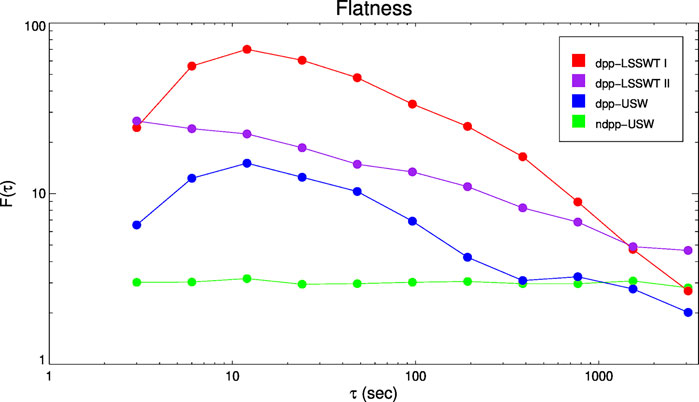
FIGURE 6. Flatness factor F as a function of different time lags ranging from 3 to 3,072 s, relative to fluctuations of the plasma density observed in ndpp-USW region (green), dpp-USW region (blue), dpp-LSSWT I region (red), and dpp-LSSWT II region (pruple), respectively). The time intervals of four distinct regions are presented in Figure 4.
Figure 7 presents the solar wind data observed by WIND during May 11–17, 2005. A typical ICME preceded by a driven strong shock is detected during May 15–17, 2005. Before the ICME, one ndpp-USW and two dpp-USW regions can be found, which are marked by red vertical lines in the figure. A dpp-LSSWT region is inside the ICME and the sheath region. The time information of each region is given for the Event with NO. 11 in Table 2. The PDFs of solar wind proton density increments normalized to the standard deviation for the four regions are shown in Figure 8. Similarly, as seen in Figure 8A, the PDFs are near-Gaussian distributions in the ndpp-USW region, while the PDFs progressively deviate from a Gaussian distribution in two dpp-USW regions and one dpp-LSSWT region shown in Figures 8B–D. We also calculate corresponding flatness factors F for these four regions. Figure 9 displays the distributions of flatness factor F. It can be found that the flatness factors in the ndpp-USW region are about to 3 and keep self-similar substantially. The F curves for two dpp-USW regions approximately overlap. It indicates that the density fluctuations in the two dpp-USW regions exhibit the same level of intermittency. Besides, the flatness factors in the dpp-LSSWT region are dominantly higher than those in other three regions, which illustrates more intermittent in the dpp-LSSWT region.
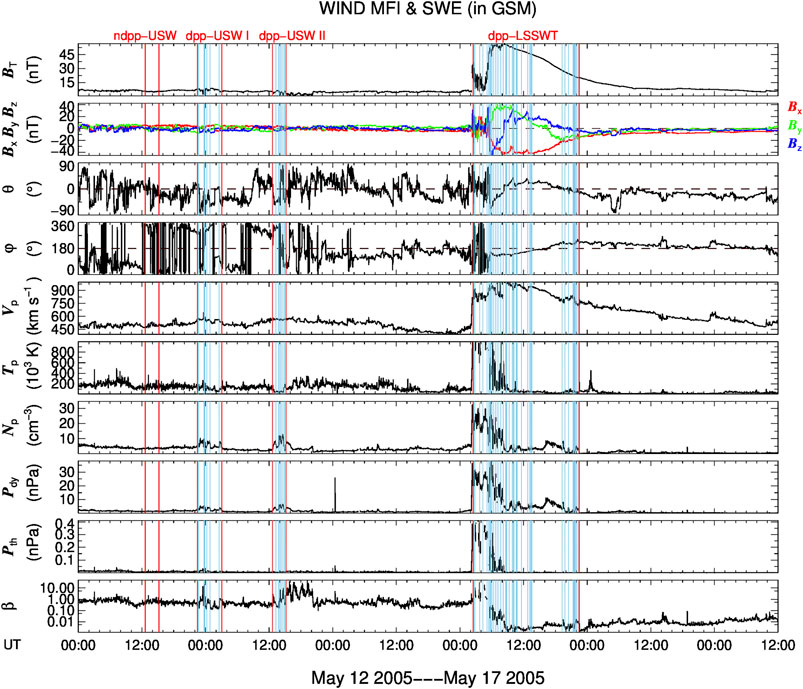
FIGURE 7. Magnetic field and plasma parameters of solar wind observed by WIND from May 11, 2005 to May 17, 2005. The panels from top to bottom are: magnetic-field magnitude, the three components (x, y, z) of the magnetic field in Geocentric Solar Magnetospheric (GSM) coordinates, magnetic-field latitude angle, magnetic-field azimuthal angle, proton bulk speed, proton temperature, proton density, solar wind dynamic pressure, proton thermal pressure, and plasma beta, respectively. The four discussed regions, ndpp-USW region, dpp-USW I region, dpp-USW II region, and dpp-LSSWT region, are labeled by the red vertical lines, respectively. The center of the transition regions of the captured DPP events are marked by sky blue vertical lines separately.
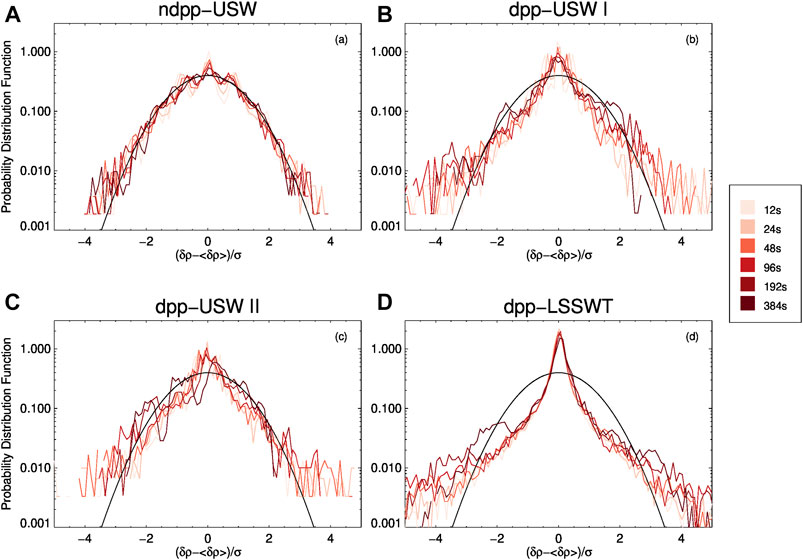
FIGURE 8. Probability distribution functions of solar wind proton density increments normalized to the standard deviation for different time lags of ndpp-USW region (A), dpp-USW I region (B), dpp-USW II region (C), dpp-LSSWT region (D). The time intervals of four distinct regions are presented in Figure 7. The black curve is the standard Gaussian distribution with unit variance. The different degrees of red lines illustrate the actual distribution function between different time lags ranging from 12 to 384 s.
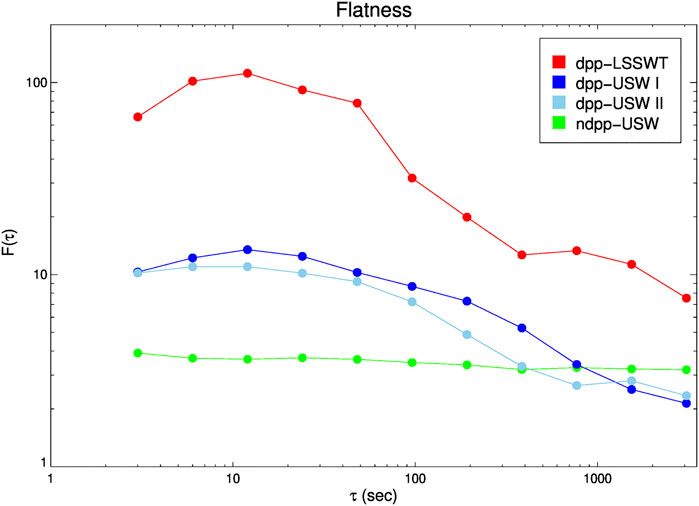
FIGURE 9. Flatness factor F as a function of different time lags ranging from 3 to 3,072 s, relative to fluctuations of the plasma density observed in ndpp-USW region (green), dpp-USW I region (blue), dpp-USW II region (sky blue), dpp-LSSWT region (red), respectively. The time intervals of five regions are presented in Figure 7.
In above analysis we have taken two events as examples to compare the intermittency features in the regions with and without DPP occurrence. Both the distributions of PDFs and flatness factor clearly reveal that intermittency does not exist in the ndpp-USW region, but exists in the dpp-USW and dpp-LSSWT regions. Furthermore, the intermittency in dpp-LSSWT regions is stronger than that in the dpp-USW regions. The remaining events, although not discussed here, have the similar distributions of PDFs and flatness factor according to our analysis. Figure 10 illustrates the statistical distributions of the average values of flatness factor F of all dpp-LSSWT regions, dpp-USW regions and ndpp-USW regions for the selected sixteen events. It is found that the average of flatness factor in dpp-USW regions are evidently smaller than that in dpp-LSSWT regions at all discussed time lags.
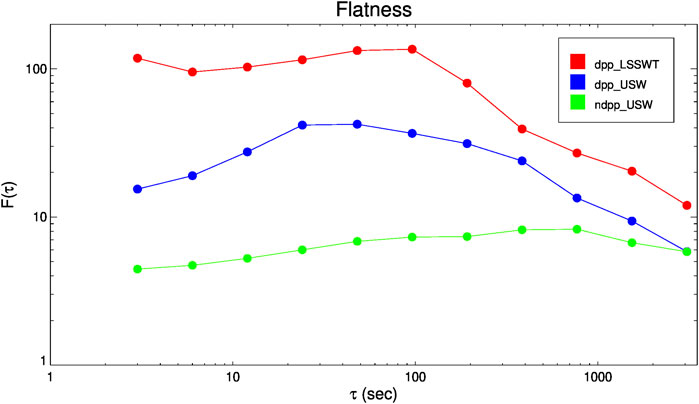
FIGURE 10. The statistical distribution of the average values of flatness factor F of 16 selected events observed in ndpp-USW region (green), dpp-USW region (blue), dpp-LSSWT region (red), respectively.
5 Classification of DPP Events
Recent studies about DPPs in the solar wind show that the main components of DPPs are directional discontinuities (DDs) or interplanetary (IP) shocks, but IP shocks are much rare in comparison with DDs so that they do not play a significant role in statistical investigation [4]. DDs are ubiquitous in interplanetary space and are considered to be a mixture of TDs and RDs [21, 41–45]. A TD, which does not propagate but is convected along with the solar wind, is a special kind of pressure-balance structure and usually separate two different plasma regions of solar wind [46]. A RD, which has a magnetic field component normal to the discontinuity surface, is not a static structure and can be regarded as a large-amplitude Alfvén wave propagating along the magnetic field [45, 47, 48]. Due to plasma compression, TDs are less stable than RDs.
Previous studies proposed some criteria to categorize solar wind DDs into TDs and RDs [21, 41, 49–51]. In this study, we follow the criterion of Neugebauer et al. [41] in which only magnetic field data were used for classification. A DD is classified as: 1) TD: |B n |/B max < 0.4, [B]/B max ≥ 0.2; 2) RD: |B n |/B max ≥ 0.4, [B]/B max < 0.2; 3) Either discontinuity (ED): |B n |/B max < 0.4, [B]/B max < 0.2; 4) Neither discontinuity (ND): |B n |/B max ≥ 0.4, [B]/B max ≥ 0.2 [43]. Here |B n | is the normal field component, [B] is the absolute change value of field magnitude across the transition, B max is the maximum of the averaged magnetic field magnitude in the selected upstream region and that in the downstream region. EDs with a small field component normal to the discontinuity surface and small absolute magnitude change share the properties of TDs and RDs [41, 43, 52–54]. Thus it is difficult to judge whether an ED is a TD or a RD if only the magnetic field data is used.
To determine the surface normal vector of the DDs, the minimum variance analysis (MVA) [55] was employed. The minimum variance direction of the IMF vectors corresponds to the normal of the discontinuity plane. And the quality of the result has a positive correlation to the ratio of the intermediate (λ 2) to minimum (λ 3) eigenvalue, which gives information about the efficiency of the MVA technique. Here we adopt the consistency requirement to ensure the accurate MVA normal estimates λ 2/λ 3 ≥ 2 [56].
Figure 11 illustrates the percentages of TD, RD, ED, ND for the DPPs in the undisturbed solar wind (Figure 11A) and in the solar wind transients (Figure 11B). In the undisturbed solar wind, 2,121 (84.13%) DPP events match the requirement, and the occurrence of TDs, RDs, EDs, and NDs accounts for 53.47, 9.48, 31.35, and 5.70%. In the solar wind transients, 8,018 (83.91%) DPP events are obtained, and the corresponding proportions of TD, RD, ED, and ND are 36.24, 17.88, 42.68, and 3.20%, respectively. By comparison, the ratio of TD type DPPs in the undisturbed solar wind is distinctly greater than that in the solar wind transients, while the ratio of RD-type DPPs in the solar wind transients is around twice of that in the undisturbed solar wind. Whether DPP events resides in the undisturbed solar wind or in the solar wind transients, TDs are obviously more than RDs.
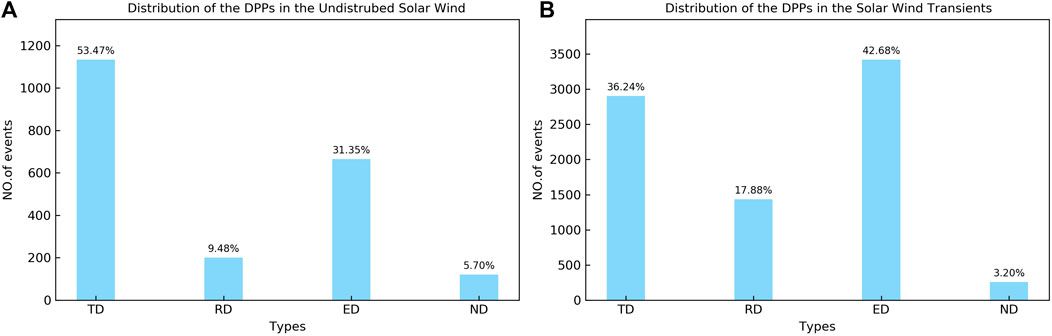
FIGURE 11. Component of DPP events in two different types of solar wind flows: (A) in the undistributed solar wind; (B) in the solar wind transients. The fraction of each component of DPP events is marked above the bars.
6 Summary and Discussion
DPPs are small-scale plasma structures which are ubiquitous in the solar wind. With the motivation to rapidly and automatically identify the numerous DPPs from the solar wind data for further research, we have developed an automated searching procedure. This code has been applied to hunt for DPPs from the observational data stream of WIND from 1995 to 2016. Totally 12,077 DPP events are identified. Based on these events, we perform a comparative analysis on the turbulence and component classification of DPPs in different types of solar wind. Note that, since we only consider the sharp front with sudden change of dynamic pressure on timescales of seconds to a few minutes, in our code, the crossing time of the transition region dt 0 is restricted to be less than 5 min, which can be easily operated. If we restrict the spatial length of the transition region, the number of samples of DPPs identified and used in the statistical investigation may be changed. But the statistical features of the intermittency of the region with and without clustered DPP occurrence should keep coincident since we don’t consider the DPP itself but the study the turbulence of the environment that the DPPs resided in.
The main results of this investigation are as follows:
1) The absolute dynamic pressure changes of most DPP events, both in the undisturbed solar wind and solar wind transients, are 1.0–2.0 nPa. Statistically, the most probable values of the relative dynamic pressure change are 0.2–0.4 for all DPPs. In comparison, this parameter is larger for strong DPP events in two types of solar wind flows, being 0.4–0.6.
2) Intermittency is determined and compared during the time intervals in the undisturbed solar wind and large-scale solar wind transients with clustered DPP events, as well as in the undisturbed solar wind without the occurrence of DPPs. It is found that the PDFs and the flatness factors in ndpp-USW region are almost self-similar at different time lags, while the PDFs and flatness factor in dpp-USW and dpp-LSSWT regions are not Gaussian. The intermittency in dpp-LSSWT region is obviously stronger than that in dpp-USW region.
3) Most DPP events are TDs and RDs, and there are far more TD-type DPPs than RD-type DPPs both in the undisturbed solar wind and solar wind transients. The occurrence of RD-type DPPs is higher in solar wind transients than that in the undisturbed solar wind, while the occurrence of TD-type DPPs in solar wind transients is smaller than that in the undisturbed solar wind.
In-situ observations and numerical simulations of MHD turbulence show that magnetic discontinuities may originate from MHD turbulence and closely relate to intermittent turbulence [21–27, 57]. By comparing the statistical analysis with simulations of MHD turbulence about the waiting-time and the PDFs of magnetic field increments, Greco et al. (2009a) [23] found that some discontinuities are reproduced by intermittent turbulence. Zhdankin et al. [57] studied the relationship between exponentially distributed angular discontinuities in the magnetic field and MHD turbulence. They proposed that strong discontinuities are associated with inertial-range MHD turbulence, while weak discontinuities emerge from dissipation-range turbulence. Meanwhile, they found that the structure functions of the magnetic field direction exhibit anomalous scaling exponents, which indicated the existence of intermittent structures. Yang et al. [26] conducted a simulation of decaying compressive MHD turbulence with a RD, and they found that the RD evolves from the steepening, which is caused by the non-uniformity of Alfvén speed in the MHD turbulence, of Alfvén waves. And then, they compared the TD’s lifetime with the travel time of the solar wind from the Sun to 1 AU and inferred that TDs observed at 1 AU are more possibly to be generated by local turbulence [27].
This study shows that the PDFs in the solar wind with clustered DPPs are obviously non-Gaussian distributions and the intermittency is much stronger in the large-scale solar wind transients, while the PDFs in the undisturbed solar wind without DPPs are near-Gaussian distributions. It reveals that strong intermittency is more likely to occur in solar wind transients with clustered DPP events. On the other hand, the main components of the DPPs are two types of discontinuities: TDs and RDs, and the occurrence rate of DPPs is much higher in the solar wind transients than in the undisturbed solar wind. It is inferred that much stronger intermittency may be responsible for the high occurrence rate of DPPs in the large-scale solar wind transients.
Data Availability Statement
The original contributions presented in the study are included in the article/Supplementary Material, further inquiries can be directed to the corresponding author.
Author Contributions
MR carried out the analysis and wrote the draft of the manuscript. PZ was the leader of this study and led the data analysis. ZZ and ZS contributed to the revision and improvement of the manuscript. All the authors participated in discussions and agreed to the final text.
Funding
This work was partially supported by the NSFC grants 41731067, 42074205, the Guangdong Basic and Applied Basic Research Foundation (Grant No. 2019A1515011067) and Shenzhen Natural Science Fund (the Stable Support Plan Program GXWD20201230155427003-20200822192703001).
Conflict of Interest
The authors declare that the research was conducted in the absence of any commercial or financial relationships that could be construed as a potential conflict of interest.
Publisher’s Note
All claims expressed in this article are solely those of the authors and do not necessarily represent those of their affiliated organizations, or those of the publisher, the editors and the reviewers. Any product that may be evaluated in this article, or claim that may be made by its manufacturer, is not guaranteed or endorsed by the publisher.
Acknowledgments
We would like to thank the NASA CDAWEB for providing the public WIND 3DP, MFI, and SWE data. We also acknowledge Dr. Ian Richardson, Dr. Hilary Cane, Dr. Yutian Chi and Dr. Lan Jian for providing the lists of ICMEs and CIRs.
Footnotes
1 http://space.ustc.edu.cn/dreams/wind_icmes/index.php.
2 https://link.springer.com/content/pdf/10.1007/s11207-006-0133-2.pdf.
3 http://www.srl.caltech.edu/ACE/ASC/DATA/level3/icmetable2.htm#.
4 https://link.springer.com/content/pdf/10.1007/s11207-006-0132-3.pdf.
5 http://link.springer.com/content/pdf/10.1007/s11207-016-0971-5.pdf.
References
1. Dalin PA, Zastenker GN, Paularena KI, Richardson JD. A Survey of Large, Rapid Solar Wind Dynamic Pressure Changes Observed by Interball-1 and IMP 8. Ann Geophys (2002) 20:293–299. doi:10.5194/angeo-20-293-2002
2. Xie Y, Zuo P, Feng X, Zhang Y. Solar Wind Dynamic Pressure Pulses at 1 AU during the Deep Minimum between Solar Cycles 23 and 24. Sol Phys (2015) 290:1835–49. doi:10.1007/s11207-015-0700-5
3. Zuo P, Feng X, Xie Y, Wang Y, Li H, Xu X. Automatic Detection Algorithm of Dynamic Pressure Pulses in the Solar Wind. ApJ (2015) 803:94. doi:10.1088/0004-637X/803/2/94
4. Zuo P, Feng X, Xie Y, Wang Y, Xu X. A Statistical Survey of Dynamic Pressure Pulses in the Solar Wind Based Onwindobservations. ApJ (2015) 808:83. doi:10.1088/0004-637X/808/1/83
5. Zuo P, Feng X, Xie Y, Wang Y, Xu X. Strong Solar Wind Dynamic Pressure Pulses: Interplanetary Sources and Their Impacts on Geosynchronous Magnetic fields. ApJ (2015) 812:152. doi:10.1088/0004-637X/812/2/152
6. Riazantseva MO, Zastenker GN, Richardson JD, Eiges PE. Sharp Boundaries of Small- and Middle-Scale Solar Wind Structures. J Geophys Res (2005) 110:A12110. doi:10.1029/2005JA011307
7. Riazantseva MO, Khabarova OV, Zastenker GN, Richardson JD. Sharp Boundaries of Solar Wind Plasma Structures and Their Relationship to Solar Wind Turbulence. Adv Space Res (2007) 40:1802–6. doi:10.1016/j.asr.2007.05.004
8. Khabarova OV, Zastenker GN. Sharp Changes of Solar Wind Ion Flux and Density within and outside Current Sheets. Sol Phys (2011) 270:311–29. doi:10.1007/s11207-011-9719-4
9. Riazantseva MO, Dalin PA, Zastenker GN, Richardson JD. Orientation of Sharp Fronts of the Solar Wind Plasma. Cosmic Res (2003) 41:382–91. doi:10.1023/a:1025061711391
10. Lyon JG. The Solar Wind-Magnetosphere-Ionosphere System. Science (2000) 288:1987–91. doi:10.1126/science.288.5473.1987
11. Borovsky JE. Contribution of Strong Discontinuities to the Power Spectrum of the Solar Wind. Phys Rev Lett (2010) 105:111102. doi:10.1103/physrevlett.105.111102
12. Hietala H, Phan TD, Angelopoulos V, Oieroset M, Archer MO, Karlsson T, et al. In Situ Observations of a Magnetosheath High-Speed Jet Triggering Magnetopause Reconnection. Geophys Res Lett (2018) 45:1732–40. doi:10.1002/2017gl076525
13. Plaschke F, Hietala H, Archer M, Blanco-Cano X, Kajdič P, Karlsson T, et al. Jets Downstream of Collisionless Shocks. Space Sci Rev (2018) 214:1–77. doi:10.1007/s11214-018-0516-3
14. Newman R, Vainchtein D, Artemyev A. Solar Wind Transient Currents: Statistical Properties and Impact on Earth's Magnetosphere. Sol Phys (2020) 295:1–16. doi:10.1007/s11207-020-01695-z
15. Barkhatov NA, Korolev AV, Zastenker GN, Ryazantseva MO, Dalin PA. MHD Simulations of the Dynamics of Sharp Disturbances of the Interplanetary Medium and Comparison with Spacecraft Observations. Cosmic Res (2003) 41:529–38. doi:10.1023/B:COSM.0000007951.49454.8a
16. Riazantseva MO, Khabarova OV, Zastenker GN, Richardson JD. Sharp Boundaries of Solar Wind Plasma Structures and an Analysis of Their Pressure Balance. Cosmic Res (2005) 43:157–64. doi:10.1007/s10604-005-0030-8
17. Gonzalez WD, Joselyn JA, Kamide Y, Kroehl HW, Rostoker G, Tsurutani BT, et al. What is a Geomagnetic Storm. J Geophys Res (1994) 99:5771–92. doi:10.1029/93ja02867
18. Gonzalez WD, Tsurutani BT, Clúa de Gonzalez AL. Interplanetary Origin of Geomagnetic Storms. Space Sci Rev (1999) 88:529–62. doi:10.1023/a:1005160129098
19. Zhang J, Richardson IG, Webb DF, Gopalswamy N, Huttunen E, Kasper JC, et al. Solar and Interplanetary Sources of Major Geomagnetic Storms (Dst≤ −100 nT) during 1996-2005. J Geophys Res (2007) 112:a–n. doi:10.1029/2007JA012321
20. Shen C, Chi Y, Wang Y, Xu M, Wang S. Statistical Comparison of the ICME's Geoeffectiveness of Different Types and Different Solar Phases from 1995 to 2014. J Geophys Res Space Phys (2017) 122:5931–48. doi:10.1002/2016ja023768
21. Burlaga LF. Micro-scale Structures in the Interplanetary Medium. Sol Phys (1968) 4:67–92. doi:10.1007/BF00146999
22. Greco A, Chuychai P, Matthaeus WH, Servidio S, Dmitruk P. Intermittent MHD Structures and Classical Discontinuities. Geophys Res Lett (2008) 35. doi:10.1029/2008GL035454
23. Greco A, Matthaeus WH, Servidio S, Chuychai P, Dmitruk P. Statistical Analysis of Discontinuities in Solar WIND ACE Data and Comparison with Intermittent Mhd Turbulence. ApJ (2009) 691:L111–L114. doi:10.1088/0004-637x/691/2/l111
24. Greco A, Matthaeus WH, Servidio S, Dmitruk P. Waiting-time Distributions of Magnetic Discontinuities: Clustering or Poisson Process? Phys Rev E (2009) 80:046401. doi:10.1103/PhysRevE.80.046401
25. Servidio S, Greco A, Matthaeus WH, Osman KT, Dmitruk P. Statistical Association of Discontinuities and Reconnection in Magnetohydrodynamic Turbulence. J Geophys Res (2011) 116:a–n. doi:10.1029/2011JA016569
26. Yang L, Zhang L, He J, Tu C, Wang L, Marsch E, et al. The Formation of Rotational Discontinuities in Compressive Three-Dimensional MHD Turbulence. ApJ (2015) 809:155. doi:10.1088/0004-637X/809/2/155
27. Yang L, Zhang L, He J, Tu C, Li S, Wang X, et al. Formation and Properties of Tangential Discontinuities in Three-Dimensional Compressive MHD Turbulence. ApJ (2017) 851:121. doi:10.3847/1538-4357/aa9993
28. Lin RP, Anderson KA, Ashford S, Carlson C, Curtis D, Ergun R, et al. A Three-Dimensional Plasma and Energetic Particle Investigation for the Wind Spacecraft. Space Sci Rev (1995) 71:125–53. doi:10.1007/BF00751328
29. Lepping RP, Acũna MH, Burlaga LF, Farrell WM, Slavin JA, Schatten KH, et al. The Wind Magnetic Field Investigation. Space Sci Rev (1995) 71:207–29. doi:10.1007/BF00751330
30. Jian LK, Russell CT, Luhmann JG. Comparing Solar Minimum 23/24 with Historical Solar Wind Records at 1 AU. Sol Phys (2011) 274:321–44. doi:10.1007/s11207-011-9737-2
31. Richardson IG, Cane HV. Near-earth Solar Wind Flows and Related Geomagnetic Activity during More Than Four Solar Cycles (1963-2011). J Space Weather Space Clim (2012) 2:A02. doi:10.1051/swsc/2012003
32. Chi Y, Shen C, Luo B, Wang Y, Xu M. Geoeffectiveness of Stream Interaction Regions from 1995 to 2016. Space Weather (2018) 16:1960–71. doi:10.1029/2018sw001894
33. Coleman PJJ. Turbulence, Viscosity, and Dissipation in the Solar-Wind Plasma. ApJ (1968) 153:371. doi:10.1086/149674
34. Horbury TS, Forman MA, Oughton S. Spacecraft Observations of Solar Wind Turbulence: an Overview. Plasma Phys Control Fusion (2005) 47:B703–B717. doi:10.1088/0741-3335/47/12B/S52
35. Sorriso-Valvo L, Carbone V, Bruno R. On the Origin of the Strong Intermittent Nature of Interplanetary Magnetic Field. Space Sci Rev (2005) 121:49–53. doi:10.1007/s11214-006-5559-1
36. Bruno R. Intermittency in Solar Wind Turbulence from Fluid to Kinetic Scales. Earth Space Sci (2019) 6:656–72. doi:10.1029/2018EA000535
37. Verscharen D, Klein KG, Maruca BA. The Multi-Scale Nature of the Solar Wind. Living Rev Sol Phys (2019) 16:1–136. doi:10.1007/s41116-019-0021-0
38. Marsch E, Tu C. Non-gaussian Probability Distributions of Solar Wind Fluctuations. Ann Geophys (1994) 12:1127–38. doi:10.1007/s00585-994-1127-8
39. Bruno R, Carbone V, Sorriso-Valvo L, Bavassano B. Radial Evolution of Solar Wind Intermittency in the Inner Heliosphere. J Geophys Res (2003) 108:1130. doi:10.1029/2002JA009615
40. Bruno R, Telloni D, Primavera L, Pietropaolo E, D'Amicis R, Sorriso-Valvo L, et al. Radial Evolution of the Intermittency of Density Fluctuations in the Fast Solar Wind. ApJ (2014) 786:53. doi:10.1088/0004-637x/786/1/53
41. Neugebauer M, Clay DR, Goldstein BE, Tsurutani BT, Zwickl RD. A Reexamination of Rotational and Tangential Discontinuities in the Solar Wind. J Geophys Res (1984) 89:5395–408. doi:10.1029/JA089iA07p05395
42. Horbury TS, Burgess D, Fränz M, Owen CJ. Three Spacecraft Observations of Solar Wind Discontinuities. Geophys Res Lett (2001) 28:677–80. doi:10.1029/2000GL000121
43. Knetter T, Neubauer FM, Horbury T, Balogh A. Four-point Discontinuity Observations Using Cluster Magnetic Field Data: A Statistical Survey. J Geophys Res (2004) 109:A06102. doi:10.1029/2003JA010099
44. Vasquez BJ, Abramenko VI, Haggerty DK, Smith CW. Numerous Small Magnetic Field Discontinuities of Bartels Rotation 2286 and the Potential Role of Alfvénic Turbulence. J Geophys Res Space Phys (2007) 112:A11102. doi:10.1029/2007ja012504
45. Paschmann G, Haaland S, Sonnerup B, Knetter T. Discontinuities and Alfvénic Fluctuations in the Solar Wind. Ann Geophys (2013) 31:871–87. doi:10.5194/angeo-31-871-2013
46. Tsurutani BT, Ho CM. A Review of Discontinuities and Alfvén Waves in Interplanetary Space: Ulysses Results. Rev Geophys (1999) 37:517–41. doi:10.1029/1999RG900010
47. Hudson PD. Discontinuities in an Anisotropic Plasma and Their Identification in the Solar Wind. Planet Space Sci (1970) 18:1611–22. doi:10.1016/0032-0633(70)90036-x
48. Neugebauer M. Alignment of Velocity and Field Changes across Tangential Discontinuities in the Solar Wind. J Geophys Res (1985) 90:6627–30. doi:10.1029/JA090iA07p06627
49. Burlaga LF. Nature and Origin of Directional Discontinuities in the Solar Wind. J Geophys Res (1971) 76:4360–5. doi:10.1029/JA076i019p04360
50. Turner JM, Siscoe GL. Orientations of ‘Rotational’ and ‘Tangential’ Discontinuities in the Solar Wind. J Geophys Res (1971) 76:1816–22. doi:10.1029/ja076i007p01816
51. Smith EJ. Identification of Interplanetary Tangential and Rotational Discontinuities. J Geophys Res (1973) 78:2054–63. doi:10.1029/JA078i013p02054
52. Neugebauer M. Comment on the Abundances of Rotational and Tangential Discontinuities in the Solar Wind. J Geophys Res (2006) 111:A04103. doi:10.1029/2005JA011497
53. Artemyev AV, Angelopoulos V, Halekas JS, Vinogradov AA, Vasko IY, Zelenyi LM. Dynamics of Intense Currents in the Solar Wind. Astrophysical J (2018) 859:95. doi:10.3847/1538-4357/aabe89
54. Artemyev AV, Angelopoulos V, Vasko IY. Kinetic Properties of Solar Wind Discontinuities at 1 AU Observed by ARTEMIS. J Geophys Res Space Phys (2019) 124:3858–70. doi:10.1029/2019JA026597
55. Sonnerup BU, Scheible M. Minimum and Maximum Variance Analysis. Anal Methods multi-spacecraft Data (1998) 1:185–220.
56. Lepping RP, Behannon KW. Magnetic Field Directional Discontinuities: 1. Minimum Variance Errors. J Geophys Res (1980) 85:4695–703. doi:10.1029/JA085iA09p04695
Keywords: solar wind dynamic pressure pulse, discontinuity, turbulence, intermittency, data analysis
Citation: Ruan M, Zuo P, Zhou Z, Shen Z, Wang Y, Feng X, Jiang C, Xu X, Wei J, Xiong Y and Wang L (2021) The Relationship Between Solar Wind Dynamic Pressure Pulses and Solar Wind Turbulence. Front. Phys. 9:750410. doi: 10.3389/fphy.2021.750410
Received: 30 July 2021; Accepted: 05 October 2021;
Published: 16 November 2021.
Edited by:
Heng Qiang Feng, Luoyang Normal University, ChinaReviewed by:
Jia Huang, University of Michigan, United StatesKeiji Hayashi, Stanford University, United States
Copyright © 2021 Ruan, Zuo, Zhou, Shen, Wang, Feng, Jiang, Xu, Wei, Xiong and Wang. This is an open-access article distributed under the terms of the Creative Commons Attribution License (CC BY). The use, distribution or reproduction in other forums is permitted, provided the original author(s) and the copyright owner(s) are credited and that the original publication in this journal is cited, in accordance with accepted academic practice. No use, distribution or reproduction is permitted which does not comply with these terms.
*Correspondence: Pingbing Zuo, cGJ6dW9AaGl0LmVkdS5jbg==