 Chenglong Shen
 Yutian Chi
 Mengjiao Xu
 Yuming Wang
- 1CAS Center for Excellence in Comparative Planetology, University of Science and Technology of China, Hefei, China
- 2CAS Key Laboratory of Geospace Environment, Department of Geophysics and Planetary Sciences, University of Science and Technology of China, Hefei, China
The intensity of the southward component of the magnetic field (Bs) carried by Interplanetary Coronal Mass Ejections (ICMEs) is one of the most critical parameters in causing extreme space weather events, such as intense geomagnetic storms. In this work, we investigate three typical ICME events with extremely intense Bs in detail and present a statistical analysis of the origins of intense Bs in different types of ICMEs based on the ICME catalogue from 1995 to 2020. According to the in-situ characteristics, the ICME events with extremely high Bs are classified into three types: isolated ICMEs, multiple ICMEs, and shock-ICME interaction events with shocks inside ICMEs or shocks passing through ICMEs. By analyzing all ICME events with Bs ≥ 10nT and Bs ≥ 20nT, we find that 39.6% of Bs,mean ≥ 10nT events and 50% of Bs,mean ≥ 20nT events are associated with shock-ICME events. Approximately 35.7% of shock-ICME events have Bs,mean ≥ 10nT, which is much higher than the other two types (isoloted ICMEs: 7.2% and multiple ICMEs: 12.1%). Those results confirm that the ICMEs interaction events are more likely to carry extreme intense Bs and cause intense geomagntic storms. Only based on the in-situ observations at Earth, some interaction ICME events, such as shock-ICME interaction events with shocks passing through the preceding ICME or ICME cannibalism, could be classified as isolated ICME events. This may lead to an overestimate of the probability of ICME carrying extremely intense Bs. To further investigate such events, direct and multi-point observations of the CME propagation in the inner heliosphere from the Solar Ring Mission could be crucial in the future.
1 Introduction
Interplanetary Coronal Mass Ejections (ICMEs), the interplanetary counterparts of the Coronal Mass Ejections (CMEs), are considered to be the main source of geomagnetic storms, especially the intense geomagnetic storms [1–9]. By studing the intense geomagnetic storms from 1995 to 2014, Shen et al. [9] reported that 87% of intense geomagnetic storms with Dstmin ≤ −100nT were caused by ICMEs. This result is consistent with the results obtained by Zhang et al. [3] and Kilpua et al. [10]. From another point of view, Shen et al. [9] found that 20% of ICMEs caused intense geomagnetic storms. This might be caused by the fact that ICMEs are the main sources of the southward component of the interplanetary magnetic field (Bs, the absolute value of the southward component of the magnetic field). When the southward magnetic field reaches the Earth, it will interact with the magnetosphere and then cause geomagnetic storms [11,12]. Thus, the intensities of Bs carried by ICMEs are important parameters in space weather studies and forecasting. Based on the ICMEs catalogue developed by the University of Science and Technology of China group [13], which is abbreviated as USTC ICME catalogue hereafter, the mean value of the Bs in the ICME (Bs,mean) varied from 0 to 35.39 nT with the mean value for all ICMEs of 4.40 nT.
According to the previous work, the intensities of geomagnetic storms caused by ICMEs are strongly associated with the intensities of Bs embedded with ICMEs ([9,14–16], and references therein). ICMEs with higher Bs are more likely to cause intense magnetic storms [17,18]. Thus, the origin of the intense Bs is an important question. Based on the literature, the interaction between multiple CMEs would enhance the magnetic field in the ICMEs [9,15,17–19]. In addition, as a special type of multiple ICMEs interaction, the interaction between previous ICMEs and following shocks could also enhance the Bs in the ICMEs significantly [9,20–24]. Shen et al. [18] found that in the shock-ICME interaction event of 6–11 September 2017, the shock compression enhanced Bs inside the ICME from 10 to 30 nT. In their following work, Xu et al. [21] analyzed 18 moderate to intense geomagnetic storms caused by shock-ICME interaction events, showing that the shock compression can enhance the intensities of Bs in ICME by a factor of 2. But, questions still remained. For example, is it possible for the isolated ICME to carry extremely strong Bs? If so, why? Are there any other possible explanations for the abnormally strong Bs in isolated ICMEs?
In this work, we discuss the possible origins of the extreme intense Bs in the ICMEs based on the typical events anaylsis. In Section 2–5, we will introduce some typical events with extremely high Bs in the ICMEs. In the last section, we will present some conclusions and discussions.
2 Extreme Bs Value Inside Isolated ICME: 2003 November 20 Event
An ICME with extremely high Bs is the 2003 November 20 event. This event caused the strongest geomagnetic storms in the past 30 years with the peak value of Dst index of −422 nT [25–27]. As indicated in Figure 1, an obvious fast forward shock (red vertical line) was detected by Wind spacecraft at 08:37 UT on November 20. Approximately 3.5 h later, an obvious ICME reached the Earth and lasted about 16 h, as shown by the gray shadow region in Figure 1. The ICME exhibits characteristics of magnetic clouds including a rise in magnetic field strength, a smooth rotation in magnetic field vector, and a drop in proton temperature and plasma beta. No additional ICME was detected by Wind spacecraft in 6 h preceding or after this ICME, indicating that this ICME was an isolated ICME event. It indicates that the isolated ICME events also have the potential to carry extremely intense Bs. The possible reasons are: 1) this ICME has a southward axial magnetic field with a high inclination (−73◦) to the ecliptic plane [25], allowing a long duration and intense Bs to be embedded. 2) this ICME may have interacted with another narrow CME, which erupted an hour earlier than this CME from the same solar source region [27]. During propagation, the preceding narrow CME may be cannibalised by the subsequent large CME, or its propagating direction was deflected away from the Sun-Earth line during the interaction and thus not recorded by the WIND spacecraft.
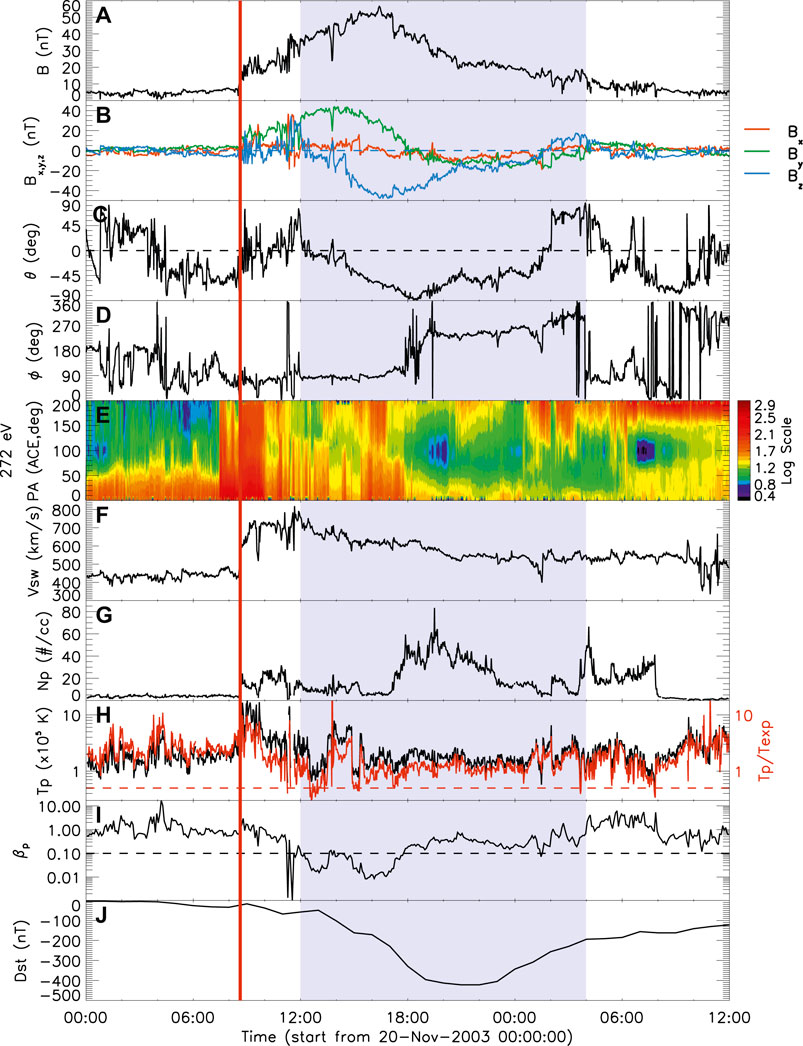
FIGURE 1. Wind observations from 2003 November 20 00:00 to 2003 November 21 12:00. From top to bottom, the panels are: (A) the magnetic field strength (
3 Extreme Bs due to Multiple ICME Interaction: 2001 March 31 Event
Figure 2 shows an example of multiple ICME interaction event: the 2001 March 31 event. This event has been widely discussed by different authors [15,28]. As shown in Figure 2, an ICME (shown as the first gray shadow) was detected from 06:18 UT to 12:22 UT on March 31. During this period, the interplanetary observations show obvious ICME signatures with enhanced magnetic field strength, smoothly rotated magnetic field vector, low proton temperature, and low plasma beta. This ICME drove a shock ahead of it (red vertical line), featured by sudden and simultaneous enhancements of the magnetic field, solar wind speed, proton density, and temperature. Bs in this ICME was extremely strong with the mean value of 35.39 nT and maximum value of 48.44 nT. This is the ICME event with the strongest Bs recorded near the Earth from 1995 to 2020 based on the USTC ICME catalogue [13]. After the arrival of the extremely strong Bs carried by this ICME, there was an intense geomagnetic storm with Dstmin of -387 nT at 09:00 UT. About 1 h later, another ICME crossed the Earth from 13:30 UT to 21:22 UT on March 31. This ICME also carried intense Bs with the mean value of 25.36 nT and the maximum value of 35.38 nT. This is the sixth strongest ICME in Bs from 1995 to 2020. Between the two ICMEs, an interaction region exhibited with less regular magnetic field direction, lower magnetic field intensity, higher proton density, higher temperature, and higher plasma β compared with the values in ICMEs [15]. Those signatures are consistent with the magnetic reconnection between the two ICMEs, which may reduce the magnetic field strength and heat the plasma temperature [29]. The abnormally high plasma temperature in the first ICME and the first half of the second ICME suggested a strong interaction and compression between them. The velocity at the rear of the second ICME has obviously increased from 600–800 kms−1. It might be caused by another ejecta, which was detected by the Wind spacecraft on April 1 at 05:26UT. The interval between the second ICME and the following ejecta exceeds 6 h. The following ejecta is not likely to interact with the second ICME adequately, according to the interaction criterion from Shen et al. [9]. Therefore, the interaction between CMEs was primarily responsible for the extraordinarily intense Bs in these two ICMEs.
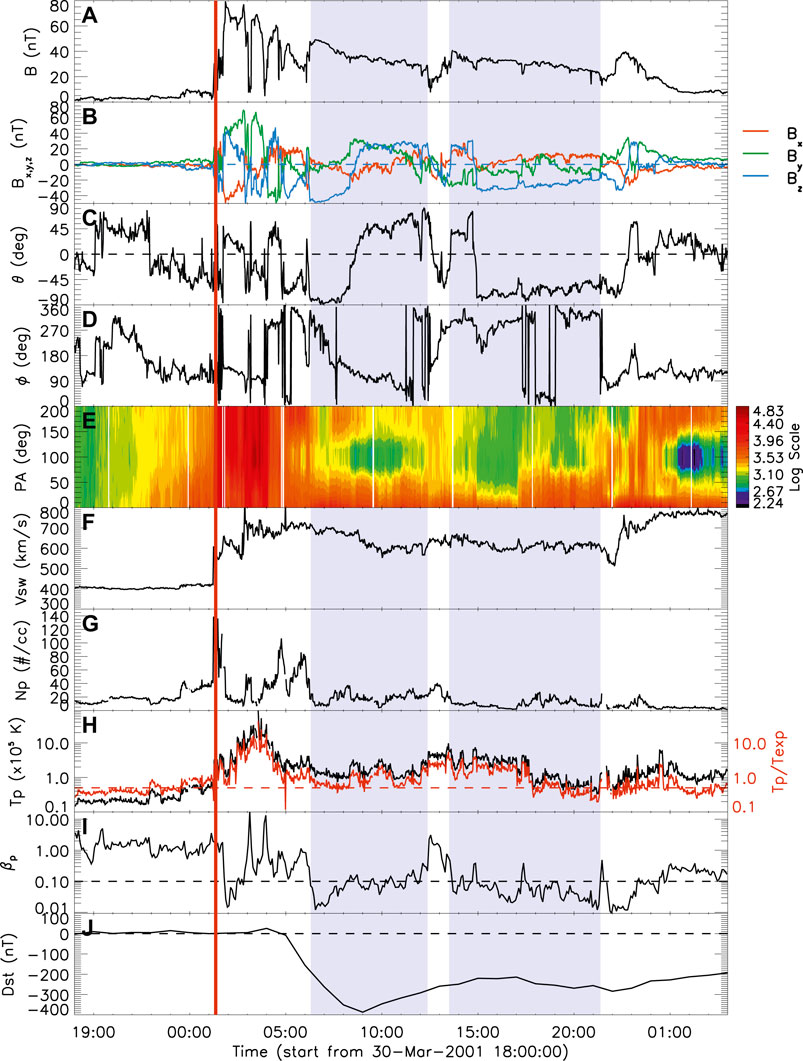
FIGURE 2. Wind observations from 2001 March 30 18:00 to 2001 April 1 04:00 with the associated geomagnetic storm index (Dst). The panels are the same as in Figure 1.
4 Extreme Bs Due to Shock-ICME Interaction
Another widely known mechanism that can cause extremely intense Bs is the interaction between shocks and ICMEs. This type of interaction event is identified when the shock driven by the subsequent ICME with a higher velocity propagates into the preceding ICME [20]. Based on the recent works, there are two types of shock-ICME interaction events, i.e., shock-ICME interaction event, and shock passing through preceding ICME event.
4.1 Typical Shock-ICME Interaction Event: 2001 November 5 Event
Figure 3 shows an example of the shock-ICME interaction event: 2001 November five event. This event has also been widely studied by many authors [20,30]. Wang et al. [20] first reported this event as a shock-ICME interaction event. It caused an intense geomagnetic storm with the peak value of the Dst index of −292 nT. An obvious ICME signature arrived at the Earth at 20:19UT on November 5, as shown in Figure 3. After 9 h, Wind spacecraft recorded the rare boundary of this ICME at 05:26 UT on November 6. During the passage of the ICME, an obvious shock was recorded at the time of 01:43 UT on November 6, which was caused by the subsequent ICME showing in Figure 3 as the left gray shadow. The magnetic field intensity increased noticeably from 22 to 68 nT after the arrival of this shock. In particular, the magnitude of Bs increased from 5 to 52 nT. For this ICME, the Bs had a mean value of 23.07 nT and a maximum value of 74.47 nT. The following ICME also showed a strong Bs with a mean value of 25.41 nT. This shock-ICME event was the fifth strongest ICME in Bs from 1995 to 2020 based on the USTC ICME catelogue. The shock compression from the previous ICME generated this incredibly severe Bs. It’s worth noting that this shock-ICME interaction increased not only the magnetic field’s intensity but also the intensity of solar energy particles (SEP) within it [30]. Such enhancement is another important influence of shock-ICME interaction in the space weather effect of ICMEs.
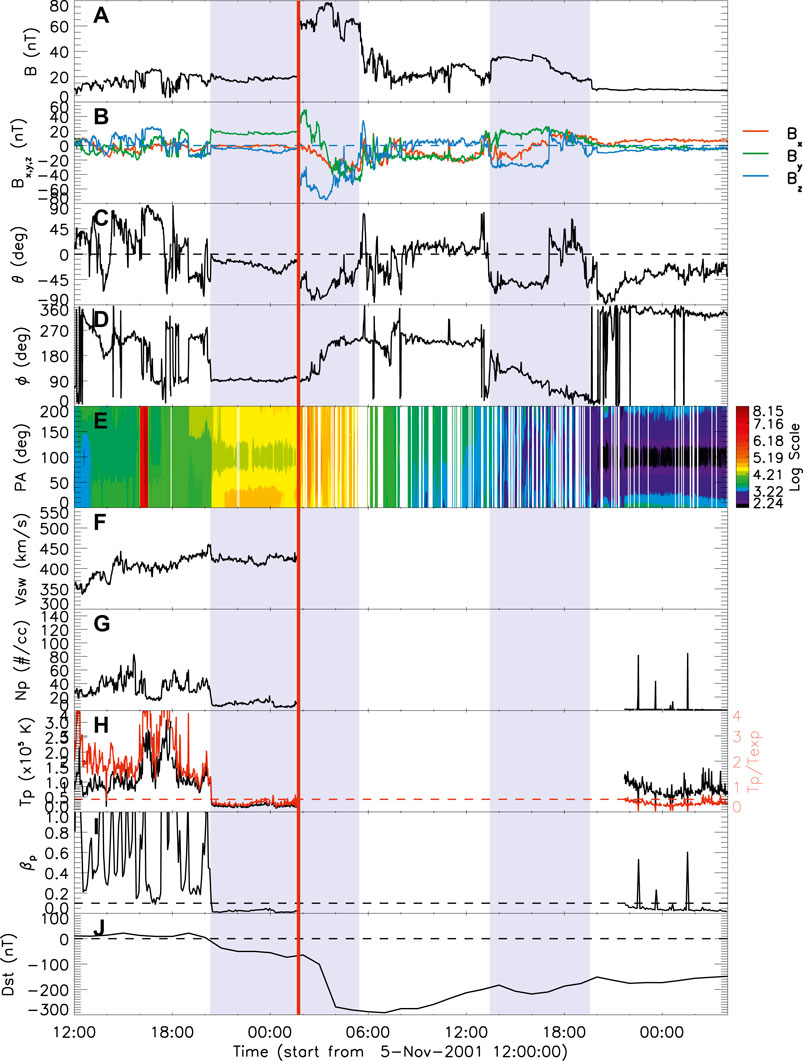
FIGURE 3. Wind observations from 2001 November 5 12:00 to 2001 November 7 04:00. The panels are the same as in Figure 1.
4.2 Shock Passing Through Preceding ICME: The 2012 June 16 Event
On 2012 June 16, another ICME with extremely strong Bs was recorded near the Earth. This event caused a geomagnetic storm with the peak value of the Dst index of −71 nT. Figure 4 shows the Wind observations of this ICME starting from 08:00 UT on 2012 June 16. From 22:07 UT on June 16, 2012, to 11:20 UT on June 17, 2012, a regular structure, shown as the first shaded region in the figure, passed through the Earth. During this period, the magnetic field intensity enhanced, the directions of the magnetic field rotated smoothly and the temperature and plasma β are relatively lower than those in the solar wind. These signatures indicated that this structure was an ICME. This ICME structure has also been reported by Srivastava et al. [31], Kilpua et al. [32], Scolini et al. [33] and Chi et al. [24]. About 3 h before the arrival of this ICME, two obvious shocks with the signatures of the obvious jumps of magnetic field intensity, solar wind velocity, proton density and proton temperature were recorded by Wind at 19:30 UT (red vertical line) and 20:53 UT (dashed red vertical line) on June 16. Based on the Wind observations, it is hard to identify which shock is related to the following ICME and what the interplanetary sources of the two shocks are. At 20:02 UT on June 17, another ICME arrived at the Earth, lasting about 8 h (indicated as the left gray shadow). It should notice that the interval between these two ICMEs was 8.6 h, and there were no significant signatures of CME interaction. Thus, the interaction between these two ICMEs might be very weak.
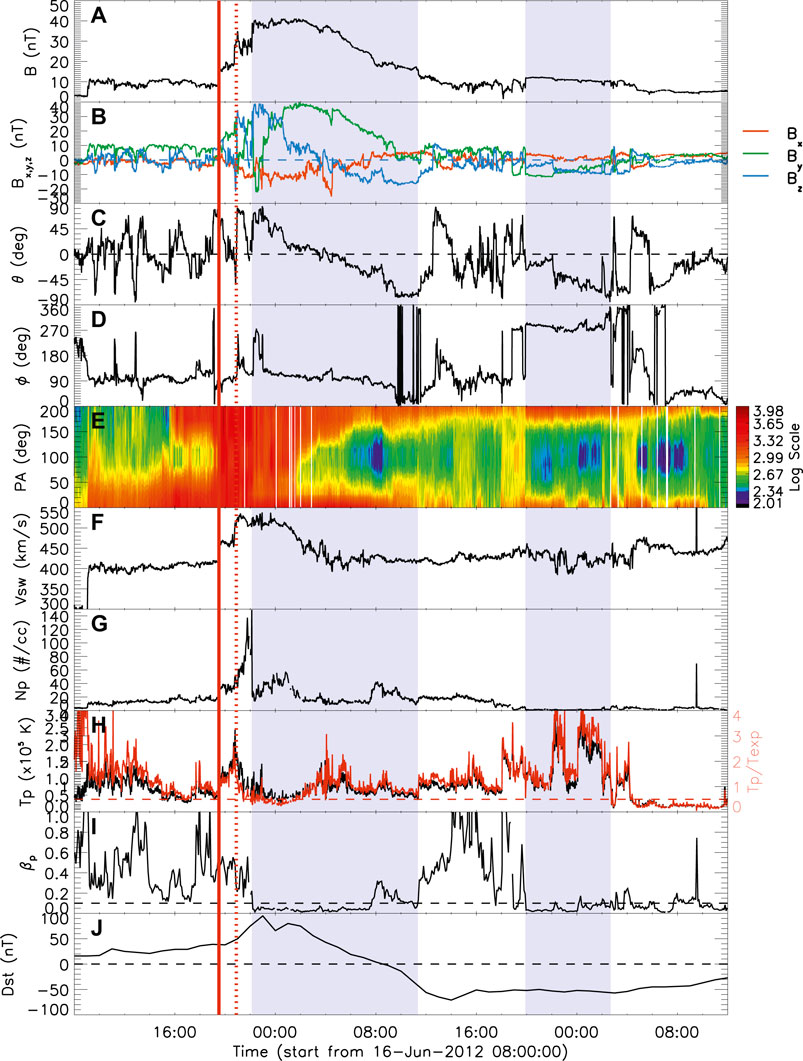
FIGURE 4. Wind observations from 2012 June 16 to 2012 June 18. The panels are the same as in Figure 1.
The magnetic field intensity of the preceding ICME is extremely high. The maximum value and the mean value of the total magnetic field intensity are 41.14 and 30.31 nT, respectively. It is the top four strongest ICME in magnetic field strength, according to the ICME catalogue compiled by USTC ICME catalogue. It is caused by a weak interaction between two ICMEs, or by an ‘isolated’ ICME.
Fortunately, Venus is almost parallel to the Sun-Earth line, with a separation angle of only 5° at this time. Using the Venus Express observations [34], different authors studied the evolution of these structures during their propagation from the Sun to the Earth [24,32]. Figure 5 shows the observations of this event near Venus. The intervals of data when Venus Express was close to or within the Venusian magnetosphere have been cut out based on the radial distance of the spacecraft to the centre of Venus (as shown in the last panel). An obvious shock-ICME structure with a sudden enhancement in magnetic field can be identified in Figure 5. Combined with the interplanetary observations near the Earth, we can suggest that the two ICMEs observed by Venus Express corresponded to the two ICMEs observed near the Earth. The shock inside the ICME recorded by Venus Express corresponded to the second shock before the first ICME near the Earth. This shock was driven by the second ICME, and it arrived at Venus at 04:53UT on June 16 and arrived at the Earth at the time of 20:53 UT. The time of the shock detected at Venus and Earth is comparable to the predicted arrival time of the second CME from EUHFORIA model [32] and Heliospheric Upwind eXtrapolation time model [24]. Combined with these observations, we can conclude that the shock driven by the second ICME has already passed through the first ICME. These analyses have also been done by Chi et al. [24]. This event show another origination of extremely intense Bs in side ICME: a shock driven by the following ICME passes through the preceding ICME.
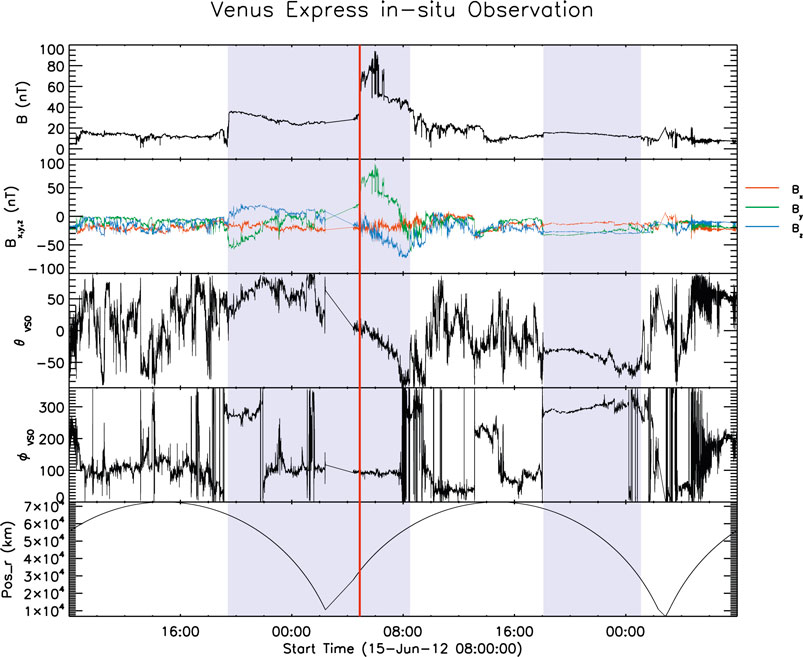
FIGURE 5. Venus Express observations from 2012 June 16 to 2012 June 18. From top to bottom, the panels display magnetic field strength, x, y, and z components in VSO coordinates, elevation θ and azimuth ϕ of the magnetic field direction in VSO coordinates, and the radial distance of the spacecraft to the center of Venus. The arrival of the shock is indicated by the red vertical line. The intervals of the two ICMEs are shown by the gray shaded areas.
5 Statistical Result
To make a further analysis, we analyzed all the ICMEs events with Bs,mean ≥ 10nT during the period from 1995 to 2020 using the USTC ICME catalogue. Due to the lack of Venus Express observations for most events, we simply divided all the ICME events observed by Wind into three groups: isolated ICMEs (I-ICMEs), multiple ICMEs (M-ICMEs), and shock-ICME interaction events (S-ICMEs), using the same criteria from Shen et al. [9]. When the time interval between two ICMEs is less than 6 h, the two or three ICMEs are grouped together as an M-ICMEs event. It is characterised as an S-ICME when in-situ observations identify a shock generated by a subsequent ICME propagating into the preceding ICME or passing through the preceding ICME.
During this period, there are 48 ICME groups with Bs,mean ≥ 10nT and 8 ICMEs with Bs,mean ≥ 20nT. Table 1 shows the numbers of such events originated in different types of ICME events. It is found that 39.6% (20 in 48) of Bs,mean ≥ 10nT events and 50% (4 in 8) of Bs,mean ≥ 20nT events are associated with shock-ICME events. Meanwhile, we also present the percentage of different types of ICMEs with Bs,mean ≥ 10nT and Bs,mean ≥ 20nT. It is found that the possibilities of S-ICMEs causing intense Bs are much higher than that of other groups. Meanwhile, I-ICMEs are much less likely to have intense Bs. These results suggest that the interaction between multiple CMEs, especially the interaction between shock and CME is the main cause of intense Bs in the interplanetary space. It is consistent with the prior results from Shen et al. [9,18] and Xu et al. [21], that the interaction between multiple CMEs has a greater chance of generating severe geomagnetic storms.
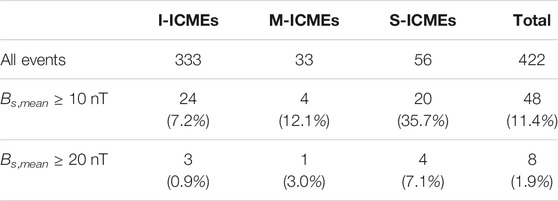
TABLE 1. The numbers and percentages of ICME groups in different types with strong Bs,mean.
6 Conclusion and Discussion
In this work, we studied the origin of extremely intense Bs based on the typical events analysis and statistical analysis. In the analysis of the typical events, four events with extremely high Bs were studied in detail. Extremely intense Bs have been discovered to come from a variety of ICME types, including I-ICMEs, M-ICMEs, S-ICMEs with shocks inside ICMEs, and S-ICMEs with shocks passed through ICMEs. Furthermore, we studied all the ICME events with Bs,mean ≥ 10nT from 1995 to 2020, and found that the interaction events (i.e., M-ICMEs, and S-ICMEs) can result in extremely high Bs with a higher probability. The possible reason is the compression. For M-ICMEs, the compression between two ICMEs can enhance the magnetic field intensity. While, for S-ICMEs, the shock compression the magnetic field inside the previous ICME might be the main mechanism. When we compare the two interaction ICME types, we find that approximately 35.7% of S-ICMEs events had Bs,mean ≥ 10nT, which is significantly higher than that of M-ICMEs (12.1%). It makes sense because the shock can intensify the pre-condition Bs by a factor of 3–6 [35]. The intensity of Bs embedded in the preceding ICME can be amplified when the shock driven by the subsequent ICME propagated into the preceding one. Because the intensity of Bs is a key parameter for intense geomagnetic storms, these findings confirm the previous results that ICME interaction events are more likely to cause intense geomagnetic storms [9,17].
It should be noted that, we reported a special type of ICMEs with extremely intense Bs: S-ICMEs with shocks passing through ICMEs. This type of S-ICME observed at 1AU appears to be an I-ICME. As a result, it is difficult to distinguish this type in the statistical analysis, only based on the interplanetary observations near the Earth. It is a plausible assumption that some I-ICMEs detected by Wind spacecraft may not be the real isolated ICME events. In addition, Lugaz et al. [17] reported another possibility that some multiple-ICMEs interaction events could also exhibit I-ICME signature [19,36]. These results suggest an overestimate of the possibility of I-ICMEs in carrying extremely intense Bs. The direct and multi-point observations of CME’s propagation in interplanetary space from Solar Ring Mission [37] will be valuable in advancing our understanding of such phenomena.
Data Availability Statement
Publicly available datasets were analyzed in this study. This data can be found here: https://cdaweb.gsfc.nasa.gov/index.html/.
Author Contributions
CS design and made the main analysis of this work. YC and MX analyzed the typical events. YW take part in the discussion.
Funding
This work is supported by grants from the NSFC (41822405,41774181, 42004143, 41774178, 41904151), the Strategic Priority Program of CAS (XDB41000000), the Fundamental Research Funds for the Central Universities (WK2080000140, WK2080000122), project funded by China Postdoctoral Science Foundation (2019M652194), and Anhui Provincial Natural Science Foundation (1908085MD107).
Conflict of Interest
The authors declare that the research was conducted in the absence of any commercial or financial relationships that could be construed as a potential conflict of interest.
The handling editor declared a past co-authorship with one of the authors MX.
Publisher’s Note
All claims expressed in this article are solely those of the authors and do not necessarily represent those of their affiliated organizations, or those of the publisher, the editors and the reviewers. Any product that may be evaluated in this article, or claim that may be made by its manufacturer, is not guaranteed or endorsed by the publisher.
Acknowledgments
We acknowledge the Venus Express team and WIND team for providing the data.
References
1. Gosling JT, McComas DJ, Phillips JL, Bame SJ. Geomagnetic Activity Associated With Earth Passage of Interplanetary Shock Disturbances and Coronal Mass Ejections. J Geophys Res (1991) 96:7831. doi:10.1029/91ja00316
2. Xue X, Wang C, Dou X. An Ice-Cream Cone Model for Coronal Mass Ejections. J Geophys Res Space Phys (2005) 110:A08103. doi:10.1029/2004ja010698
3. Zhang J, Richardson I, Webb D. Solar and Interplanetary Sources of Major Geomagnetic Storms (Dst ≤ −100 nT) During 1996–2005. J Geophys Res Space Phys (2007) 112:A10102. doi:10.1029/2007JA012321
4. Echer E, Gonzalez W, Tsurutani B. Interplanetary Conditions Leading to Superintense Geomagnetic Storms (Dst ≤ −250 nT) during Solar Cycle 23. Geophys Res Lett (2008) 35:L06S03. doi:10.1029/2007gl031755
5. Wu C-C, Lepping RP. Geomagnetic Activity Associated With Magnetic Clouds, Magnetic Cloud-Like Structures and Interplanetary Shocks for the Period 1995-2003. Adv Space Res (2008) 41:335–8. doi:10.1016/j.asr.2007.02.027
6. Richardson IG, Cane HV. Near-Earth Interplanetary Coronal Mass Ejections During Solar Cycle 23 (1996 - 2009): Catalog and Summary of Properties. Sol Phys (2010) 264:189–237. doi:10.1007/s11207-010-9568-6
7. Yermolaev YI, Nikolaeva N, Lodkina I, Yermolaev MY. Recovery Phase of Magnetic Storms Induced by Different Interplanetary Drivers. J Geophys Res Space Phys (2012) 117:A08207. doi:10.1029/2012ja017716
8. Wu C-C, Gopalswamy N, Lepping RP, Yashiro S. Terrestrial. Atmos Oceanic Sci (2013) 24:233. doi:10.3319/tao.2012.09.26.03(sec)
9. Shen C, Chi Y, Wang Y, Xu M, Wang S. Statistical Comparison of the ICME's Geoeffectiveness of Different Types and Different Solar Phases from 1995 to 2014. J Geophys Res Space Phys (2017) 122:5931–48. doi:10.1002/2016ja023768
10. Kilpua E, Koskinen HE, Pulkkinen TI. Coronal Mass Ejections and Their Sheath Regions in Interplanetary Space. Living Rev Solar Phys (2017) 14:5. doi:10.1007/s41116-017-0009-6
11. Gonzalez WD, Joselyn JA, Kamide Y, Kroehl HW, Rostoker G, Tsurutani BT, et al. What Is a Geomagnetic Storm? J Geophys Res (1994) 99:5771. doi:10.1029/93ja02867
12. Gonzalez WD, Tsurutani BT, Clúa de Gonzalez AL. Interplanetary Origin of Geomagnetic Storms. Space Sci Rev (1999) 88:529–62. doi:10.1023/a:1005160129098
13. Chi Y, Shen C, Wang Y, Xu M, Ye P, Wang S. Statistical Study of the Interplanetary Coronal Mass Ejections From 1995 to 2015. Sol Phys (2016) 291:2419–39. doi:10.1007/s11207-016-0971-5
14. Wu C-C, Lepping R. Effect of Solar Wind Velocity on Magnetic Cloud-Associated Magnetic Storm Intensity. J Geophys Res Space Phys (2002) 107:SSH 3-1. doi:10.1029/2002JA009396
15. Wang YM, Ye PZ, Wang S. Multiple Magnetic Clouds: Several Examples During March–April 2001. J Geophys Res Space Phys (2003) 108:1370. doi:10.1029/2003JA009850
16. Wu C-C, Lepping RP. Relationships Among Geomagnetic Storms, Interplanetary Shocks, Magnetic Clouds, and Sunspot Number During 1995 - 2012. Sol Phys (2016) 291:265–84. doi:10.1007/s11207-015-0806-9
17. Lugaz N, Temmer M, Wang Y, Farrugia CJ. The Interaction of Successive Coronal Mass Ejections: A Review. Sol Phys (2017) 292:64. doi:10.1007/s11207-017-1091-6
18. Shen C, Xu M, Wang Y, Chi Y, Luo B. Why the Shock-ICME Complex Structure Is Important: Learning From the Early 2017 September CMEs. Astrophysical J (2018) 861:28. doi:10.3847/1538-4357/aac204
19. Chi Y, Zhang J, Shen C, Hess P, Liu L, Mishra W, et al. Observational Study of an Earth-Affecting Problematic ICME From STEREO. Astrophysical J (2018) 863:108. doi:10.3847/1538-4357/aacf44
20. Wang Y, Ye P, Wang S, Xue X. An Empirical Formula Relating the Geomagnetic Storm's Intensity to the Interplanetary Parameters: VBz and Δt. Geophys Res Lett (2003) 30. doi:10.1029/2003GL017901
21. Xu M, Shen C, Wang Y, Luo B, Chi Y. Importance of Shock Compression in Enhancing ICME's Geoeffectiveness. Astrophysical J (2019) 884:L30. doi:10.3847/2041-8213/ab4717
22. Liu YD, Chen C, Zhao X. Characteristics and Importance of "ICME-In-Sheath" Phenomenon and Upper Limit for Geomagnetic Storm Activity. Astrophysical J (2020) 897:L11. doi:10.3847/2041-8213/ab9d25
23. Scolini C, Chané E, Temmer M, Kilpua EKJ, Dissauer K, Veronig AM, et al. CME-CME Interactions as Sources of CME Geoeffectiveness: The Formation of the Complex Ejecta and Intense Geomagnetic Storm in 2017 Early September. Astrophysical J Suppl Ser (2020) 247:21. doi:10.3847/1538-4365/ab6216
24. Chi Y, Scott C, Shen C, Owens M, Lang M, Xu M, et al. Using the "Ghost Front" to Predict the Arrival Time and Speed of CMEs at Venus and Earth. Astrophysical J (2020) 899:143. doi:10.3847/1538-4357/aba95a
25. Gopalswamy N, Yashiro S, Michalek G. Solar Source of the Largest Geomagnetic Storm of Cycle 23. Geophys Res Lett (2005) 32(12). doi:10.1029/2004gl021639
26. Yushkov K, Gnezdilov G, Markeev S. Solar and Heliospheric Disturbances that Resulted in the Strongest Magnetic Storm of November 20, 2003. Geomagnetism and Aeronomy (2005) 45:20.
27. Wang Y-M, Shen C-L, Ye P-Z, Wang S. Comparison of Space Weather Effects of Two Major Coronal Mass Ejections in Late 2003. J Univ Sci Technology China (2007) 37(8):859–867.
28. Farrugia C, Jordanova V, Thomsen M. A Two-Ejecta Event Associated With a Two-Step Geomagnetic Storm. J Geophys Res Space Phys (2006) 111:A11104. doi:10.1029/2006ja011893
29. Lugaz N, Manchester IV WB, Gombosi TI. Numerical Simulation of the Interaction of Two Coronal Mass Ejections From Sun to Earth. Astrophysical J (2005) 634:651–62. doi:10.1086/491782
30. Shen C, Wang Y, Ye P, Wang S. Enhancement of Solar Energetic Particles During a Shock - Magnetic Cloud Interacting Complex Structure. Sol Phys (2008) 252:409–18. doi:10.1007/s11207-008-9268-7
31. Srivastava N, Mishra W, Chakrabarty D. Interplanetary and Geomagnetic Consequences of Interacting CMEs of 13 - 14 June 2012. Sol Phys (2018) 293:5. doi:10.1007/s11207-017-1227-8
32. Kilpua EKJ, Good SW, Palmerio E, Asvestari E, Lumme E, Ala-Lahti M, et al. Multipoint Observations of the June 2012 Interacting Interplanetary Flux Ropes. Front Astron Space Sci (2019) 6:50. doi:10.3389/fspas.2019.00050
33. Scolini C, Rodriguez L, Mierla M, Pomoell J, Poedts S. Observation-Based Modelling of Magnetised Coronal Mass Ejections With EUHFORIA. Astron Astrophysics (2019) 626:A122. doi:10.1051/0004-6361/201935053
34. Zhang T, Baumjohann W, Delva M. Magnetic Field Investigation of the Venus Plasma Environment: Expected New Results From Venus Express. Planet Space Sci (2006) 54:1336. doi:10.1016/j.pss.2006.04.018
35. Yue C, Zong Q. Solar Wind Parameters and Geomagnetic Indices for Four Different Interplanetary Shock/ICME Structures. J Geophys Res Space Phys (2011) 116:A12201. doi:10.1029/2011ja017013
36. Dasso S, Mandrini CH, Schmieder B. Linking Two Consecutive Nonmerging Magnetic Clouds With Their Solar Sources. J Geophys Res Space Phys (2009) 114:A02109. doi:10.1029/2008ja013102
Keywords: interplanetary coronal mass ejection, shock-ICME interaction, multiple ICMEs, intense Bs, interplanetary magnetic field
Citation: Shen C, Chi Y, Xu M and Wang Y (2021) Origin of Extremely Intense Southward Component of Magnetic Field (Bs) in ICMEs. Front. Phys. 9:762488. doi: 10.3389/fphy.2021.762488
Received: 22 August 2021; Accepted: 25 October 2021;
Published: 26 November 2021.
Edited by:
Qiang Hu, University of Alabama in Huntsville, United StatesReviewed by:
Talwinder Singh, University of Alabama in Huntsville, United StatesXochitl Blanco-Cano, National Autonomous University of Mexico, Mexico
Copyright © 2021 Shen, Chi, Xu and Wang. This is an open-access article distributed under the terms of the Creative Commons Attribution License (CC BY). The use, distribution or reproduction in other forums is permitted, provided the original author(s) and the copyright owner(s) are credited and that the original publication in this journal is cited, in accordance with accepted academic practice. No use, distribution or reproduction is permitted which does not comply with these terms.
*Correspondence: Chenglong Shen, Y2xzaGVuQHVzdGMuZWR1LmNu