Abstract
African swine fever first broke out in mainland China in August 2018 and has caused a substantial loss to China’s pig industry. Numerous investigations have confirmed that trades and movements of infected pigs and pork products, feeding pigs with contaminative swills, employees, and vehicles carrying the virus are the main transmission routes of the African swine fever virus (ASFV) in mainland China. However, which transmission route is more risky and what is the specific transmission map are still not clear enough. In this study, we crawl the data related to pig farms and slaughterhouses from Baidu Map by writing the Python language and then construct the pig transport network. Following this, we establish an ASFV transmission model over the network based on probabilistic discrete-time Markov chains. Furthermore, we propose spatiotemporal backward detection and forward transmission algorithms in semi-directed weighted networks. Through the simulation and calculation, the risk of transmission routes is analyzed, and the results reveal that the infection risk for employees and vehicles with the virus is the highest, followed by contaminative swills, and the transportation of pigs and pork products is the lowest; the most likely transmission map is deduced, and it is found that ASFV spreads from northeast China to southwest China and then to west; in addition, the infection risk in each province at different times is assessed, which can provide effective suggestions for the prevention and control of ASFV.
1 Introduction
African swine fever (ASF) is a highly infectious and fatal disease of wild boars and domestic pigs caused by the African swine fever virus (ASFV) [1]. It is characterized by featuring a short course of onset, a mortality rate of up to 100% in the most acute and acute infections; clinical manifestations of fever; cyanosis of the skin; and obvious bleeding in lymph nodes, kidneys, and gastrointestinal mucosa [2]. The first African swine fever outbreak in mainland China was reported in a pig farm on August, 2018, in Shenbei District, Shenyang City of Liaoning Province [3]. According to the report of the Chinese government, within 1 month after the onset of clinical symptoms, all 400 pigs on the pig farm died [4]. Since then, the disease has spread rapidly throughout China and caused the deaths of more than one million pigs [5]. According to epidemiological investigation, ASFV was transmitted in mainland China mainly by three ways. First, trades and movements of pigs themselves as well as pork products; second, feeding pigs with contaminative swills (i.e., food residue from restaurants); and third, contaminated transport vehicles or employees without effective disinfection, that is, employees and vehicles with the virus which spreads over others [6, 7].
African swine fever broke out in China in August 2018 and has caused great economic losses for the market of pigs and pig products. Since the first spread of ASFV to China, the study about transmission regularity and control strategies has been in progress. Zhang et al. established a dynamic model to explore the impact of disinfection and fixation of employees on ASFV spread in the pig farms and presented some essential requirements for large-scale pig farms to decrease the transmission risk of ASFV [8]. Li et al. used the vulnerability index and data envelopment analysis (DEA) method to assess the regional vulnerability to ASF in mainland China from August 2018 to July 2019 and gave the severity level of African swine fever in 31 provinces in mainland China [9]. Vergne et al. evaluated the relative contribution of stable flies to the transmission of the African swine fever virus by establishing a model of the vector-borne transmission mechanism of ASFV in outdoor pig farms [10]. Ma et al. studied the distribution characteristics of African swine fever cases based on spatiotemporal clustering and the directional distribution analysis method and determined the high-risk areas of African swine fever outbreaks using the presence-only maximum entropy (MaxEnt) ecological niche model [11]. Akhmetzhanov et al. estimated the reproduction numbers, serial intervals, and transmission distances of ASF in China, according to the reconstructed ASF transmission network based on the nearest neighbor method, exponential function, equal probability, and spatiotemporal case distribution algorithms [12]. However, none of these efforts focused on the transmission process of ASFV in mainland China, and it is unclear how ASFV spreads after it has been introduced into China or how the transmission risks of the three transmission routes are. The network transmission model not only takes into account the transmission mechanism of infectious diseases but also can reflect the structure of the transmission network and has been widely used in the study of epidemic transmission [13, 14]. It will be a good choice to study the transmission process of African swine fever in mainland China.
In this study, we collect data related to pig farms and slaughterhouse locations from Baidu Map in web crawler. From this, we construct a pig transportation network and establish an ASFV transmission model on the basis of discrete-time Markov chains. Then, we propose spatiotemporal backward detection and forward transmission algorithms on the semi-directed weighted network from the constructed network and established model to analyze the risk of transmission routes, to infer the most likely transmission map of ASF in mainland China, and to assess the infection risk in different provinces at different times. Figure 1 shows the overall framework of the study.
FIGURE 1
2 Materials and Methods
According to the report on the official website of the Ministry of Agriculture and Rural Affairs, PRC (http://www.moa.gov.cn), ASF mainly breaks out in pig farms and some slaughterhouses. This study deals with the spread of ASFV in mainland China from August 1, 2018, to August 31, 2019, taking pig farms and slaughterhouses as the main research objects. According to the current pig breeding mode in China, the live pig industry chain from top to bottom includes pig forage, pig breeding, slaughtering, meat product processing and manufacturing, and the sale of pork and its products. We take the live pig feeding and slaughter processing industry chain which has a direct relationship with the spread of ASF as the mainline to describe the transmission of ASFV along the pig transport route as shown in Figure 2. Pig farms include small-, medium-, and large-scale farms, which are mainly engaged in the farrowing and breeding of pigs, and pig trade is carried out between these pig farms. When they are fattened to a sufficient weight, the pigs from pig farms are transported to the slaughterhouses for slaughter. The construction of the pig transportation network and the establishment of the transmission model followed are both based on this trading mode above.
FIGURE 2
2.1 Data
2.1.1 Data Collection
Data for African swine fever cases: We collected surveillance data of ASFV in mainland China from the official website of the Ministry of Agriculture and Rural Affairs of the People’s Republic of China (http://www.moa.gov.cn) from August 1st, 2018, to August 31st, 2019. They include the geographical location, the type of site (pig farm or slaughterhouse), date of onset, date of report, the number of pig stocks, and whether to enable the emergency response mechanism, take blockade, and prohibit pigs or pork products to be transferred out or into the blockade area.
Data for the geographical location of the pig farm and slaughterhouse: We apply the Python language to crawl the information of pig farms and slaughterhouses in each city from Baidu Map. The search terms in the Python language include “geographic name,” “pig farm, pig farmer, pig breeding cooperative,” and “slaughterhouse, slaughter.” The extracted results include data about the names and longitude and latitude of all sites. Figure 3 shows the GIS visualization map of the extracted pig farms and slaughterhouses.
FIGURE 3
Data for the pig production and total population: The pig output in each province was obtained from the China Animal Husbandry and Veterinary Yearbook [15], and the total population of each province was obtained from the China Statistical Yearbook [16].
2.1.2 Data Cleaning and Preprocessing
Data cleaning: In order to make the data related to pigs and pork products accurate, we need to manually delete some sites not related to pig and pig slaughter from the above results.
Data preprocessing: We calculate the Euclidean distances between any two pig farms, each pig farm and slaughterhouse, based on their longitude and latitude using Eq. 1:
In Eq. 1, Lat. P1 (Lat.P2) and Lon. P1 (Lon.P2) are the latitude and longitude of site P1 (P2), respectively, in Baidu Map; Γ is the Euclidean distance between site P1 and P2 [17].
2.2 Pig Transport Network Construction
After these above preparations, we start to construct the pig transport network. The network considered here is a semi-directed and weighted network G = (V, E), where V represents the set of nodes and E denotes a set of edges [18]. As follows, we give the specific network construction project:
Nodes: The nodes can be divided into two types: pig farm node and slaughterhouse node.
Edges: We construct two types of edges according to the maximum Euclidean distance between different types of nodes:
The maximum distance is determined according to article [19], which gives that the maximum Euclidean distance observed in the farm-to-farm movements was 289 km, while in the farm-to-abattoir movements, it was 285 km.
Time-varying: The network is temporally dynamic. Nodes and edges are deleted or added according to the information obtained from the official website of the Ministry of Agriculture and Rural Affairs, PRC (http://www.moa.gov.cn), on whether the areas with ASF outbreaks have activated the emergency response mechanism: the blockade shall be adopted to prohibit the transfer of live pigs or pork products out of or into the blocked areas.
2.3 Transmission Model
In this section, a network dynamic model based on the discrete Markov process is established in terms of the transmission process of ASFV along the pig transport route [
20]. Nodes in the network comprise pig farm nodes and slaughterhouse nodes. According to the states of nodes, the pig farm nodes are divided into four states: susceptible (
Sf), latent (
Ef), infected (
If), and dead (
Df), while the slaughterhouse nodes are divided into susceptible (
Sh) and infected (
Ih).
Vrepresents the virus carried by employees and vehicles, coming out from latent, infected, and dead (culled) pig farms, which then spreads the virus to other pig farms where they enter without thorough disinfection.
Wrepresents the contaminative swills (i.e., food residue from restaurants), which is released by pork from infected slaughterhouses and spreads the virus to others. In addition, susceptible pig farms and slaughterhouses can be infected through the trades and movements of pigs. Based on the above, the transmission process of ASF in pig farms and slaughterhouses is shown in
Figure 4. The detailed state transitions of nodes in the network are as follows:
1) The susceptible pig farm (Sf) is infected by the ASF virus carried by employees and vehicles (V), contaminative swills (W), or latent pig farms neighbor (Ef) and infected pig farm neighbors (If) due to the trades and movements of pigs with probability λvf(t) + λwf(t) + λff (i, t) and then becomes (Ef);
2) The latent pig farm (Ef) becomes the infected farm (If) with probability σ;
3) The infected pig farm (If) is culled with probability d, which then becomes the dead pig farm (Df);
4) The susceptible slaughterhouse (Sh) is infected by latent pig farm neighbor (Ef) and infected pig farm neighbor (If) due the trades of infected pigs with probability , which then becomes (Ih).
FIGURE 4
In order to more accurately describe the status of different nodes at time t, two sub-states of the infected node (I) are introduced, which are “contagious”(C) and “maintained contagious” (M) in Figure 4. The contagious state (C) represents the node’s newly infected state. The node in state C at the time t means that the node is susceptible at time t − 1, but it is infected at time t. An infected node first transits to contagious (C) at time t and then transits to being misled (M) at time t + 1. The node in the M state will remain infected until it dies and is removed from the network. By synthesizing the above description and flow chart in Figure 4, a network dynamic model of ASF based on the discrete Markov process is established. The meanings and values of variables and parameters involved in the model are shown in Tables 1, 2.
TABLE 1
| Variable | Interpretation |
|---|---|
| ∂jin | The set of pig farm neighbors connected to slaughterhouse node j in the network |
| ∂i | The set of pig farm neighbors of pig farm node j in the network |
| di′i | The distance between node i′ and node i |
| ηi′i | The transmission probability from pig farm i′ to pig farm i |
| ηij | The transmission probability from pig farm node i to slaughterhouse node j |
| The number of pig outputs in the province where pig farm i is located | |
| The total population of the province where pig farm i is located | |
| λvf(t) | The probability that a susceptible pig farm being infected with the ASF virus carried by employees and vehicles V at time t |
| λwf(t) | The probability that a susceptible pig farm being infected by contaminative swills (W) at time t |
| λff (i, t) | The probability of a susceptible pig farm i being infected by its latent or infected pig farm neighbor at time t |
| The probability that the arbitrary pig farm i is state Y at time t, Y ∈ {S, E, C, I, D} | |
| The probability that the arbitrary slaughterhouse j is in state Y at time t, Y ∈ {S, C, I} |
Meanings of the variables in the model.
TABLE 2
| Parameter | Interpretation | Value | Source |
|---|---|---|---|
| Σ | The transformation rate of pig farms from the latent state to the infected state | 0.1 | [8] |
| D | The culling rates of the infected pig farm | 0.7 | [8] |
| βff | The infection rate of the infected pig farm to the susceptible pig farm | 0.3 | Assumed |
| βfh | The infection rate of the infected pig farm to the susceptible slaughterhouse | 0.28 | LHS |
| βvf | The infection rate of latent, infected, or dead pig farms to susceptible employees and vehicles | 0.49 | LHS |
| βwf | The infection rate of the infected slaughterhouse to contaminative swills | 0.36 | LHS |
Descriptions and values of the parameters in the model.
Briefly, the modeling idea is illustrated by exampling the state transition of a pig farm node. At time
t, a susceptible farm (
Sf) node
ican be infected through the following three ways and transformed into a latent pig farm node (
Ef):
1) Virus carried by employees and vehicles (V): The virus from latent (Ef), infected (If), and dead (Df) pig farms at time t − 1 attaches to the relevant transport vehicles or employees and then transmits to susceptible pig farms. The probability that a susceptible pig farm is not infected with the ASF virus carried by employees and vehicles means that none of its latent, infected, or dead pig farm neighbors spread the virus to it through vehicles or employees. Therefore, the probability that a susceptible pig farm i being infected with the ASF virus carried by employees and vehicles at time t is as follows:
2) Contaminative swills (W): Infected slaughterhouses (If) at time t − 1 sold pork products to restaurants, and then, susceptible pigs in pig farms can be infected by eating contaminated swills (i.e., food residue from restaurants) (W). The probability that a susceptible pig farm is not infected by contaminative swills means that none of its infected slaughterhouse neighbors spread the virus to it through pork products. Therefore, the probability that a susceptible pig farm i being infected with the ASF virus carried by contaminative swills at time t is as follows:
3) Trades of infected pigs and pork products: The susceptible pig farm at time t − 1 can be infected by the importation of infected pigs from latent (Ef) or infected (If) pig farm neighbors. The probability that a susceptible farm is not infected means that none of its latent or infected pig farm neighbors spread the virus to it through their links. Therefore, the probability that a susceptible farm node i being infected by its latent or infected pig farm neighbors at the time t is as follows:
where
ηi′iis the transmission probability of pig farm
i′ to pig farm
i, and the formulation is as follows:
In Eq. 5, βff is the maximum infection rate among pig farms, and Ki′i means the transmission kernel function at pig farm node i′ to i [21].
When node i′ and i are the pig farms in the same province, the kernel function Ki′i is calculated by the distance between the two farms di′i. The closer the distance is, the bigger the value is, and its expression is as follows:where k0 and d0 determine the form of the kernel function, and the value refers to Ref. [21].
When nodes i′ and i are pig farms from different provinces, the value Ki′i of the kernel function not only is determined by the distance between the two farms di′i but also depends on the pig output and and the total population and of the provinces. Its expression is as follows:
In conclusion, the probability that an arbitrary susceptible pig farm node i at time t − 1 is still in the susceptible state at time t is as follows:
That is, the pig farm is not infected by any of the above three ways.
The expression of the probability that pig farm node i is in the latent state at time t is as follows:
The pig farm node i that is in the latent state at time t − 1 is first converted to the newly infected state C with transformation rate σ. Thus, the expression of the probability that an arbitrary pig farm node i is in the contagious state at time t is as follows:
Pig farm node i is in the infection state at time t, which means that it is newly infected at time t or it has been in the infection state and not culled before time t. The expression of the probability that pig farm node i is in the infection state at time t is as follows:
Pig farm node i is in the dead state at time t, which means that it was in the infection state at time t − 1 and culled at time t or it has been in the dead state before time t. The expression of the probability that pig farm node i is in the dead state at time t is as follows:
The probability that the slaughterhouse node is in each state at time t can be deduced in a similar manner. In conclusion, the network dynamics model of ASF based on the Markov process can be obtained as follows:
The terms and in the model 13) can be deduced as follows:
Here, expressions 6 and 7 should be applied for kernel function Ki′i and Kij depending on whether the adjacent pig farms or slaughterhouses belong to the same province.
2.4 Algorithm
Based on the pig transport network and ASFV network dynamics model, the spatiotemporal backward detection and forward transmission algorithms on the semi-directed network are proposed in this section to detect the most probable infection source for each infected pig farm and slaughterhouse and to infer the most likely transmission route and the infection risk of nodes in the network at different times.
2.4.1 Spatiotemporal Backward Detection
In this section, the spatiotemporal backward detection algorithm on a semi-directed weighted network is proposed to detect the most likely infection source of each infected pig farm or slaughterhouse. The spatiotemporal backward detection algorithm proposed in this section is inspired by the algorithm proposed in Ref. [13]. The similarities are as follows: 1) they are both dynamic networks from the perspective of whether the network is changeable with time; 2) The detection mechanism is the same in time, and both are inverse detection. The differences are as follows: 1) The network structure is different, as the network is a directed weighted network in [13], while the algorithm proposed in this section is a semi-directed weighted network; 2) the spatial detection mechanism is different. The former is reverse detection, while in this section, apart from reverse detection, two-way detection is also applied in the algorithm; 3) the connection weights of edges are different. The connection probability of the two nodes in the former is related to the spatial distance, while in this section, in addition to the spatial distance, the number of pig productions and the total population are relative to the probability of the two nodes’ connection. This algorithm is detailed as shown in Table 3.
Table 3
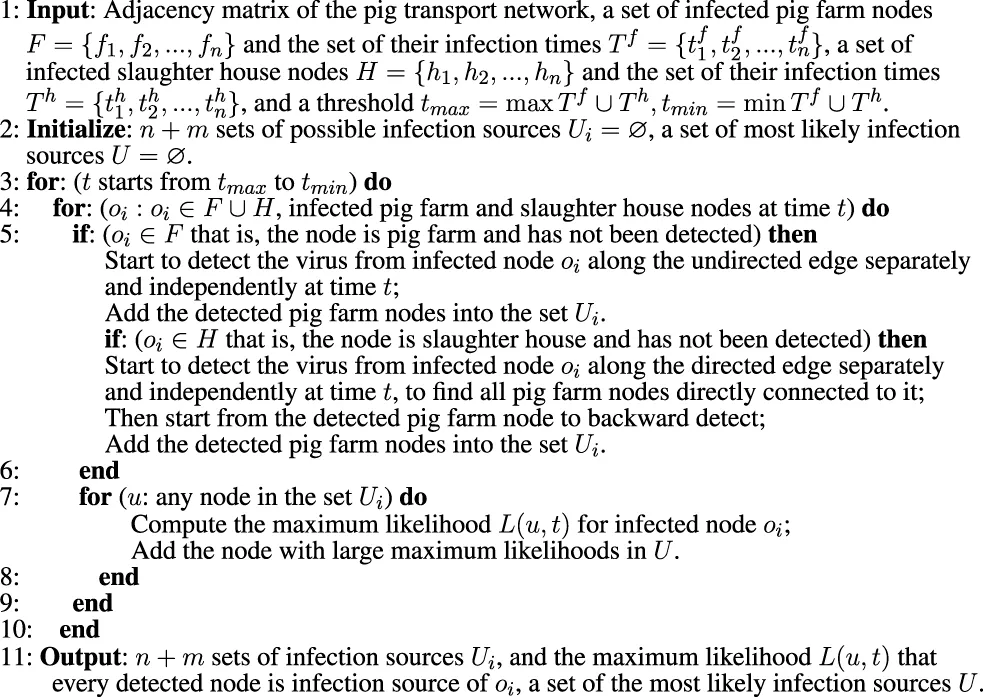 |
Spatiotemporal backward detection algorithm in a semi-directed weighted network.
The pig transport network constructed here records the spatial location and infection time of each infected pig farm or slaughterhouse. In infection source set U, the real infection source of the infected pig farm node or slaughterhouse node is more consistent with the real situation in space and time than other nodes. The key role of the algorithm proposed in the section is the disease transmission model (13), which shows the probability of any nodes which are in newly infected state C at time t. PC(u, ts|oi) means the probability that node u is in the newly infected state C, and the reverse detection begins from the objected node oi in the span of ts. According to Bayes’ rule, the probability that node u transmits the virus to node oi is in proportion to the probability that node oi transmits the virus back to the infected node u [22]. That is, P (oi|u) ∼ P (u|oi).
To brief the calculation available, the maximum likelihood is derived by ln (⋅), which is induced by the logarithmic function, and the expression is as follows:
Mathematically, among all nodes in possible infection source set Ui detected in the algorithm, the node with the largest maximum likelihood is defined as the most likely infection source of objected nodes oi, namely,
2.4.2 Spatiotemporal Forward Transmission
As a node may infect multiple nodes, the spatiotemporal forward propagation algorithm on a semi-directed weighted network is proposed in this section to determine the transmission influence of the infection source node in the whole network and to calculate the infection risk of nodes in the network at different times. The details of this algorithm are shown in Table 4.
TABLE 4
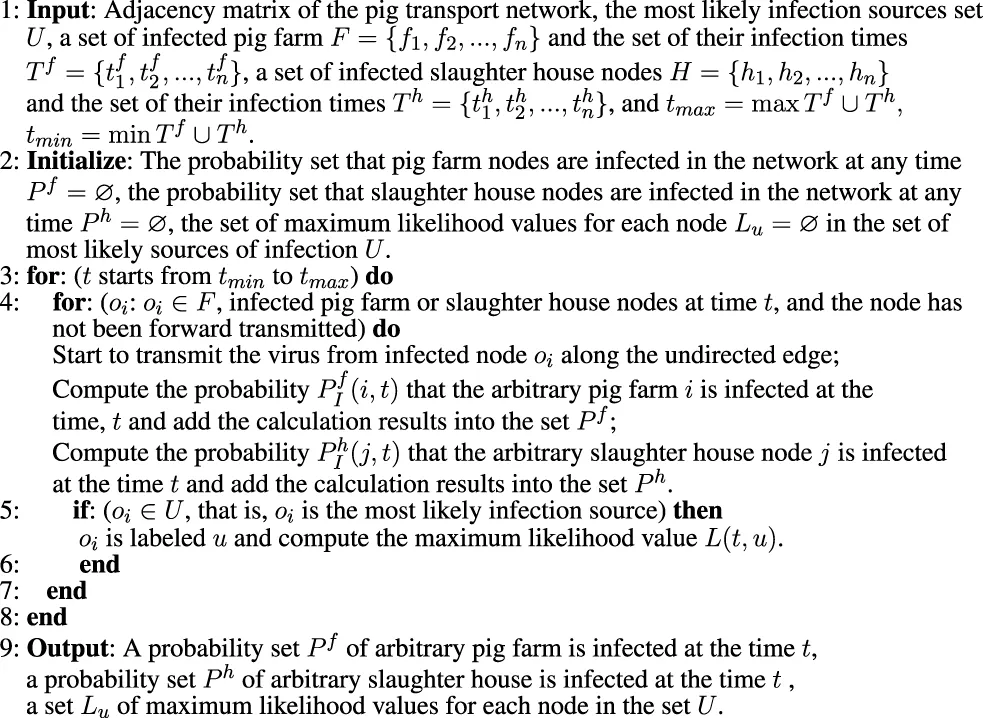 |
Spatiotemporal forward transmission algorithm in the semi-directed weighted network.
PC(oi, ts|u) represents the probability that node oi is in the newly infected state C after the time span ts, starting forward transmission from the infection source node u. L (t, u) represents the maximum likelihood when the infection source node u transmits the virus to infected object nodes at time t. To brief the calculation available, the maximum likelihood is derived by logarithmic function ln (⋅), and the expression is as follows:
In addition, Eq. 19 can be used to estimate the infection size I (t, u), which is infected by the spread of the infection source detected at time t. The validity of the algorithm proposed in this section can be verified through reviewing the accuracy of I (t, u). Its expression is as follows:
3 Results
In this section, based on the pig transport network and a network dynamic model of ASFV, the simulation of the spatiotemporal backward detection and forward transmission algorithm is proposed on the semi-directed weighted network, the infection source nodes are detected, the risk of three main transmission routes of ASFV is analyzed, the most likely transmission map is inferred, and the infection risk in provinces at different times is shown.
3.1 Detected Infection Sources
The most likely infection source for every infection node can be detected by the spatiotemporal backward detection algorithm. In this section, we take an infected pig farm node f20 in Liaoning province and an infected slaughterhouse node h6 in Guizhou province as examples since the ASF virus first reported, and the largest number of ASFV nodes occurred in the two provinces. Figure 5 shows all the probable infection sources of f20 as well as h6 detected by the algorithm and the sequence of the maximum likelihood L (u, t). As the infection rates βff, βfh, βvf, βwf in model 13) and the formula of maximum likelihood L (u.t) are uncertain, in this section, the four parameters are sampled of a 1,000 times of random sampling with the Latin hypercube sampling method (LHS) on the assumption that the parameters are in correspondence with the normal distribution to calculate the maximum likelihood L (u.t), and the simulation results are shown in the form of the violin plots, and the median, quartile range, and 95% confidence interval are shown. As shown in Figure 5A, for infected pig farm nodes f20, six possible pig farms are detected as infection sources, among which the maximum likelihood value L (u, t) of the pig farm f5 is greater than the other five possible infection sources, so pig farm f5 is the most likely infection source for infected pig farm f20. Similarly, as shown in Figure 5B, node f126 is the most likely infection source for infected slaughterhouse h6.
FIGURE 5
Then, based on the most likely infection source detected, spatiotemporal forward transmission is carried out on the constructed pig transport network. Eq. 19 is used to estimate the size I (u, t) of infected objects that were infected by the infection source at time t. The effectiveness of the algorithm is verified. Figure 6 shows the reported accumulated infected cases as well as estimated accumulated infected cases from infection sources by forward transmission from August 2018 to August 2019. The results show that there is a small difference between the estimated accumulative cases and reported accumulative cases, so the model and algorithm proposed in this study are verified rationally.
FIGURE 6
3.2 Risk Analysis of Transmission Routes
There are three main transmission ways of ASFV in mainland China: first, trades and movements of pigs and pork products; second, feeding pigs with contaminative swills (i.e., food residue from restaurants); and third, employees and vehicles with the ASF virus which spreads over others. In this section, the risk of three transmission routes is analyzed.
First, the uncertainty and sensitivity of the parameters regarding the maximum likelihood L (u, t) of the infection source are analyzed. Uncertainty analysis and sensitivity analysis of parameters based on LHS and partial rank correlation coefficients (PRCCs) have previously been used in many infectious disease models [23, 24]. Taking infected nodes f20 and h6 as examples, Figure 7 shows the PRCCs of these four parameters to L (u, t) of all detected possible infection sources. The PRCC value of the parameter to L (u, t) is proportional to the correlation of this parameter to L (u, t). That is, the larger the PRCC value of the parameter is, the greater the influence of the parameter with regard to L (u, t) is. Figure 7 shows that the PRCC value (|PRCC| > 0.8, p < 0.05) related to the maximum likelihood L (u, t) regarding the infection rate βvf of employees and vehicles with the virus is the highest, that is, the virus transmission carried by employees and vehicles has the greatest influence on the maximum likelihood L (u, t), followed by the infection rate βwf (|PRCC| > 0.7, p < 0.05) of contaminative swills; for the infection rate βff, βfh, the PRCC value is lower, that is, it has little influence on the maximum likelihood L (u, t).
FIGURE 7
In addition, based on the parameters obtained in Section 4.1, it is assumed that only one of the three transmission routes, which forward-transmits the ASF virus on the constructed pig transport network, plays a role. The number of infected nodes is compared under the three transmission routes. Figure 8 shows the newly infected nodes per month which are simulated under three assumptions. By comparison, it is found that the number of newly infected sites per month is the highest when only the virus carried by employees and vehicles is taken into account. When only contaminative swills (i.e., food residue from restaurants) are considered, the number of infected nodes is moderate; when only trade of infected pigs is considered, the number of infected nodes is the lowest. In summary, among the three main transmission routes of ASFV in mainland China, the infection risk for employees and vehicles with the virus is the highest, followed by contaminative swills, and the trade of infected pigs is the lowest.
FIGURE 8
3.3 Most Likely Transmission Map
The most likely infection source for each infected node in the network can be detected by the spatiotemporal backward detection algorithm on the semi-directed network, and the transmission path can be known. Based on the transmission path of each infected node, the most likely transmission path map in provinces in mainland China from August 1, 2018, to August 31, 2019, can be deduced. Figure 9A shows the distribution of infected pig farms and slaughterhouses by ASFV in mainland China from August 1, 2018, to August 31, 2018, with 10 cases in Liaoning province, 3 cases in Zhejiang province, and 1 case each in Henan, Jiangsu, and Anhui provinces. Figure 9B presents the most likely ASFV transmission map by the spatiotemporal backward detection algorithm. The results generally show that ASFV spreads from northeast China to southwest China and then to west.
FIGURE 9
In particularly, according to the notice of “The General Office of the Ministry of Agriculture and Rural Affairs of the People’s Republic of China on Typical Cases of Violation of Laws and Disciplines in the Prevention and Control of ASF” issued by the Ministry of Agriculture and Rural Affairs of the People’s Republic of China (http://www.moa.gov.cn), on September 29, 2018, after the test by China Animal Health and Epidemiology Center, the source of the pigs from the slaughterhouse of Shuanghui Food Company in Zhengzhou city, Henan province, where ASF broke out on August 14, 2018, is Jiamusi, Heilongjiang province (marked with a solid blue line); on July 30, 2018, in the course of transferring pigs from Heilongjiang province, which was directed by a company in Siping city, Jilin province, ASF broke out (marked with a yellow solid line); on June 2018, piglets bought by a farmer of Shenyang, Liaoning province, from Jilin province died out of control, and the pigs sold to a farmer were confirmed to be infected with ASF on August 2. In summary, before August 1, 2018, there had been ASFV cases in Heilongjiang and Jilin provinces (marked by the red five-pointed star), and the source of pandemic occurred in Henan and Jilin provinces was most likely to be Heilongjiang. The epidemic in Liaoning province was probably spread from Jilin province.
3.4 Risk Assessment of Spatiotemporal Infection
The infection probability of each pig farm and slaughterhouse in the network at time t can be calculated by the spatiotemporal forward detection algorithm on the semi-directed weighted network. In reference to the whole pig transportation network in mainland China, the infection risk of each province at different times can be shown, as shown in Figure 10, which shows the infection risk of ASFV in provinces at four times as examples. Figure 10A shows the infection risk map of provinces in mainland China in October 2018. As a result, the infection risk in Liaoning province is the highest, followed by adjacent areas of the Inner Mongolia autonomous region and Jilin province. In addition, several provinces in central China and east China have a higher infection risk, while southwest China and northwest China have the lowest. Figure 10B shows the infection risk map in various provinces of mainland China in December 2018. The result depicts that at this time, the distribution with a high infection risk has shifted to some provinces in central China, south China, and southwest China, and some provinces in northwest China have a higher infection risk than before. Figure 10C shows the distribution of infection risk in various provinces of mainland China in April 2019. The result shows that the infection risk is generally low in northeast China, north China, and east China, while it is high in south, southwest, and northwest China. Figure 10D presents a distribution of infection risk in the provinces of mainland China in June 2019, showing that the overall infection risk has decreased at this time, with the highest risk of infection in southwest China. Summarily, with regard to the infection risk of ASFV in mainland China, the overall infection risk has been high by January 2019. As the regulatory measures such as the ban on pig transfer have been enhanced, the infection risk gradually decreases, and the high-risk areas gradually shift from northeast to southwest and northwest China.
FIGURE 10
4 Conclusion
In this study, the pig transmission network and the network dynamics model of ASFV based on the discrete Markov process are built based on the site’s data of pig farms and slaughterhouses which are extracted from Baidu Map in the Python language. In addition, the spatiotemporal backward detection and forward algorithms on the semi-directed weighted network are proposed to detect the source of infection of pig farms and slaughterhouses infected with ASFV. Through the analysis on the transmission route risk, it is concluded that the spread risk of employees and vehicles with the virus is the highest, followed by the contaminated swill (i.e., food residue from restaurants), while the risk of pig and pork product trades is relatively lower. By tracing the source of the infected sites, we give the possible transmission path map of ASFV in mainland China. The map shows that ASFV is spread from northeast China to southwest China and then westward. By calculating the probability of each node in the network being infected at different times, we give the infection risk of each province at different times on a large spatial scale.
The innovation of this study is the establishment of a data-driven network transmission dynamics model of African swine fever, which is used to assess the transmission risk of ASFV in three transmission ways in mainland China. In practice, it is found that the transmission risk of employees and vehicles with the virus is the highest, and the infection risk in different regions at different times is shown, which can provide effective suggestions for the prevention and control of ASFV.
There are also some defects in the study. For example, we only crawled the location information of pig farms and slaughterhouses from Baidu Map and then constructed the pig transport network based on the distance between them, which may be deviated from the actual pig trade network. In the future study, we will integrate the actual traffic data between cities into the spread of infectious diseases on the network. Besides, we ignored the community structure of the real pig trade network when building the transmission model [25, 26], which is worth to be paid attention and further studied. In addition, the network transmission model we established in the study lacks theoretical analysis due to its high dimension. Therefore, it is necessary to further study the high-dimensional system dimension reduction method of the network propagation dynamics model and to analyze dynamic behavior. In general, this study depicts the risk of different transmission routes of ASFV in mainland China, which can provide effective suggestions for the prevention and control of the pandemic and is practical.
Statements
Data availability statement
The original contributions presented in the study are included in the article/Supplementary Material, and further inquiries can be directed to the corresponding author.
Author contributions
All authors have made great contributions to the writing of the study and approved the submitted version. J-HH, G-QS, and ZJ conceived and designed the study and established the dynamical model. XP collected the data and constructed the network. J-HH and XP wrote the algorithms and simulated the results. J-HH wrote the manuscript. G-QS and ZJ provided valuable comments on the manuscript writing.
Funding
This work was supported by the National Natural Science Foundation of China (61873154, 11971278, 12022113, 11671241, and 12101443), the Henry Fok foundation for young teachers (171002), the Shanxi Key Laboratory (201705D111006), the Shanxi Scientific and Technology Innovation Team (201805D131012-1), the Shanxi Scholarship Council of China (HGKY2019004), and the Scientific and Technological Innovation Programs (STIP) of Higher Education Institutions in Shanxi (2019L0082).
Conflict of interest
The authors declare that the research was conducted in the absence of any commercial or financial relationships that could be construed as a potential conflict of interest.
Publisher’s note
All claims expressed in this article are solely those of the authors and do not necessarily represent those of their affiliated organizations or those of the publisher, the editors, and the reviewers. Any product that may be evaluated in this article or claim that may be made by its manufacturer is not guaranteed or endorsed by the publisher.
References
1.
GalindoIAlonsoC. African Swine Fever Virus: a Review. Viruses (2017) 9:103. 10.3390/v9050103
2.
QuemboCJJoriFVoslooWHeathL. Genetic Characterization of African Swine Fever Virus Isolates from Soft Ticks at the Wildlife/domestic Interface in mozambique and Identification of a Novel Genotype. Transbound Emerg Dis (2018) 65:420–31. 10.1111/tbed.12700
3.
LiXTianK. African Swine Fever in china. Vet Rec (2018) 183:300–1. 10.1136/vr.k3774
4.
ZhouXLiNLuoYLiuYMiaoFChenTet alEmergence of African Swine Fever in China, 2018. Transbound Emerg Dis (2018) 65:1482–4. 10.1111/tbed.12989
5.
ShenXPuZLiYYuSGuoFLuoTet alPhylogeographic Patterns of the African Swine Fever Virus. J Infect (2019) 79:174–87. 10.1016/j.jinf.2019.05.004
6.
ZhaiS-LWeiW-KSunM-FLvD-HXuZ-H. African Swine Fever Spread in china. Vet Rec (2019) 184:559. 10.1136/vr.l1954
7.
WangYGaoLLiYXuQYangHShenCet alAfrican Swine Fever in china: Emergence and Control. J Biosafety Biosecur (2019) 1:7–8. 10.1016/j.jobb.2019.01.006
8.
ZhangXRongXLiJFanMWangYSunXet alModeling the Outbreak and Control of African Swine Fever Virus in Large-Scale Pig Farms. J Theor Biol (2021) 526:110798. 10.1016/j.jtbi.2021.110798
9.
LiJGaoLHuangBWangYJinZSunXet alAssessment of Regional Vulnerability to Africa Swine Fever in China during 2018/8‐2019/7 Based on Data Envelopment Analysis Method. Transbound Emerg Dis (2021) 68:2455–64. 10.1111/tbed.13913
10.
VergneTAndraudMBonnetSDe ReggeNDesquesnesMFiteJet alMechanical Transmission of African Swine Fever Virus by Stomoxys Calcitrans : Insights from a Mechanistic Model. Transbound Emerg Dis (2021) 68:1541–9. 10.1111/tbed.13824
11.
MaJChenHGaoXXiaoJWangH. African Swine Fever Emerging in china: Distribution Characteristics and High-Risk Areas. Prev Vet Med (2020) 175:104861. 10.1016/j.prevetmed.2019.104861
12.
AkhmetzhanovARJungS-m.LeeHLintonNYangYYuanBet alReconstruction and Analysis of the Transmission Network of African Swine Fever in People's Republic of China, August 2018-September 2019. bioRxiv (2020). 10.1101/2020.07.12.199760
13.
PeiXJinZZhangWWangY. Detection of Infection Sources for Avian Influenza A(H7N9) in Live Poultry Transport Network during the Fifth Wave in China. IEEE Access (2019) 7:155759–78. 10.1109/ACCESS.2019.2949606
14.
LiH-JXuWSongSWangW-XPercM. The Dynamics of Epidemic Spreading on Signed Networks. Chaos, Solitons & Fractals (2021) 151:111294. 10.1016/j.chaos.2021.111294
15.
Institute of Animal Science B Chinese Academy of Agricultural Sciences, Ministry of Agriculture P. China Animal Husbandry & Veterinary Medicine. Beijing: China animal husbandry & veterinary medicine (2018).
16.
National Bureau of Statistics P. China Statistical Yearbook. Beijing: China Statistics Press (2018).
17.
PamungkasCA. Aplikasi Penghitung Jarak Koordinat Berdasarkan Latitude Dan Longitude Dengan Metode Euclidean Distance Dan Metode Haversine. Jurnal Informa: Jurnal Penelitian dan Pengabdian Masyarakat (2019) 5:8–13. 10.46808/informa.v5i2.74
18.
ZhuPZhiQGuoYWangZ. Analysis of Epidemic Spreading Process in Adaptive Networks. IEEE Trans Circuits Syst (2019) 66:1252–6. 10.1109/TCSII.2018.2877406
19.
Bigras-PoulinMBarfodKMortensenSGreinerM. Relationship of Trade Patterns of the Danish Swine Industry Animal Movements Network to Potential Disease Spread. Prev Vet Med (2007) 80:143–65. 10.1016/j.prevetmed.2007.02.004
20.
LiH-JWangLBuZCaoJShiY. Measuring the Network Vulnerability Based on Markov Criticality. ACM Trans Knowl Discov Data (2021) 16:1–24. 10.1145/3464390
21.
BackerJAHagenaarsTJvan RoermundHJWde JongMCM. Modelling the Effectiveness and Risks of Vaccination Strategies to Control Classical Swine Fever Epidemics. J R Soc Interf (2009) 6:849–61. 10.1098/rsif.2008.0408
22.
LokhovAYMézardMOhtaHZdeborováL. Inferring the Origin of an Epidemic with a Dynamic Message-Passing Algorithm. Phys Rev E (2014) 90:012801. 10.1103/PhysRevE.90.012801
23.
BlowerSMDowlatabadiH. Sensitivity and Uncertainty Analysis of Complex Models of Disease Transmission: an Hiv Model, as an Example. Int Stat Rev/Revue Internationale de Statistique (1994) 62:229–43. 10.2307/1403510
24.
SanchezMABlowerSM. Uncertainty and Sensitivity Analysis of the Basic Reproductive Rate: Tuberculosis as an Example. Am J Epidemiol (1997) 145:1127–37. 10.1093/oxfordjournals.aje.a009076
25.
LiH-JBuZWangZCaoJ. Dynamical Clustering in Electronic Commerce Systems via Optimization and Leadership Expansion. IEEE Trans Ind Inf (2020) 16:5327–34. 10.1109/TII.2019.2960835
26.
LiH-JWangLZhangYPercM. Optimization of Identifiability for Efficient Community Detection. New J Phys (2020) 22:063035. 10.1088/1367-2630/ab8e5e
Summary
Keywords
African swine fever virus, transmission route, pig transport network, dynamic model, assessing the infection risk
Citation
Hu J-H, Pei X, Sun G-Q and Jin Z (2021) Risk Analysis of the Transmission Route for the African Swine Fever Virus in Mainland China. Front. Phys. 9:785885. doi: 10.3389/fphy.2021.785885
Received
29 September 2021
Accepted
18 October 2021
Published
24 November 2021
Volume
9 - 2021
Edited by
Peican Zhu, Northwestern Polytechnical University, China
Reviewed by
Sanling Yuan, University of Shanghai for Science and Technology, China
Hui-Jia Li, Beijing University of Posts and Telecommunications (BUPT), China
Updates
Copyright
© 2021 Hu, Pei, Sun and Jin.
This is an open-access article distributed under the terms of the Creative Commons Attribution License (CC BY). The use, distribution or reproduction in other forums is permitted, provided the original author(s) and the copyright owner(s) are credited and that the original publication in this journal is cited, in accordance with accepted academic practice. No use, distribution or reproduction is permitted which does not comply with these terms.
*Correspondence: Zhen Jin, jinzhn@263.net
This article was submitted to Social Physics, a section of the journal Frontiers in Physics
Disclaimer
All claims expressed in this article are solely those of the authors and do not necessarily represent those of their affiliated organizations, or those of the publisher, the editors and the reviewers. Any product that may be evaluated in this article or claim that may be made by its manufacturer is not guaranteed or endorsed by the publisher.