 Wei Li
 Weiwei Wu1
 Jiuchang Zhang
- 1PowerChina Huadong Engineering Corporation Limited, Hangzhou, China
- 2Department of Civil Engineering, Yunnan Minzu University, Kunming, China
The stability of dam foundations at great depth has always been a challenging problem concerned by designers. This study built a three-dimensional numerical model of the dam and foundation under a complex geological condition in the project area of the Chinese Kala hydropower station. The numerical model was imported into the finite difference software FLAC3D to conduct a numerical simulation. Overload and strength reduction methods were adopted to evaluate the stability of the dam foundation at great depth. The results indicated that the structural faults had an essential impact on the stability of the dam foundation. The stability analysis showed that the safety factor of the dam foundation is greater than 2.5, which met the standard’s requirements. The simulation results can provide a reference for the design and engineering reinforcement of the Kala dam foundation.
Introduction
The stability analysis and safety evaluation of concrete dams are critical in hydraulic engineering, especially for the dam foundations under complex geological conditions. They would like to cause safety problems of dams, such as the failure of the Malpasset arch dam [1]. According to statistics, more than 90 large- and medium-sized gravity dams have the problem of weak structural interfaces at great depths of the dam foundation [2].
Compared with shallow stability, unstable problems in dam foundations at great depths are more complex because they are affected by several factors. First, the accurate geological survey about weak structural interfaces is challenging. Second, there are uncertainties in estimating the mechanical parameters of the weak geomaterials. Because of these difficulties, the accurate evaluation of deep stability for the concrete dam foundations is highly significant in the design. Three methods are widely used to evaluate dam foundation stability: model test, limit equilibrium, and finite element (FEM) or finite difference method (FDM).
The model test method is the most widely used approach in the design of hydropower stations. The whole deformation and failure process can be observed using the overload method. Then, the nonlinear safety factor of the dam is determined [3–5]. However, it is tough to build a feasible physical model with a complex geological condition, and this method also costs many labors and economic resources.
The limit equilibrium method has been widely used in stability analysis, especially for shallow dam foundations. This method is an efficient approach to get safety factor [6]. However, this method assumes that the sliding body is rigid, and only the normal force and tangential force are considered acting on the sliding surface [7]. It does not consider the bending moment and interactions inside the sliding body. Therefore, this method cannot reflect the three-dimensional (3D) characteristics of the sliding surface. Many assumptions and simplifications make its results different from the natural states [8].
Because of excellent performances in simulating complex geological conditions, FEM/FDM has been widely used in designing hydropower projects [9]. Many scholars have conducted in-depth research on the applicability of this method and achieved actual research results. For instance, Xu et al. [10] developed a geometric modeling method for the geology and engineering structures incorporating the geological realities and mesh generation. They performed a stability analysis of a dam foundation based on numerical analysis software such as FLAC3D. Armaghani et al. [9] investigated the role of joints in the initial evaluation of rock mass as foundation and abutment for a cracked concrete arch dam. Wu et al. [11] analyzed the mechanism of uplift deformation of the dam foundation of Jiangya hydropower station. These studies indicate that the FEM/FDM is a good solution for analyzing the stability of dam foundations.
In this study, the dam foundation of the Kala hydropower station in China was taken as an example. First, the complex geological structures established a 3D numerical model of the dam foundation. Then, a nonlinear numerical analysis was carried out by taking the complex boundary conditions into account, such as uplift water pressure. Finally, the overload and strength reduction methods were used to obtain the dam foundation’s safety factor and failure mode. This study was helpful for the design of the Kala hydropower station.
Engineering Descriptions
Kala Hydropower Station
Kala hydropower station is located on the main beach of Yalong River in Muli Tibetan Autonomous County, Sichuan Province, China. It is the seventh level hydropower station in the hydropower development plan in the middle of Yalong River. This hydropower project comprises water-retaining structures, flood discharge, energy dissipation structures, water diversion, and power generation systems. The water-retaining structure is a roller-compacted concrete (RCC) gravity dam.
Topography and Geomorphology
The geomorphic condition at the dam site of Kala reservoir is a typical V-shaped valley. Most of the bedrocks on the left bank are exposed, partially covered with quaternary diluvium, with a thickness of 1 to 5.0 m. The rock masses at the top of the bank slope are weathered and broken, forming collapse deposits. The terrain is steep in the underpart and gentle in the upper part on the right bank. In the underpart, the bedrocks are exposed. The upper part is covered with quaternary colluvium and diluvium, with a thickness of 2 to 10.0 m. The bedrock surface at the riverbed and valley bottom is relatively flat, and the elevation of the bedrock top is generally 1,905 to 1,885 m.
Geological Conditions
Most bedrocks exposed at the dam site are sandy slate, metamorphic sandstone, carbonaceous slate, and marble, which belong to the Zagunao formation (T3Z2-1∼2-17) of the Upper Triassic of Mesozoic. In general, the metamorphic sandstone exhibits a medium thick-layered structure. The sandy slate and carbonaceous slate show a thin-layered structure, and the marble exhibits a thin medium thick-layered structure. The stratum is in a monoclinic structure, and the strike of the stratum is consistent with the river’s flow direction. It inclines to the left bank, and the rock stratum on the right bank is along the slope direction.
There is no regional fault found in the dam site area. However, the structure strongly affected the rock masses in the dam area. Many structural interfaces such as faults, interlayer compression zones, and joint fissures are developed. According to the scales, these structural interfaces can be divided into three ranks, which are classes II, III, and IV. The class II structural interfaces are mainly the NNW direction, which are the control faults in the dam site area.
(1) Class Ⅱ structural interfaces
Five class Ⅱ structural interfaces are found in the dam site area, marked as F116, F75, F115, F152, and F165. They are tensional faults and have an impact on the project. The filling materials in these faults are the cataclastic rock fragments, silty rock fragments, and quartz veins, and some of them have been filled with fault gouge.
(2) Class Ⅲ structural interfaces
There are 83 class Ⅲ structural interfaces developed in the dam site area. Among them, 33 class Ⅲ structural interfaces are common faults, and 14 are compression fracture zones. The strike is in the direction of N21-30°W and N31-40°W dominantly. Most faults are tensional faults, and a small number of faults are compressive faults. Faults such as f73, f59, J87, and J88 are closely related to the dam.
(3) Class Ⅳ structural interfaces
There are 40 class Ⅳ structural interfaces developed in the dam site area. There are 18 small-scale faults, 14 compression fracture zones, and 8 joint fissures. Their strike is in the direction of N31-40°W dominantly, and the proportions of slow, medium, and steep dip angles are similar. Faults such as f138, f134, f141, and f146 are closely related to the dam.
Numerical Model and Simulation Scheme
Modeling Area
Figure 1 shows the 3D numerical model of the Kala dam site area, including RCC gravity dam, bank slopes, and river valley. The bottom elevation of the model is EL. 1,625 m, and the elevation at the top of the dam is EL. 1,995 m. The distances from the two side boundaries parallel to the river channel to the centerline of the riverbed are 336 m. Therefore, the model is 732 m long across the river. The dam axis extends 255 m upstream and 450 m downward, intercepting the upstream and downstream boundaries. Therefore, the model along the river is 705 m long. The height of the mountains on the left and right banks is 593 m, uniformly.
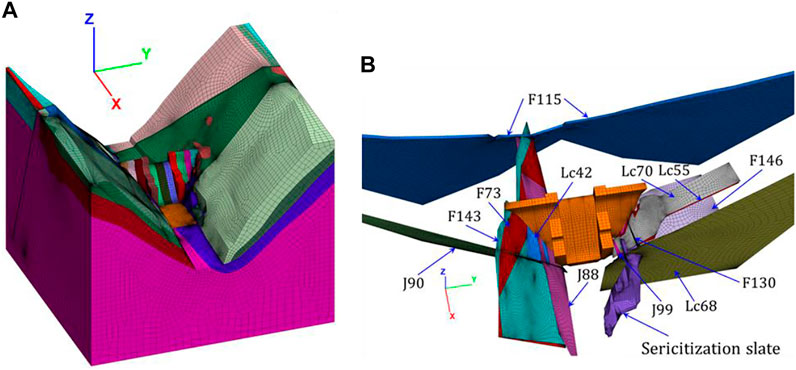
FIGURE 1. (A) The whole numerical mesh model of the Kala hydropower station. (B) Spatial relationship between the Kala dam and the structural interfaces.
The X-axis direction of the model is along the river, and the direction from upstream to downstream is positive. The Y-axis direction is the cross-river direction, and the direction from the right bank to the left bank is the positive direction. The Z-axis direction is vertical, and upward is positive.
Numerical Model Generation
The engineering geological condition at the Kala dam site is very complex. A meshing software Griddle was selected to establish a high-quality numerical model because of its strong mesh-generation performance. Using Griddle, the 3D finite-difference numerical model of the dam and mountain of the Kala hydropower station is established, as shown in Figure 1A. This numerical model has 1,959,824 elements and 937,408 nodes.
Figure 1B shows the spatial relationship between dam and faults. The structural interfaces on the right bank are J90, J88, f73, f143, and Lc42. On the left bank, the structural interfaces are J99, Lc68, Lc70, Lc55, f130, and f146. A sericitization slate is a weak rock mass exposed in the left bank mountain. F115 runs through the mountains on the left and right banks of the dam site area.
Numerical Model of the Dam
The numerical model of the RCC gravity dam is shown in Figure 2, which has 11 dam sections. These dam sections are numbered as 1–11 from left to the right bank. Dam sections 5, 6 and 7 are overflow dam sections. Almost all the numerical grid models of the dam adopt eight-node hexahedral elements, and only some sections adopt triangular wedge elements. The interface elements are set between adjacent dam sections to simulate the interaction between different dam sections.
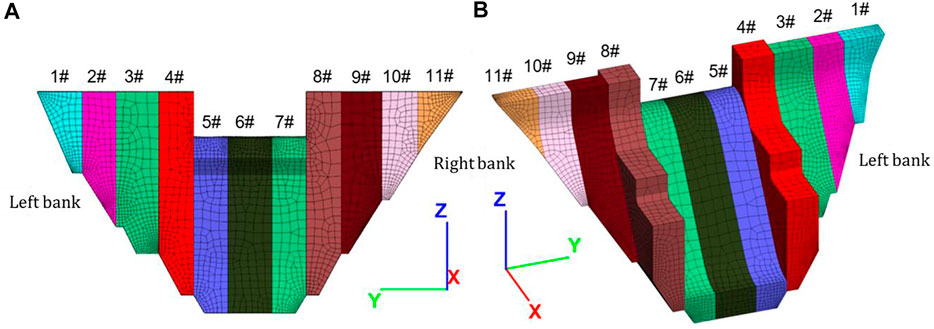
FIGURE 2. The numerical model of the RCC gravity dam of the Kala hydropower station: (A) upstream view, (B) downstream view.
Materials and Mechanical Parameters
The numerical model shown in Figure 1 was imported into the FLAC3D to conduct the numerical simulation. In this model, there are 18 materials involved. Among them, 17 kinds of geomaterials are simulated using the elastic and Mohr–Coulomb plastic constitutive relations. The concrete material in the RRC gravity dam is simulated using the elastic constitutive model. Table 1 lists their mechanical parameters.
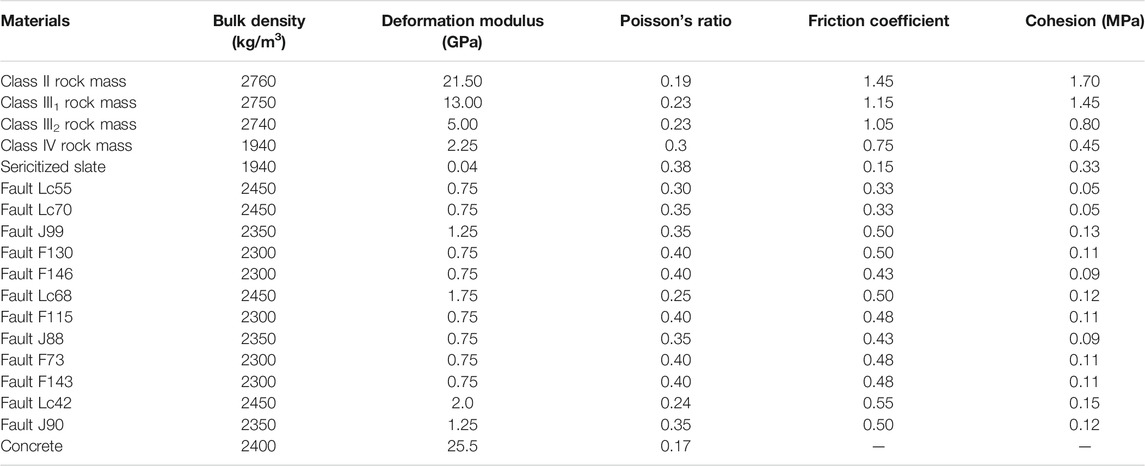
TABLE 1. Mechanical parameters of materials used in the numerical simulation.
Boundary Conditions and Loads
The Z-direction displacement is constrained at the bottom of the model. Normal displacements are constrained on the four vertical side faces of the model. The stress generated by the existing topography under the action of self-weight is used as the initial in situ stress state.
The numerical simulation of this study performs such a procedure. The first step is to activate the foundation elements and simulate the in situ stress by using the self-weight of the foundation; The second step is to activate the dam elements; The third step is to apply water load and uplift pressure. These loads are described as follows.
Self-weight: In the calculation software FLAC3D, the values of material density and gravity acceleration
According to the upstream and downstream water levels, the surface forces of water pressure load can be applied to the upstream surface of the dam. The water pressure on the downstream surface of the dam is a favorable factor for project safety. It is not applied in this study. Figure 3A shows the water pressure load (under the condition of normal water level, EL. 1,987.0 m), which is transformed into the nodal forces and applied on the upstream surface of the Kala dam.
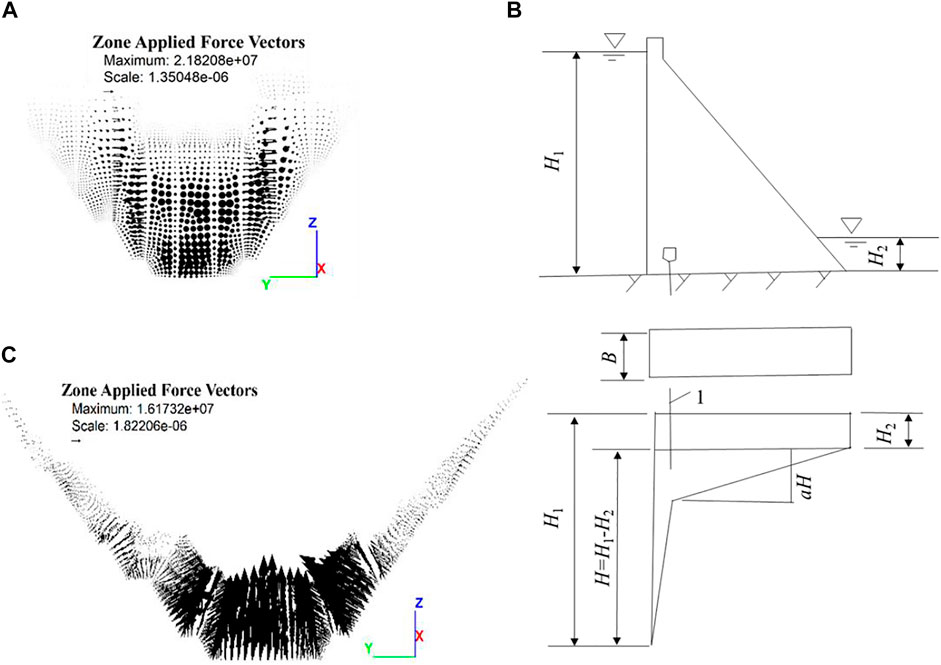
FIGURE 3. (A) Water pressure load transformed into nodal forces applied on the upstream face of the dam. (B) An illustration for showing the calculation procedures of uplift pressure. (C) Uplift pressure load transformed into nodal forces applied on the bottom surfaces of the dam.
According to DL5077-1997 [12], the distribution of uplift pressure applied on the dam bottom is shown in Figure 3B. The seepage pressure intensity coefficient
Simulation Results Under Normal Water Level
Modeling Results of the Holistic Model
Figures 4A, B show the calculation results of the major and minor principal stresses in the dam project area under the condition of normal water level. It can be seen that in the project area, the major and minor principal stresses are in compression dominantly. The major principal stresses are in tension only part of the bank slope, and the maximum value is approximately 0.373 MPa. The maximum tensile minor principal stress is 1.218 MPa, which occurs at the foot of the slope on the left bank downstream of the dam.
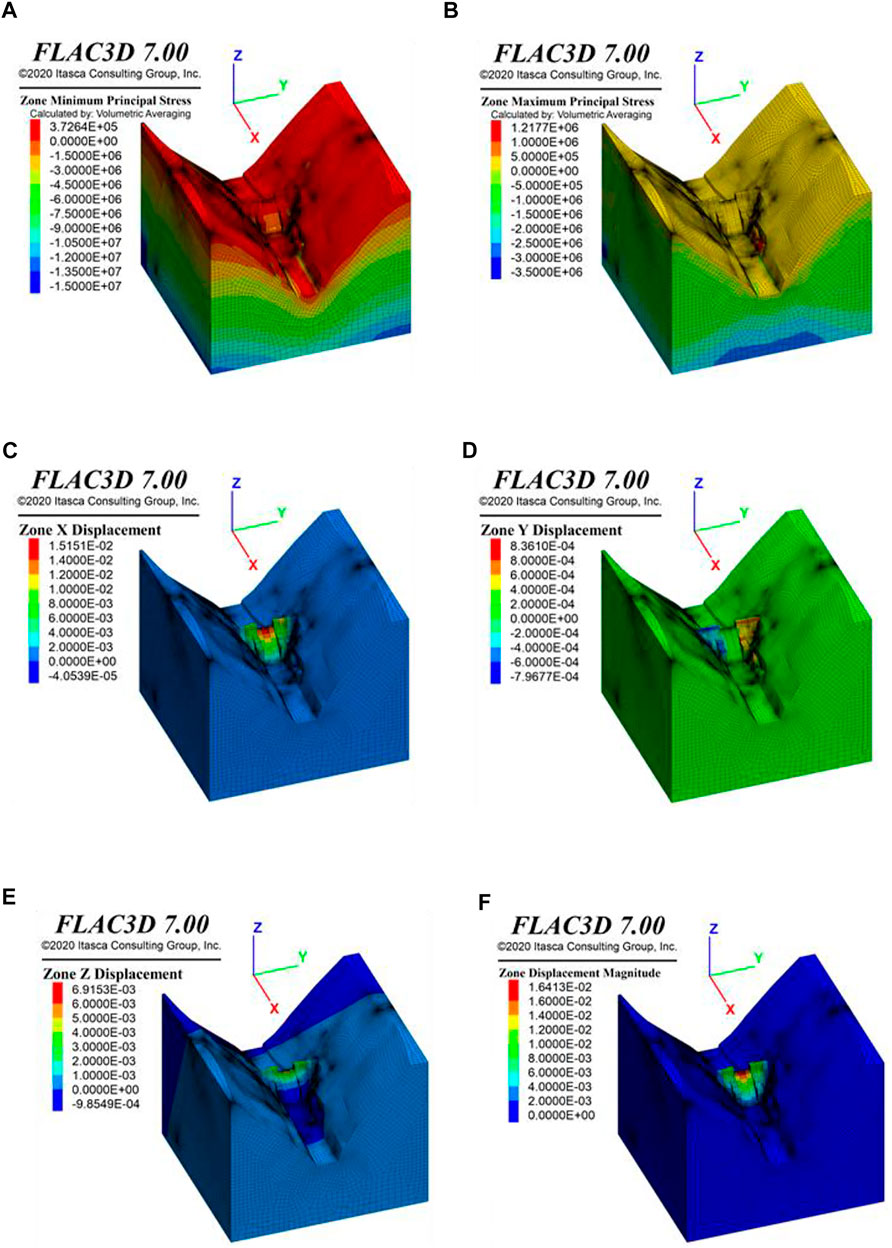
FIGURE 4. The simulation results of the holistic model under the condition of normal water level: (A) Major principal stress. (B) Minor principal stress, (C) Displacement along the river (Xdisp). (D) Displacement across the river (Ydisp). (E) Vertical displacement (Zdisp). (F) Resultant displacement (Rdisp).
Figures 4C–F present the modeling displacement results at the dam site area under the condition of normal water level. Analyzing the three displacement components and the resultant displacement shows that the position with the largest displacement in the dam occurs at the crest of dam section 6 (EL. 1,970 m), and the maximum displacement is 16.41 mm. The largest displacement takes the direction downstream as the priority, with the maximum Xdisp = 15.15 mm.
Modeling Results of the Dam
Figures 5A,B show the simulation results of major principal stress of the dam under the condition of normal water level. It can be seen that the major principal stress of the dam is in compression state dominantly, which ranges from 0 to 3.0 MPa. At the junction between the bottom surface of dam sections 2 and 3, the large stiffness of the contact interface induces compressive stress concentration, with the maximum value of approximately 5.593 MPa (compressive stress). At the abutment of dam section 1 (EL. 1,975–1,995 m), the major principal stress of several elements is in tension, with the maximum value of 0.814 MPa.
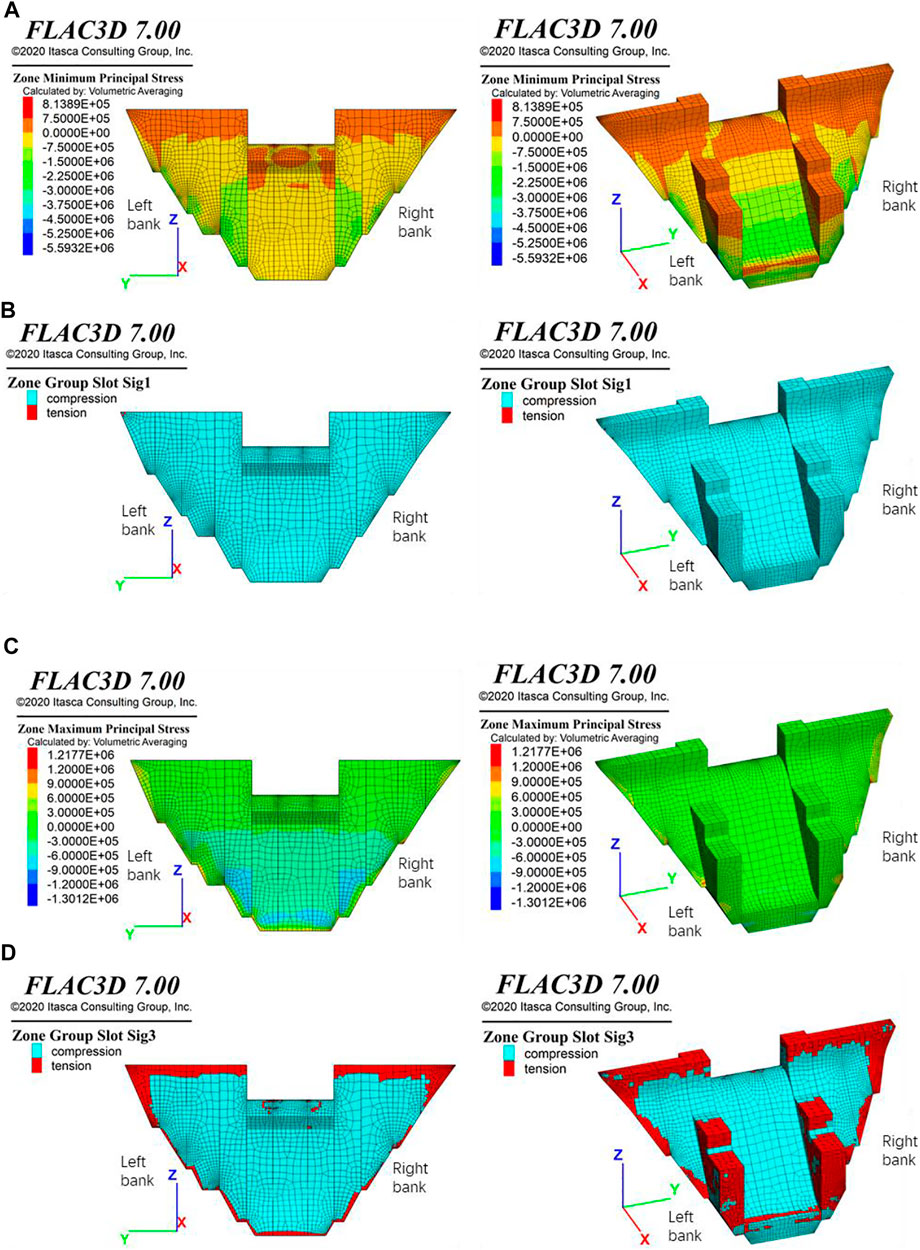
FIGURE 5. (A) Distribution of major principal stress. (B) Tensile zones of the major principal stress. (C) Distribution of minor principal stress. (D) Tensile zones of the minor principal stress (left subfigures: upstream view, right subfigures: downstream view).
Figures 5C,D show the simulation results of minor principal stress of the dam under the condition of normal water level. The minor principal stresses of the dam are in the compression state dominantly, with a value range of 0 to 0.6 MPa. At the bottom surfaces of the dame sections 2–9, the minor principal stresses appear compressive stress concentration, ranging from 0.6 to 0.9 MPa. Their maximum local value reaches 1.301 MPa (compressive stress).
In these positions, tops of dam sections 1–4 and 8–11 (EL. 1,989–1,995 m), dam abutment base surfaces on both banks (EL. 1,872–1,995 m), dam heel (EL. 1,872–1,876 m), and the concrete surface on the downstream side of the dam, the minor principal stresses are in the tensional state, which are in a value range of 0 to 0.3 MPa (tensile stress).
At the base surface of dam abutment 1 (EL. 1,950–1,995 m, left 0 + 095–120 m), the base surface of dam abutment 11 (EL. 1,976–1,995 m, right 0 + 105–118 m), the junction between the dam foundation 3 and 2 (EL. 1905–1910, left 0 + 052–055.6 m, dam 0 + 005–064 m), and the junction between dam foundation 10 and 9 (EL. 1935–1938, right 0 + 073–076 m, dam 0 + 000–041 m), the tensile minor principal stresses are high in values, approximately 0.5–0.75 MPa, and the local maximum value can reach 1.218 MPa (tensile stress).
Figure 6 shows the simulation results of the dam deformation under the condition of normal water level. It can be seen that the maximum displacement of the dam is 16.41 mm, which occurs at the top of the overflow dam section 6 (EL. 1,970 m). A comparative analysis of the three displacement components indicates that the deformation of the dam is dominated by the displacement along the river (Xdisp), with the maximum value of 15.15 mm, pointing to the river downstream. At this position, the maximum Zdisp is approximately 6.92 mm, with the vertical direction upward. According to the distributions of transverse displacement (Ydisp), the dam deformation on the left and right sides of the riverbed center line is symmetrical, with the maximum Ydisp = 8.36 mm, which occurs at the bottom dam section 8 (EL. 1,894–1,917 m) of the right bank.
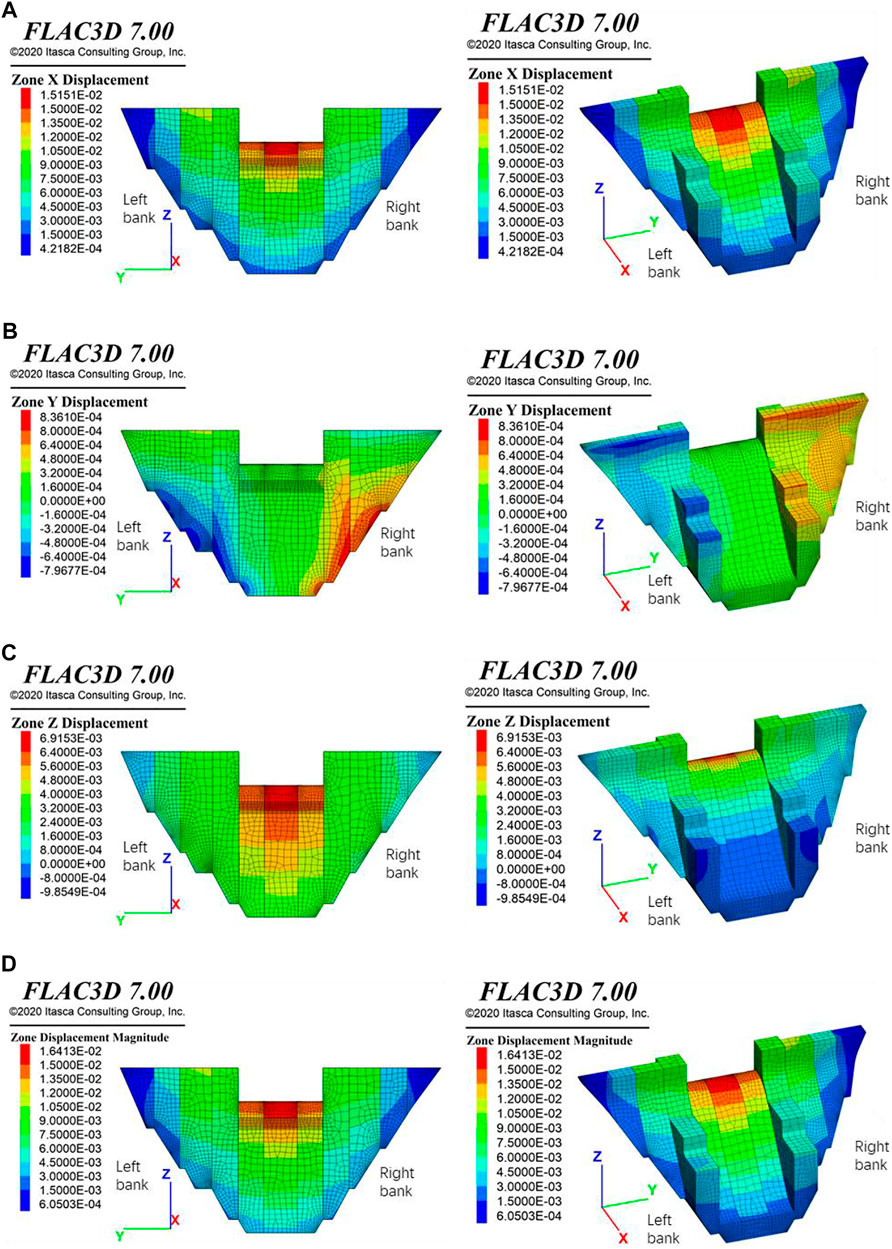
FIGURE 6. Modeling results of displacement (A) Displacement along the river. (B) Transverse displacement across the river. (C) Vertical displacement. (D) Resultant displacement (left subfigures: upstream view, right subfigures: downstream view).
Stability Analysis of Dam Foundation
Evaluation Methods
Overload Method
The overload method is to gradually increase the loads to cause structural instability under the condition that the mechanical parameters of the geomaterials are kept unchanged [13–15]. In its procedure, the mechanical parameters of the geomaterials are kept unchanged. At the same time, the loads applied on the slopes are gradually increased, which would cause slope instability. The stability safety factor is calculated by analyzing the ratio between the load in the critical instability state of slope and the normal working load. When the overall sliding instability failure of the structure occurs, the overload coefficient is the slope’s overall antisliding stability safety coefficient.
At present, the overload method has not formed a unified understanding in solving the safety factor of slope. Some overload objects are the self-weight of geomaterials, and some objects are uniformly distributed loads on the top of the slope. With the increase in overload coefficients, the increase in the external load will lead to deformation. Moreover, the overall safety factor of slope can be obtained with a maximum overload coefficient [16].
In this study, the geomaterials involved in the numerical model of the Kala hydropower station are kept unchanged, and we gradually increase the density of water to increase the water pressure applied on the upstream surface of the dam. Through this procedure, the overload coefficient can be calculated to evaluate the stability of the Kala dam foundation.
Strength Reduction Method
Since the concept of shear strength reduction method was proposed by Zienkiewicz in 1975 [17], the safety coefficient determined from this has gradually been widely accepted by geotechnical engineers and used in slope safety evaluation [18,19]. It is assumed that the mechanical behaviors of geomaterials can be described using the ideal elastic–plastic Mohr–Coulomb’s constitutive model. Under the condition that the external load and boundary conditions remain unchanged, the shear strength of geomaterials is reduced synchronously until the slope is damaged.
A trial strength-reduction factor loop gradually weakens the geomaterials until the numerical simulation fails to converge [20]. Each loop entry implements a gradually increasing strength reduction factor (SRF). The factored strength parameters for the elastoplastic analysis are obtained from the following formulas:
In numerical methods such as FEM and FDM, the failure of the structure is judged by the convergence of the algorithm. A trial-and-error approach can be used to get the minimum value of SRF to cause failure, which is then interpreted as the factor of safety. As for the strength reduction method in the dam foundation, the shear parameters of concrete remain the same, and only that of the rock mass in the dam foundation is reduced.
Typical Profiles for Stability Analysis
There are 11 dam sections in the Kala dam, and the stability analyses are too cumbersome to present all the results in this article. Therefore, only three typical dam sections, namely, 3, 6, and 9, are selected to show the stability analysis results. The profiles cutting through the centerlines of dam sections 3, 6, and 9 are shown in Figure 7.
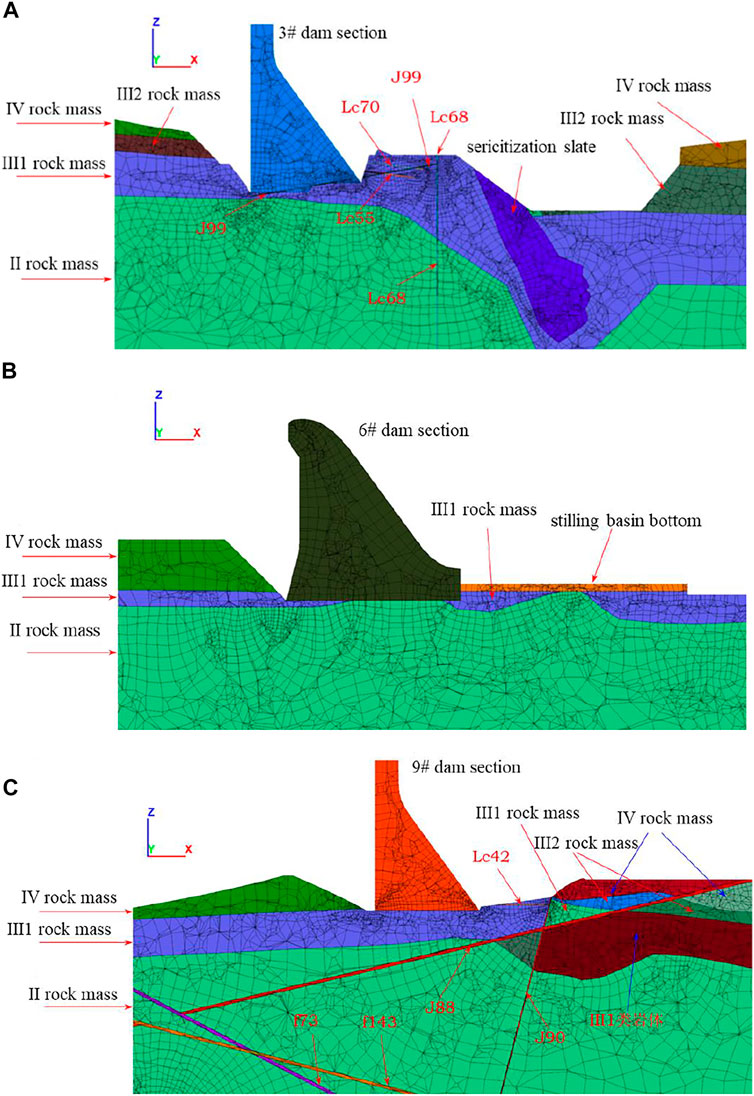
FIGURE 7. The profiles cutting through the centers of the (A) dam section 3, (B) dam section 6, and (C) dam section 9.
Evaluation Results of Stability Analysis Using Overload Method
Overall Stability of Dam Foundation
The overload method is used to evaluate the stability of the dam foundation. The overload coefficient is increased by 0.1 each time, and the overload capacity of the dam foundation is calculated by gradually accumulating. When the plastic zones in the rock mass or structural interfaces under the dam foundation exceed the foundation, this coefficient is assumed to be the stability factor. When the overload coefficient is 6.0, the calculation can still converge, which shows that the safety coefficient of the overall dam foundation is greater than 5.0. The deep and shallow antisliding stability overload coefficient of typical sections of each dam section is shown in Table 2.

TABLE 2. The overload coefficients of the different dam sections.
Dam section 3
The controlling weak structural interfaces in dam section 3 are Lc55, Lc70, Lc68, and J99. Figure 8 shows the plastic zones in the profile cutting through dam section 3, varying with the overload coefficient increasing from 2.0 to 5.0. It can be seen that when the overload coefficient is 2.0, a small plastic zone appears in Lc55 in the downstream side of dam section 3. With the increase in overload coefficient, the plastic zones of Lc55 and J99 gradually penetrate.
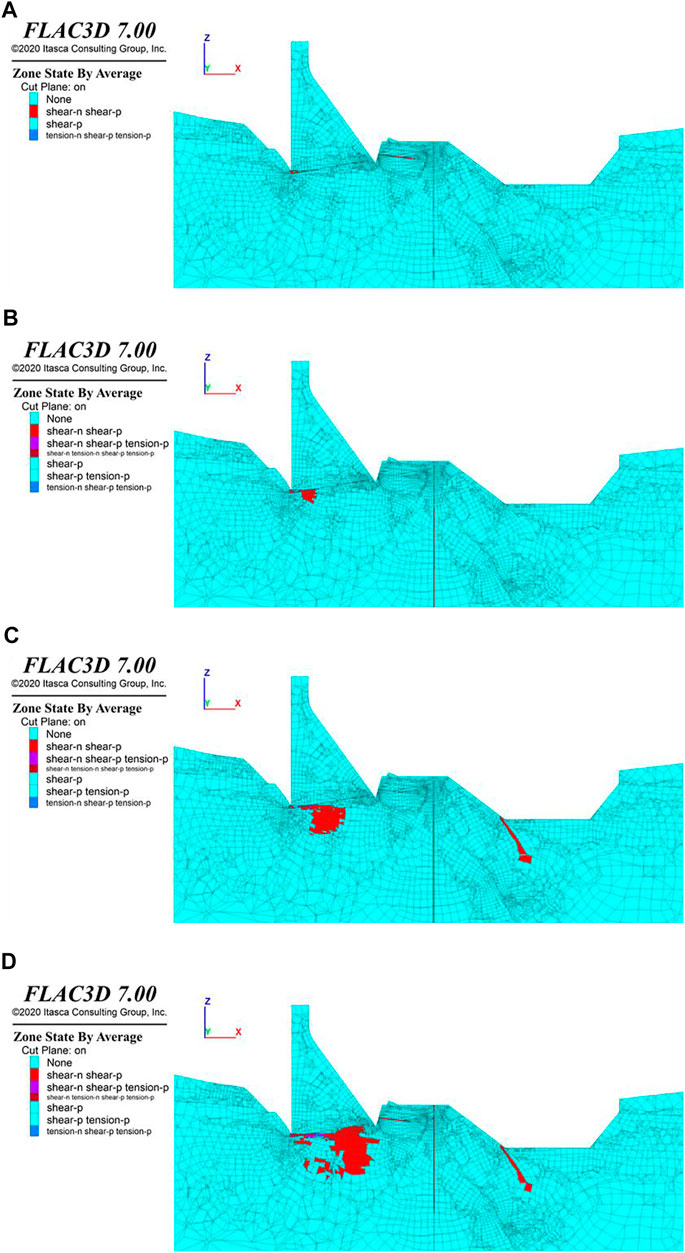
FIGURE 8. Plastic zones in the profile cutting through the center of dam section 3 under the conditions of (A) overload coefficient 2.0, (B) overload coefficient 3.0, (C) overload coefficient 4.0, and (D) overload coefficient 5.0.
When the overload coefficient reaches 3.0, a plastic zone appears in Lc70 and gradually penetrates. At the same time, the plastic zone in fault J99 under the foundation of dam section 3 gradually expands to the deep position. When the overload coefficient is 5.0, the plastic zones increase to an extensive range (EL. 1,897–1,928 m), but it is still not completely connected. A large plastic zone is also observed inside the vertical fault Lc68.
Dam section 6
Figure 9 shows the plastic zones in the foundation of dam section 6, varying with the overload coefficient increasing from 2.0 to 5.0. When the overload coefficient is 2.0, only a small area at the dam heel is in the plastic state. With the increase in overload coefficient, the plastic zone at the dam heel develops downstream. When the overload coefficient reaches 5.0, the plastic zone becomes larger but not cut through the foundation.
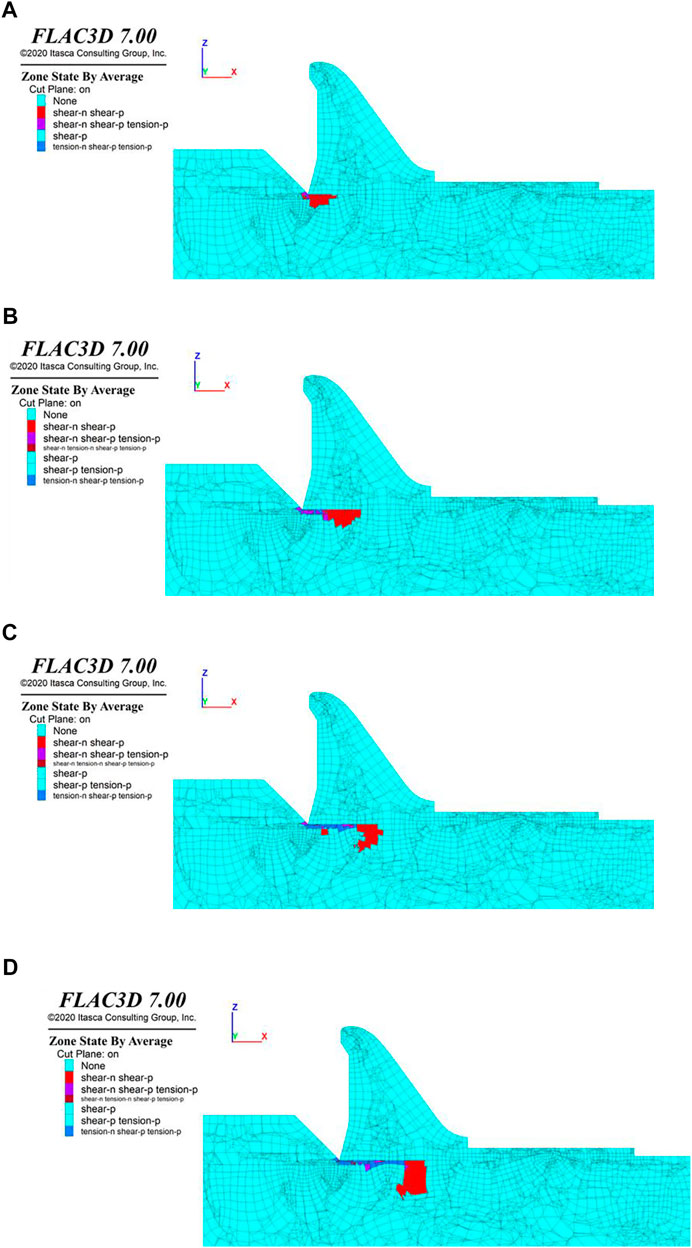
FIGURE 9. Plastic zones in the profile cutting through the center of dam section 6 under the conditions of (A) overload coefficient 2.0, (B) overload coefficient 3.0, (C) overload coefficient 4.0, and (D) overload coefficient 5.0.
Dam section 9
The evolution of the plastic zone under dam section 9 with an overload coefficient from 2.0 to 5.0 is shown in Figure 10. The controlling weak faults under dam section 9 are Lc42, J90, J88, f73, and f143. When the coefficient is 2.0, the plastic zone appears in J88. With the increase in overload coefficient, the plastic zone in the deep rock foundation gradually cuts through the whole area, when it is 3.2.
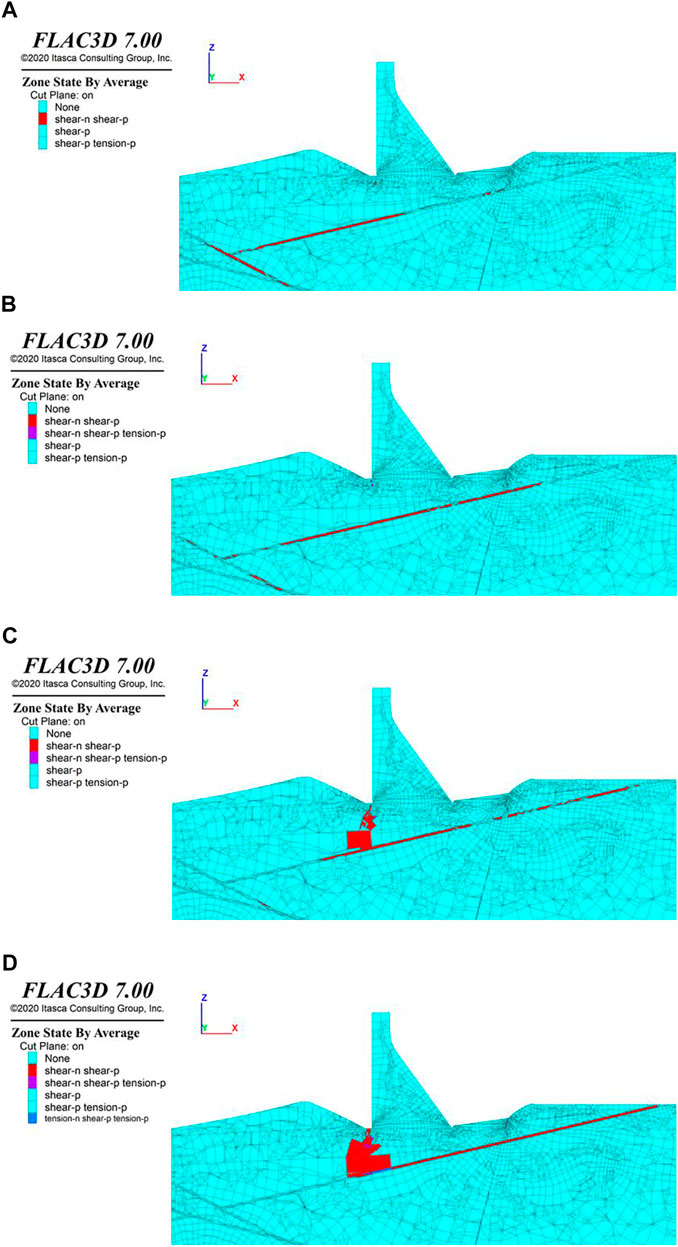
FIGURE 10. Plastic zones in the profile cutting through the center of dam section 9 under the conditions of (A) overload coefficient 2.0, (B) overload coefficient 2.5, (C) overload coefficient 3.0, and (D) overload coefficient 3.2.
Evaluation Results of Stability Analysis Using Strength Reduction Method
Overall Stability of Dam Foundation
When the strength reduction method is used to analyze the stability of the dam foundation, only the strength parameters of the rock masses and the structural interfaces are reduced. This article uses SRFs of 1.5, 2.0, 2.2, 2.5, 3.0, and 3.5. The results show that the calculation cannot converge when the reduction factor is 3.5. Hence, the overall safety factor is in a range of 3.0 to 3.5.
Dam section 3
The plastic zone with different SRF at dam section 3 is shown in Figure 11. It can be seen from the figures that when the strength reduction coefficient is 2.0, a cutting-through plastic zone appears in Lc70 and Lc55 downstream of the dam. However, the plastic zone does not affect the dam foundation. A penetrating plastic zone appears. When the strength reduction coefficient is 2.2, plastic zones appear in the dam heel and in the dam’s rock masses. When the strength reduction coefficient is 2.5, the plastic zone in the heel and the upstream rock masses continue to develop but not cut through the whole foundation. It shows that the safety factor of dam section 3 is greater than 2.5.
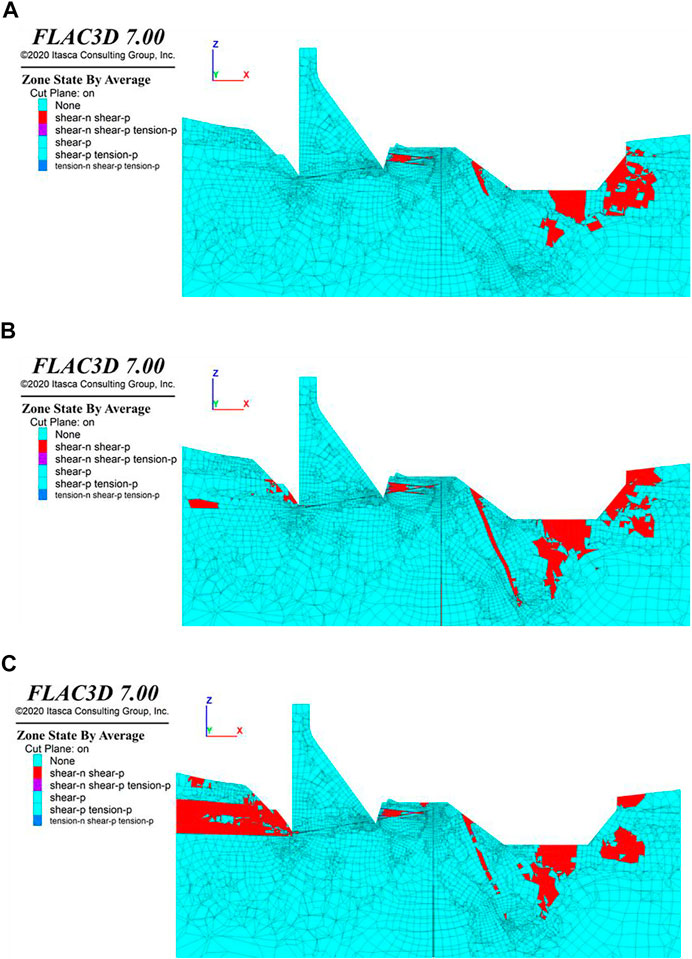
FIGURE 11. Plastic zones in the profile cutting through the center of dam section 3 under the conditions of (A) SRF = 2.0, (B) SRF = 2.2, and (C) SRF = 2.5.
Dam section 6
The plastic zone with different SRF at dam section 6 is shown in Figure 12. When the SRF varies from 1.0 to 2.5, only a small plastic zone appears. This indicates that the safety factor is larger than 2.5.
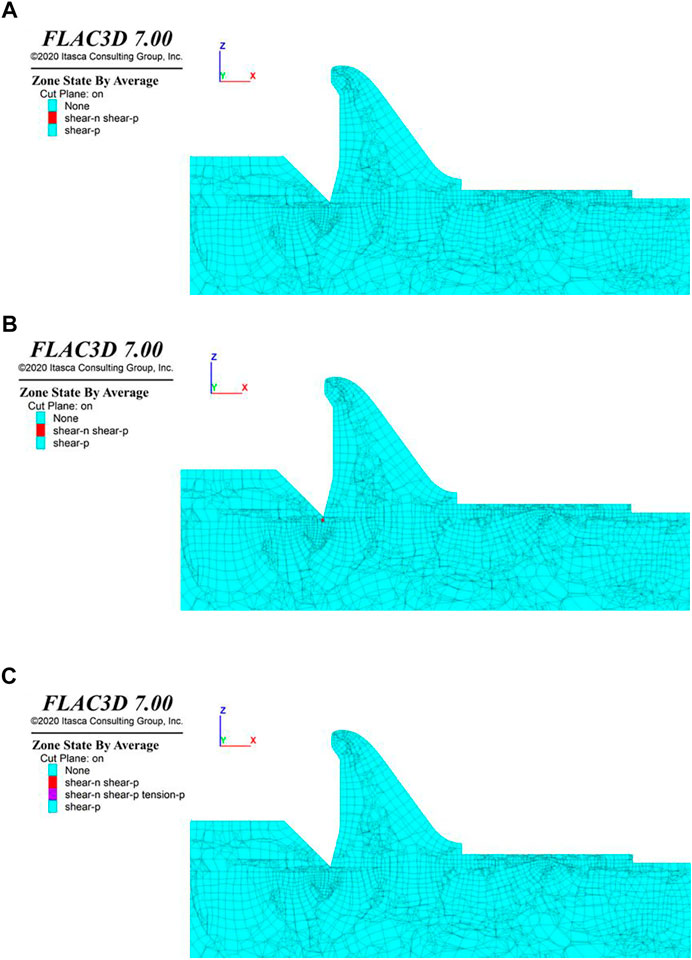
FIGURE 12. Plastic zones in the profile cutting through the center of dam section 6 under the conditions of (A) SRF = 2.0, (B) SRF = 2.2, and (C) SRF = 2.5.
Dam section 9
For dam section 9, the plastic zone with different SRF is given in Figure 13. It shows that the safety factor of dam section 9 is greater than 2.5. When the strength reduction factor is 2.0 to 2.5, only incompletely penetrated plastic zones appear in J88 and f73. There is no penetrating plastic zone in the dam foundation.
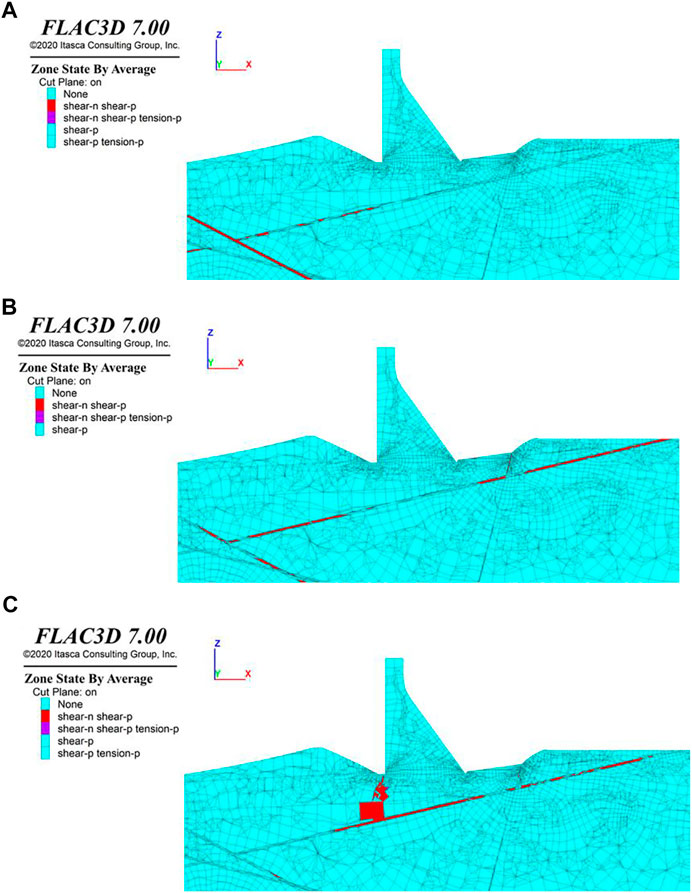
FIGURE 13. Plastic zones in the profile cutting through the center of dam section 9 under the conditions of (A) SRF = 2.0, (B) SRF = 2.2, and (C) SRF = 2.5.
Conclusions
In the engineering project of the Kala hydropower station, an RCC gravity dam will be built on the rock foundation with complex geological conditions. The weak structural interfaces, such as faults, compression zones, and joint fissures, harm the deep stability of the dam foundation. To evaluate the stability of the Kala dam foundation, a 3D finite-difference numerical model was built based on the geological conditions. By carrying out the numerical simulations, the deep stability analysis of the dam foundation was evaluated using both the overload and strength reduction methods. The following conclusions can be summarized:
(1) Under the condition of normal water level, the whole model is in the compressive stress states dominantly. The maximum tensile major and minor principal stresses are 0.373 and 1.218 MPa, respectively. They mainly distribute in the bank slopes.
(2) Under the condition of normal water level, the maximum displacement of the dam is 16.41 mm, which occurs at the top of the overflow dam section 6 (EL. 1,970 m). The displacement component (Xdisp) along the river toward the downstream is the priority, with a maximum value of 15.15 mm.
(3) The results of the overload method indicate that the overall safety factor is larger than 6.0, and the minimum safety factor of different dam sections is 3.5. The overall overload coefficient of the Kara dam foundation is 5.0.
(4) Through the analysis of the plastic zone of multiple dam sections, it is comprehensively determined that the strength safety factor of the dam foundation is greater than 2.5, satisfying the bearing capacity requirements.
(5) The weak structural interfaces (Lc55, Lc70, f146, f130, J99, Lc68, J90, J88, Lc42, f73, f143) are close to the dam foundation, which have a significant influence on the distribution and development of the plastic zones in the dam foundation. In particular, the low-inclination structural interfaces Lc55, Lc70, and f146 on the left bank exhibit remarkable plastic zones. Necessary reinforcement should be carried out for these weak structural interfaces.
Data Availability Statement
The original contributions presented in the study are included in the article/Supplementary Material, further inquiries can be directed to the corresponding authors.
Author Contributions
Conception and design of this study was mainly contributed by JZ. Numerical simulations was mainly contributed by WL and WW. Drafting the manuscript was mainly contributed by WL and JZ.
Funding
This research was financially supported by National Natural Science Foundation of China (Grant No. 12062026).
Conflict of Interest
Authors WL and WW were employed by the company PowerChina Huadong Engineering Corporation Limited, China.
The remaining authors declare that the research was conducted in the absence of any commercial or financial relationships that could be construed as a potential conflict of interest.
Publisher’s Note
All claims expressed in this article are solely those of the authors and do not necessarily represent those of their affiliated organizations, or those of the publisher, the editors and the reviewers. Any product that may be evaluated in this article, or claim that may be made by its manufacturer, is not guaranteed or endorsed by the publisher.
References
1. Duffaut P. The Traps Behind the Failure of Malpasset Arch Dam, France, in 1959. J Rock Mech Geotechnical Eng (2013) 5:335–41. doi:10.1016/j.jrmge.2013.07.004
2. Zhao F, Fan S. Deep Anti-sliding Stability Analysis of the Overflow Section in Mamaya Hydroelectric Power Station. J Water Resour Architectural Eng (2020) 18:204–208. [in Chinese]. doi:10.3969/j.issn.1672-1144.2020.05.036
3. Liu J, Feng X-T, Ding X-L, Zhang J, Yue D-M. Stability Assessment of the Three-Gorges Dam Foundation, China, Using Physical and Numerical Modeling-Part I: Physical Model Tests. Int J Rock Mech Mining Sci (2003) 40:609–31. doi:10.1016/s1365-1609(03)00055-8
4. Tao Z, Liu Y, Yang Q, Wang S. Study on the Nonlinear Deformation and Failure Mechanism of a High Arch Dam and Foundation Based on Geomechanical Model Test. Eng Structures (2020) 207:110287. doi:10.1016/j.engstruct.2020.110287
5. Wang X, Liu Y, Tao Z, Wang W, Yang Q. Study on the Failure Process and Nonlinear Safety of High Arch Dam and Foundation Based on Geomechanical Model Test. Eng Fail Anal (2020) 116:104704. doi:10.1016/j.engfailanal.2020.104704
6. Faramarzi L, Zare M, Azhari A, Tabaei M. Assessment of Rock Slope Stability at Cham-Shir Dam Power Plant Pit Using the Limit Equilibrium Method and Numerical Modeling. Bull Eng Geol Environ (2017) 76:783–94. doi:10.1007/s10064-016-0870-x
7. Peng W. Discussion on Calculation Method of Multi-Slip Surface Anti-sliding Stability with Resistance Resultant Force on Both Sides of Slider as Variable. Chin J Rock Mech Eng (2019) 38:204–208. [in Chinese]. doi:10.13722/j.cnki.jrme.2019.0287
8. Bretas EM, Léger P, Lemos JV. 3D Stability Analysis of Gravity Dams on Sloped Rock Foundations Using the Limit Equilibrium Method. Comput Geotechnics (2012) 44:147–56. doi:10.1016/j.compgeo.2012.04.006
9. Armaghani DJ, Bayat V, Koopialipoor M, Pham BT. Investigating the Effect of Jointed Environment on the Cracked Concrete Arch Dam in 3D Conditions Using FEM. Bull Eng Geol Environ (2021) 80:55–70. doi:10.1007/s10064-020-01935-3
10. Xu N, Tian H, Kulatilake PHSW, Duan Q. Building a Three Dimensional Sealed Geological Model to Use in Numerical Stress Analysis Software: A Case Study for a Dam Site. Comput Geotechnics (2011) 38:1022–30. doi:10.1016/j.compgeo.2011.07.013
11. Wu F, Qi S, Lan H. Mechanism of Uplift Deformation of the Dam Foundation of Jiangya Water Power Station, Hunan Province, P.R. China. Hydrogeology J (2005) 13:451–66. [in Chinese]. doi:10.1007/s10040-004-0374-9
12. Energy MO, Resources MOW. Specifications for Load Design of Hydraulic Structures. Beijing: Electricity & Power Industry Standard (1998). (in Chinese).
13. Xue H, Dang F, Yin X, Ding W. Unified Overload Method of Slope Stability Analysis Based on Potential Sliding Direction. Ksce J Civ Eng (2018) 22:3254–62. doi:10.1007/s12205-017-1385-0
14. Zhao T, Sun J, Zhang B, Li C. Analysis of Slope Stability with Dynamic Overloading from Earthquake. J Earth Sci (2012) 23:285–96. doi:10.1007/s12583-012-0257-2
15. Zheng H, Tham LG, Liu D. On Two Definitions of the Factor of Safety Commonly Used in the Finite Element Slope Stability Analysis. Comput Geotechnics (2006) 33:188–95. doi:10.1016/j.compgeo.2006.03.007
16. Wu J, Cao A, Liu J, Chu W, Meng G. Method for Calculation Overall Safety of Factor of Underground Cavern Complex and its Application. Chin J Underground Space Eng (2021) 17:433–438. [(in Chinese)].
17. Zienkiewicz OC, Taylor RL, Zhu JZ. The Finite Element Method: Its Basis and Fundamentals: Its Basis and Fundamentals. Oxford: Elsevier Science (2013).
18. Griffiths DV, Lane PA. Slope Stability Analysis by Finite Elements. Géotechnique (1999) 49:387–403. doi:10.1680/geot.1999.49.3.387
19. Meng Q-X, Wang HL, Xu WY, Cai M, Xu J, Zhang Q. Multiscale Strength Reduction Method for Heterogeneous Slope Using Hierarchical FEM/DEM Modeling. Comput Geotech (2019) 115:103164. doi:10.1016/j.compgeo.2019.103164
Keywords: stability analysis, dam foundation, complex geological condition, overload method, strength reduction method
Citation: Li W, Wu W and Zhang J (2022) Numerical Stability Analysis of the Dam Foundation Under Complex Geological Conditions at Great Depth: A Case Study of Kala Hydropower Station, China. Front. Phys. 9:808840. doi: 10.3389/fphy.2021.808840
Received: 04 November 2021; Accepted: 31 December 2021;
Published: 17 February 2022.
Edited by:
Qingxiang Meng, Hohai University, ChinaCopyright © 2022 Li, Wu and Zhang. This is an open-access article distributed under the terms of the Creative Commons Attribution License (CC BY). The use, distribution or reproduction in other forums is permitted, provided the original author(s) and the copyright owner(s) are credited and that the original publication in this journal is cited, in accordance with accepted academic practice. No use, distribution or reproduction is permitted which does not comply with these terms.
*Correspondence: Jiuchang Zhang, emhhbmdqaXVjaGFuZ0Bmb3htYWlsLmNvbQ==