 Ana De Freitas1,2*
 Joice Ferreira3
 Maria Escada2
 João Reis1Cândida Leite2Dárlison Andrade4Jackeline Spínola5Maria Soares4
 Liana Anderson1
- 1National Centre for Monitoring and Early Warning of Natural Disasters—Cemaden, São José dos Campos, São Paulo, Brazil
- 2National Institute for Space Research—INPE, São José dos Campos, São Paulo, Brazil
- 3Brazilian Agricultural Research Corporation—EMBRAPA, Belém, Pará, Brazil
- 4Chico Mendes Institute for Biodiversity Conservation—ICMBio, Brasília, Distrito Federal, Brazil
- 5Chico Mendes Institute for Biodiversity Conservation—ICMBio, Santarém, Pará, Brazil
Protected Areas (PA) in Brazil have legal instruments for the conservation and protection of fauna and flora. The Sustainable Use Reserves (SURs) category have mechanisms to ensure the security of traditional lifestyles. Despite the existence of mechanisms and information that contribute to the protection of forest areas, threats to its conservation such as deforestation, fires, and climate extremes are increasing. Fires represent a major threat to many sustainable development goals, such as climate, health and food security, especially for people who depend on forest resources. This study covers two SURs, the Tapajós National Forest (FLONA Tapajós) and the Tapajós-Arapiuns Extractive Reserve (RESEX Tapajós-Arapiuns) located in Pará State, Brazilian Amazon, where deforestation, fires and land conflicts have escalated during the last decade. This research aimed to analyze environmental and land management data to construct a Fire Exposure Index (FEI), identify the pressure exerted on SURs and a tool to guide strategic planning since exposure is a component of vulnerability, therefore also of risk. The index is composed of four dimensions: fire, landscape, climate and territorial management. We analyzed the spatio-temporal dynamics between 2003 and 2020 to determine the Fire Exposure Index in 2020. The results indicate where and how interactions occur in priority areas, with regard to fire, landscape, climate and territorial management. High values of FEI (above 0.8) were mainly distributed around the northern and southeastern part of FLONA Tapajós in approximately 1,300 km2, an area occupied by a high density of roads and agricultural expansion, which may affect the interior of the SURs. In the RESEX Tapajós-Arapiuns, the area with high FEI occur along the banks of the Arapiuns and Tapajós rivers, covering an area of about 330 km2, where most of the riverside communities live. The methodology developed in this research is potentially replicable for other protected areas in Brazil and in the world to support understanding and the development of management strategies to deal with fire threats. The additional format of communicating the results of this research to society and decision makers was conceived as a dashboard to facilitate its use.
1 Introduction
Sustainable Use Reserves (SURs) correspond to the majority (73%) of protected areas in the Amazon, contributing to the maintenance of essential environmental services, including climate regulation [1, 2]. Agricultural activities traditionally carried out by populations in these areas rarely lead to fire escapes in normal climatic contexts, however, they have become riskier with climate change and the local environment [3, 4]. It is pertinent to understand the dangers that these areas are exposed to and contribute to the conservation of these SURs for the planning of more effective and appropriate interventions for their management [5, 6].
Environmental processes, such as changes in the drought regime, make vegetation more vulnerable to burning, with the potential to intensify fire escapes that cause forest fires [7, 8]. This change in the pattern of occurrence of these events can make traditional methods of preventing fire escape less efficient [4]. Among the factors that influence the increase in the occurrence of fires in the Amazon are: deforestation, inadequate land management, increase in forest edges [9, 10], proximity to main roads and density of pathways [11, 12].
The analyses of the effects of forest fires, although widely discussed, are constantly being improved, with results that vary according to the space-time scale of the study. However, the consequences of fires in tropical forests on social aspects have been little explored by the literature, which has a large part of the analyzes associated with physical-natural characteristics, although human action is the main responsible for the ignitions [13–15]. Thus, it is understood that it is essential to identify the spatio-temporal characteristics of the elements exposed in the SURs (ex.: forest, productive and housing areas), as well as the pressures to which they are subjected: the intensification of droughts, the occurrence of fires and the dynamics of its surroundings for the characterization of threats.
The [16] identified that forest fires occurrence are a threat that disproportionately affect the poorest communities and delay the achievement of the United Nations Sustainable Development Goals (SDGs) [16]. Dozens of SDGs are compromised by the occurrence of forest fires, including reduced agricultural potential, loss of livelihoods and increased poverty [16].
Among the procedures indicated for decision makers is the understanding of asset exposure levels (properties and infrastructure) and access to information on fire risks. As a result, communities and local authorities will be better prepare for, respond to and recover from wildfires [16]. It is understood that it is essential to identify the spatio-temporal characteristics of the elements exposed in SURs, such as forests, productive and housing areas, as well as the pressures to which they are subjected, such as the intensification of droughts, occurrence of fires and the dynamics of their environments for the characterization of threats. In this study, the threat is represented by fire, which can result in wildfires after its escape during agricultural management.
The Tapajós National Forest (FLONA Tapajós) and the Tapajós-Arapiuns Extractive Reserve (RESEX Tapajós-Arapiuns), located in Eastern Amazonia, have faced several challenges related to fire management, with almost 10 thousand km2 of burned area of primary forest and 200 km2 of secondary forest only during the 2015/16 El Niño [3]. Therefore, this research aims to use analysis of environmental data and territorial management to build the Fire Exposure Index (FEI) at FLONA Tapajós and RESEX Tapajós-Arapiuns. In addition, it makes this information available on a dashboard to facilitate access to information for decision makers, local communities and society, here called users. The products resulting from this research have the potential to support prevention and monitoring strategies in order to mitigate the negative impacts associated with wildfires.
2 Background: Concept socio-environmental exposure to fires
In this research, we were based on the exposure approach determined by the fifth IPCC report [17]. In the report, vulnerability, as a risk component, is defined as a function of the exposure, sensitivity and adaptive capacity of the system to threats. The approach relates exposure to a particular event or process, according to the type and intensity of threats to which the system is exposed.
The Sendai Protocol (United Nations Office for Disaster Risk Reduction—[18]) presents seven targets for small and large-scale disaster risk reduction by 2030. Understanding risk and strengthening governance to manage disaster risk is one of the priorities for action, according to this protocol [18]. Exposure assessment is the first step to systematize and quantify the hazards in which a population is inserted. This, in the context of fires, is determined by the spatio-temporal behavior of the interaction between fires, changes in land use and cover, and climate pattern ([7]; [19] [20]).
The organization and management of territories can also be considered elements of the exposure, as they determine the areas, activities and procedures that can be used in the territory. When populations occupy areas where exposure to fire is impossible to avoid, land use planning and decisions may be accompanied by other sources of local data and information to prevent or mitigate risks [21]. Once the processes and locations most exposed to the threat are known, managers and the population can be better prepared to manage and prevent it.
Among the challenges identified by the [22], the need for data and methods to increase knowledge of vulnerability stands out. Despite efforts to define the behavior of fires and their impacts, in Brazil there are no methodologies to define a synthetic index as a subsidy to determine the exposure of fires and the elements that contribute to its occurrence. An index with this information is of great importance, since the dynamics of exposure to the threat of fire can change over days, weeks, months and seasonally.
3 Material and methods
3.1 Study area
This research covers two Sustainable Use Reserves (SURs): i) the RESEX Tapajós-Arapiuns, Decree s/n°, of 6 November 1998 [23]; and ii) FLONA Tapajós, Decree No. 73,684, of 19 February 1974 [24]. Both are located in the west of the State of Pará, with administrative headquarters in the city of Santarém (Figure 1).
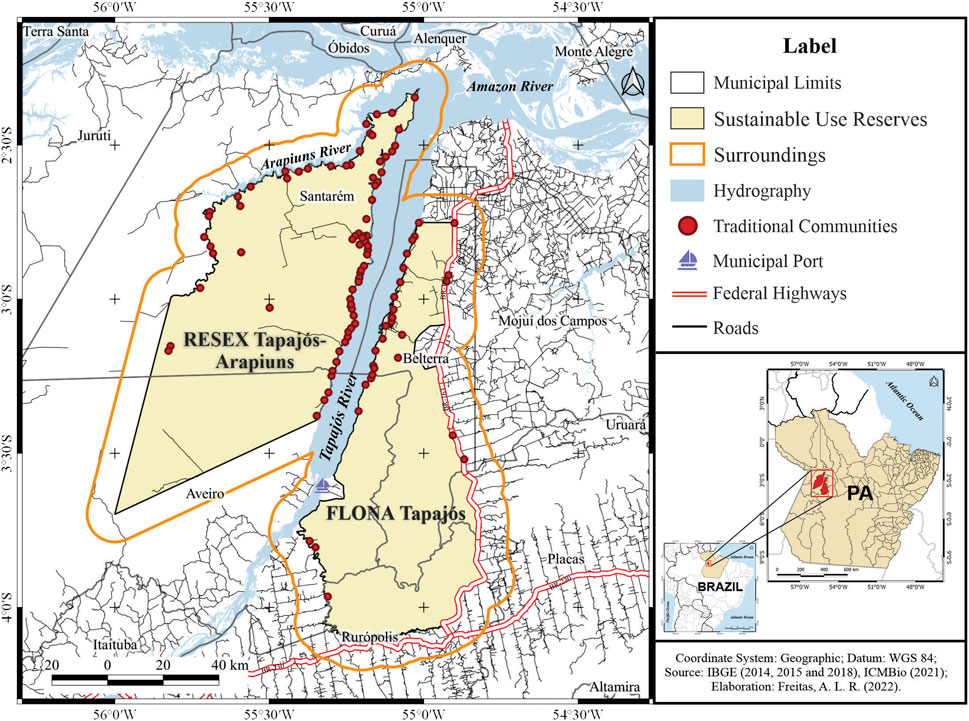
FIGURE 1. Location of FLONA Tapajós and RESEX Tapajós-Arapiuns.
RESEXs are intended for traditional extractive populations to protect their ways of life, to ensure the sustainable use of natural resources, where subsistence agricultural activities are also developed [25]. The FLONAs have as their basic objective the sustainable multiple use of forest resources and scientific research, in areas with predominantly native forest cover [25]. Although the category is not intended for populations, the FLONA Tapajós is home to traditional population that was already living in the area before 1974, the year of its creation.
The territorial organization of the SURs is presented in the table (Table 1). The population of the RESEX Tapajós-Arapiuns is larger and has higher density, despite having a larger area, in relation to the FLONA Tapajós. In FLONA there are three villages of indigenous communities, while in RESEX there are members of communities that identify themselves as indigenous, representing about seven ethnic groups. Both SURs have infrastructure and activities in common encompassing the use of the forest products for subsistence and local scale markets. In addition to the articulation that was built between FLONA Tapajós and RESEX Tapajós-Arapiuns to address issues of strengthening territorial management, in both SURs, actions are developed for the integrated management of associates and cooperative members. This demonstrates the commitment of traditional and local populations to make activities compatible with sustainability objectives.
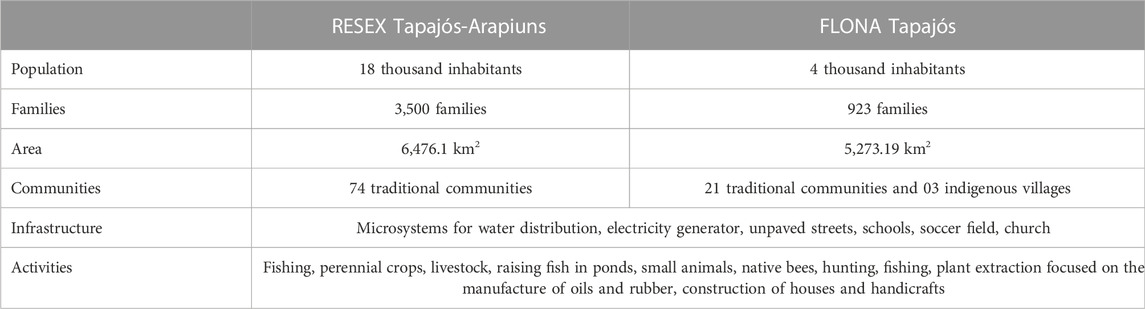
TABLE 1. Characterization of SURs; Levantamento em campo dos autores (2022).
3.2 Data base
To generate the indicators for calculating the Fire Exposure Index (FEI), data derived from remote sensing and socio-environmental databases were used (Table 2). With this dataset, it was possible to determine fire behavior, land use and land cover patterns, precipitation and temperature in the SURs (Table 2). It is considered that the roads are a constituent part of the landscape, in this way, they were aggregated in the infrastructure variable. The land use and land cover product underwent a reclassification in order to define the four classes that best suit the objectives of this research (Table 3).
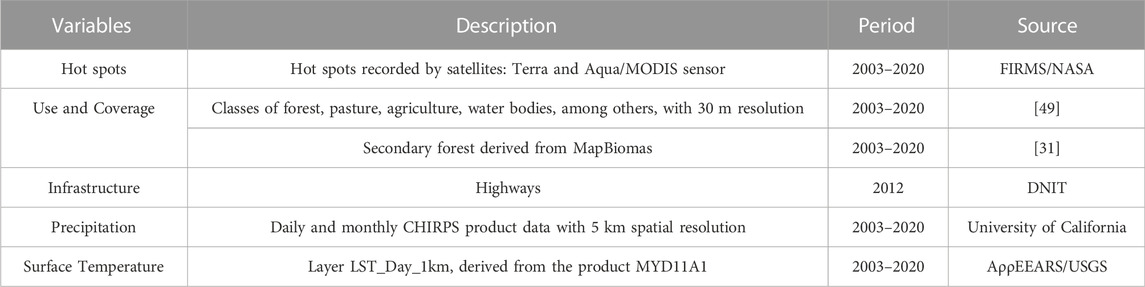
TABLE 2. Remote sensing data used to access indicators.
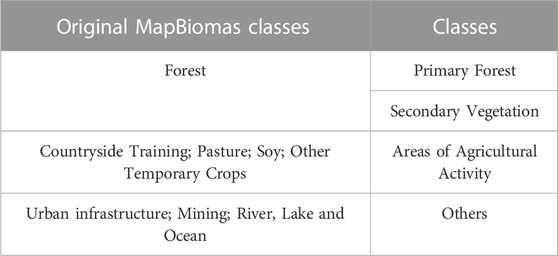
TABLE 3. Adequacy of the Mapbiomas legend.
Data of a socio-environmental nature were acquired through the managing body of the protected areas, which defines the zoning of the SURs: it includes the areas assigned to management, recovery, preservation, housing, among others [23, 24] (Figure 2). This information contributes to the understanding of the management plan of the SURs, as well as the distribution of the typologies of activities in the territory.
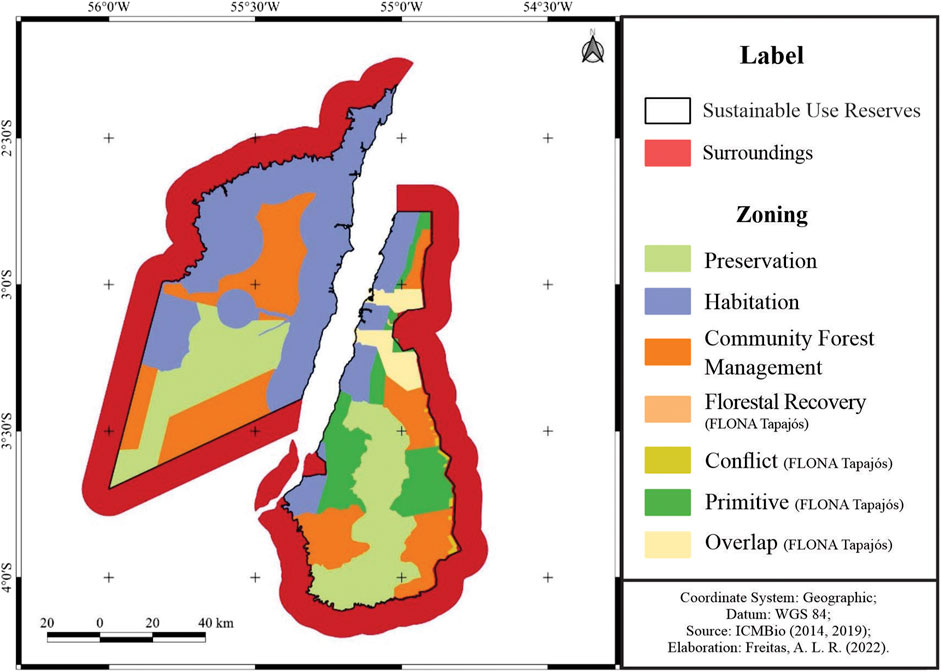
FIGURE 2. Zoning of SURs and surrounding areas; The 10 km limit around the SURs was defined based on CONAMA Resolution No. 13/90, due to the potential of activities in these areas to affect the unit.
The evaluation of the social characteristics of the SURs is relevant because these areas translate spatially the activities already developed and what can or cannot be done in the two SURs. Therefore, based on the descriptions of each zone, the weights described in item 3.3.1 were defined.
The precipitation data was acquired from the Climate Hazards Center InfraRed Precipitation with Station (CHIRPS), which incorporates remote sensing products with in-situ station data starting in 1981 in 0.05° of spatial resolution [26]. We used the CHIRPS spatial resolution to create the grid, which represents the lowest spatial resolution data used in the research, for integrate our analyzes. All cells directly in contact with the SURs areas were evaluated. In this way, all grid points presented at least one value of each variable to characterize it.
In this research, we also excluded the cells located completely in water bodies and kept those that intersect with the land, since the riverside area concentrates a large number of communities and the majority of the population. The surrounding area defined in this research is composed by a buffer of 10 km and all cells that intersected the buffer boundary. According to the CONAMA [27], which is the Brazilian collegiate responsible for adopting measures of a consultative and deliberative nature regarding the National Environmental System, any type of activity carried out in the Protected Areas surrounding area may affect the biota, and must be licensed by the competent environmental agency.
Some limitations have been identified in the dataset used in this research. For example, many studies have filtered the Terra and Aqua MODIS sensor hot spots based on their confidence values (from 0% to 100%). According [28] the user can use the three fire pixel classes determined by this interval (low-confidence fire, nominal-confidence fire, or high-confidence fire) if it is needed a maximum fire detection and can tolerate false alarms. In this study we opt to use all confidence levels, to ensure that all potential fire ignitions were taken into account (Supplementary Figure S1).
The second source of uncertainty relies on the land use and land cover data. Land management in the region is usually based on shift cultivation and fallow practices which enables the growth of secondary forests. These areas, after few years are cleared for production and fire is used during this process [29, 30]. Since the Mapbiomas dataset only presents one category of land cover to designate forests, we have updated the dataset by distinguishing the secondary forests and its age, by combining it with the product developed by [31]. This dataset identify when the Mapbiomas classify a pixel that was in another class in the previous year as a forest, and reclassify it as a secondary forest. This procedure was applied in this research to identify the old growth forest, where its integrity can be assessed.
Regarding the infrastructure data used, roads and highways, its limitations due to the divergences between the planned and executed roads are well documented in the literature. In addition, un-official opening of new roads, many times unplanned or illegally, is a common practice. The mapping of these small roads has been a challenge for many years [32] and recently a new dataset has been released [33]. However, we opt to use the official dataset, since the opening of new unplanned roads inside the protected areas has been minimal due to the governance existent there.
The main limitation in surface temperature data is related to the presence of clouds, which influences the detection of low values, even negative values or lack of information. [34] identify that at nighttime, failures can reach 97.9% and can be minimized if a 16-day composition is performed. Thus, in this research we used the daytime and obtained the monthly average to minimize these limitations without producing new information through interpolation.
3.3 Building the fire exposure index (FEI)
Exposure is defined in this work by the time that the socio-environmental elements were under the effect of the occurrence of fire and its conditioning factor (climate, land use and landscape) associated with territorial management (zoning). The behavior of these variables was evaluated monthly between 2003 and 2020 to determine the exposure of SUR territories to fire. The proposed index to determine exposure is composed of four dimensions: fire, landscape, climate and territorial management. Table 4 lists and describes the data used to obtain the indicators. In areas where management is permitted and which have been subject to the conditioning factors recurrence which contribute to the exposure to fire, its value will be higher.
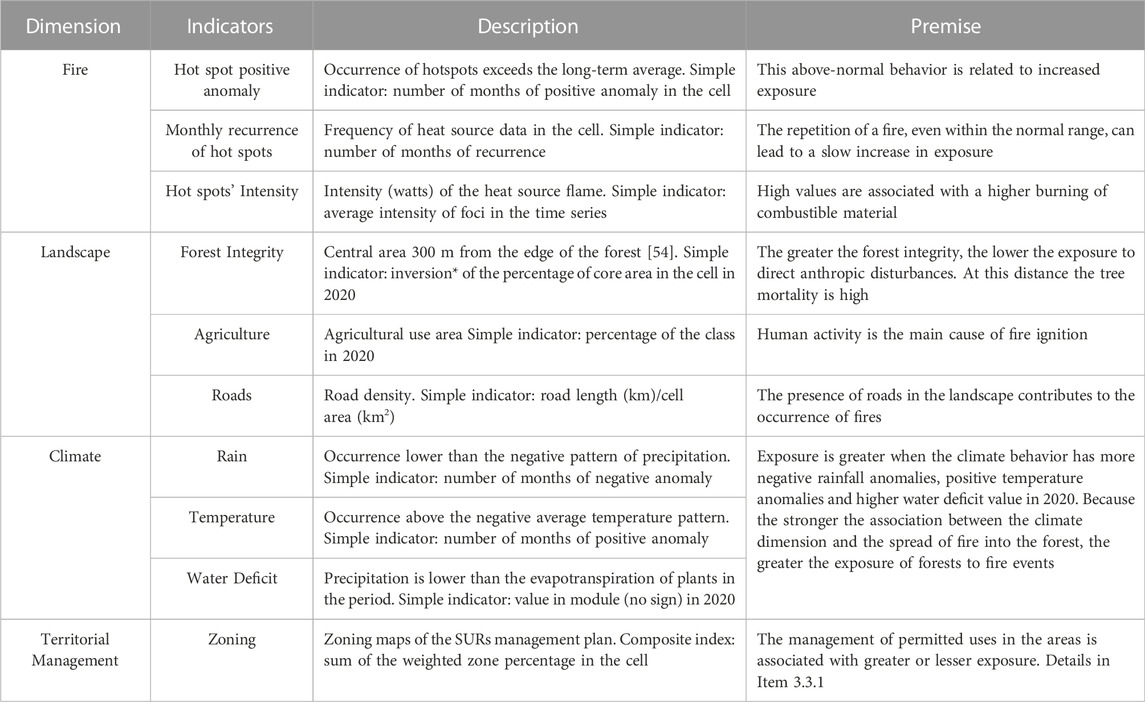
TABLE 4. Components of the Fire Exposure Index (FEI); * The inversion is necessary so that the semantics of the lowest and highest value of this indicator continue to be the lowest and highest exposure, respectively, mathematically represented by: x = 1 - year.
To evaluate the different indicators in relation to exposure, a linear transformation was carried out to produce dimensionless indicators, according to [35]. This process allows the spatialization and observation of the behavior of the indicators through a representation scale of a relational nature. The scale ranges from 0 to 1, where the value “1” indicates greater exposure and the value “0”, less exposure. For qualitative indicators, stratified exposure values were assigned, considering, for example, the zoning areas, provided for in item 3.3.1.
Therefore, the FEI is calculated by the sum of the indicators resulting from the linear transformations as presented in Table 5. The variables that make up the dimensions are summed and transformed into the final synthetic index, the FEI. It should be noted that the evaluation was carried out for the year 2020, which considered the entire time-series data of all variables for the 18 years studied.
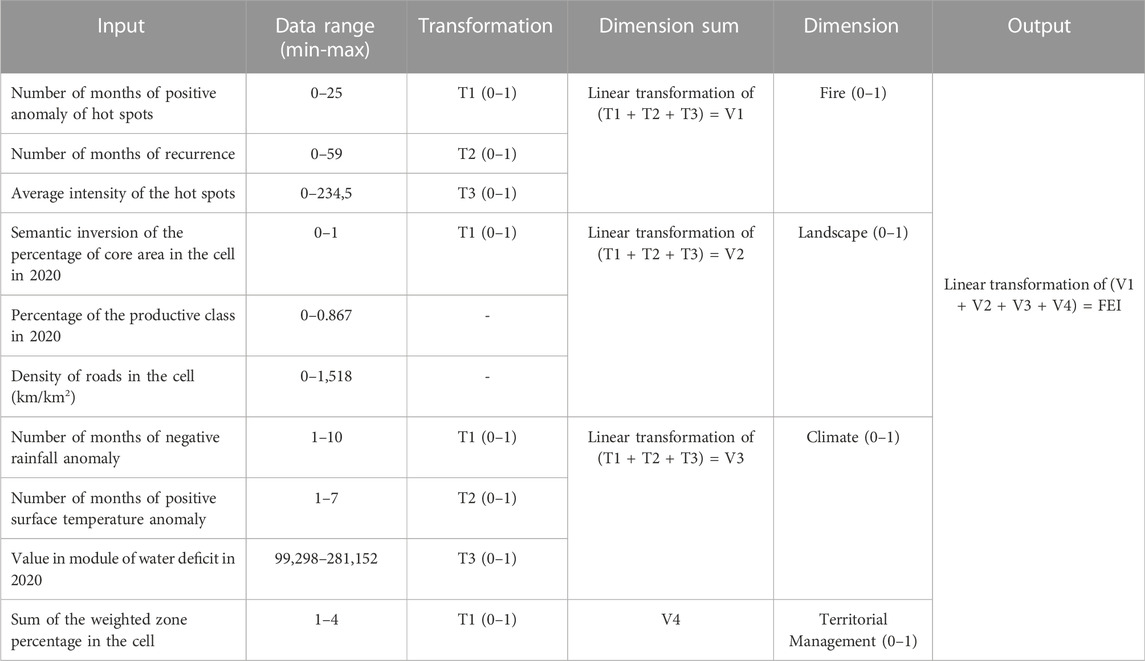
TABLE 5. Procedure to calculate the FEI. The value “1” indicates greater exposure and the value 0, less exposure.
3.3.1 Building composite indicators
The management dimension is determined by the mapping carried out by the Instituto Chico Mendes (ICMBio) teams in partnership with the populations of the SURs to define zones and rules of use. ICMBio is the institute responsible to executing the actions of the National System of Conservation Units, a law instituted in the year 2000 which combines the rules and procedures for the Brazilian protected areas [25]. The management indicator is composed of three and seven zones for the RESEX and FLONA, respectively, in addition to the surrounding area defined in this research. A scale of weights determined from their description was adopted to mathematically weigh the importance and influence of each zone for fire exposure (Table 6). For these weights, it was assumed that these rules are obeyed within the area of the SURs, and are not followed in the surrounding areas. An evaluation of the weights assigned to the zones was carried out to assess their influence on the results. The minimum and maximum intervals were defined and in which zones the weights could be changed, totaling 25 variations and finally obtaining the interquartile difference (Supplementary Table S1).
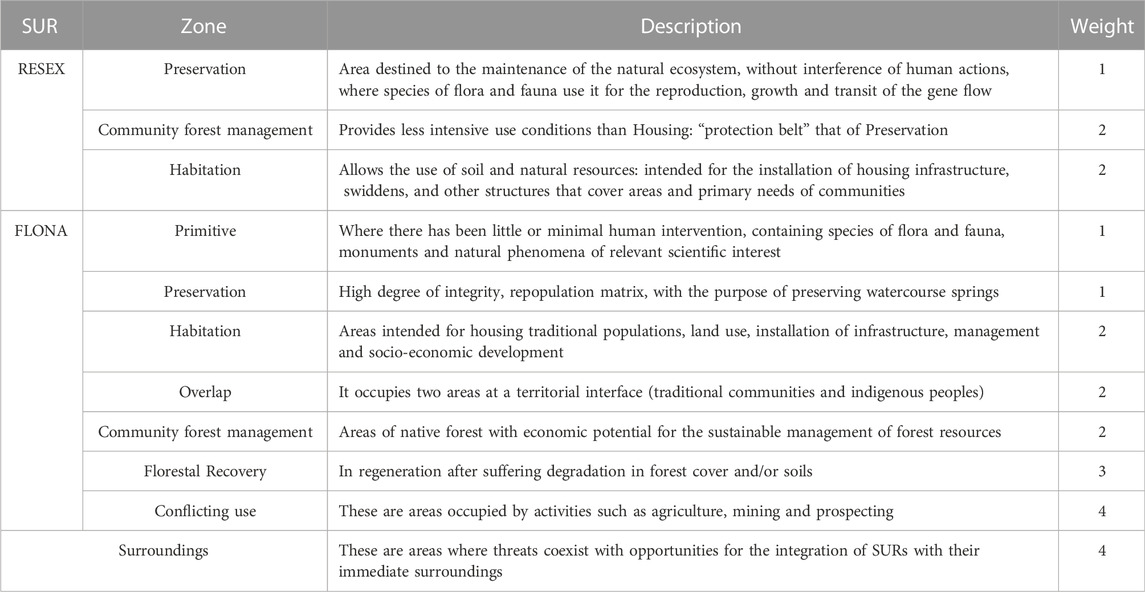
TABLE 6. Characterization of the activities allowed according to the management of the SURs and their surroundings.
The areas destined for the preservation of both SURs and the primitive areas of FLONA Tapajós received the lowest weight (1), since human interference is not allowed in these areas, which reduces exposure to possible ignitions caused by agricultural activities. In the areas where weight two was assigned, it was considered that the uses developed by the populations respect the conservation rules established by the management. However, the human presence may be responsible for the ignition of the fire escape, which, combined with the other conditions presented in the research, has the potential to cause wildfires.
Weight three was assigned to areas that are already at some stage of forest degradation, which makes them more susceptible to fire. Finally, a weight of four was assigned to areas that do not develop activities consistent with the expected conservation for FLONA Tapajós and in the areas surrounding both SURs. The proposed organization highlights the importance of considering the individualities of each SUR to carry out their respective evaluations. The percentage values of each zone present in the cell were weighted by their respective weights, added and, finally, transformed into the zoning indicator for each SUR.
3.4 Data visualization
In this research, a dashboard was used as an alternative for data visualization in order to make the generated data more accessible and to synthesize spatially, through graphics, all the products generated through the analysis carried out.
For this, we structured a database with the information of each step by the procedures described in Table 4 in Section 3.3. Both the results of the indicators, real and with linear transformation, were made available in the created dashboard, to provide access to the user/stakeholder. In addition, the information entered in the dashboard can be exported in table format. The user will also have access to the grid generated in this research, and will be able to attach the information, in order to carry out evaluations based on the available product.
4 Results
4.1 Fire exposure index (FEI)
The resulting dimension of fire indicators showed lower exposure (0–0.1) distributed in 65.7% of RESEX Tapajós-Arapiuns, 74.5% of FLONA Tapajós, 48.5% and 10.8% of the surroundings of RESEX Tapajós-Arapiuns and FLONA Tapajós, respectively (Figures 3A, E), which together represent 52% of the entire study area. In these areas the fire exposure derived from the landscape configuration reaches 0.45, with 39.5% of the Tapajós-Arapiuns RESEX, 34.4% of the Tapajós FLONA, 21.6% and 4.5% in the surroundings of the Tapajós-Arapiuns RESEX and FLONA Tapajós, respectively (Figures 3B, F). Within the SURs, the exposure of the management dimension is up to 0.1 in 28.3% of the areas, in 16.4% of the Tapajós-Arapiuns RESEX area and 43.9% of the Tapajós FLONA area (Figures 3D, H). In these areas, fire exposure is 0 and landscape exposure less than 0.1 occurring in 91% and 56.6%, of the two protected areas, respectively.

FIGURE 3. Dimensions of the FFEI; (A) Fire Map; (B) Landscape Map; (C) Climate Map; (D) Territorial Management Map; (E) Fire Histogram; (F) Landscape Histogram; (G) Climate Histogram; (H) Territorial Management Histogram.
The behavior of the climatic dimension is spatially different from the others, occupying the area of the SURs with exposure values decreasing in the north-south direction (Figures 3C, G). The dimension presents the highest concentration of exposure values between 0.4 and 0.7, representing 74% of the area of the RESEX Tapajós-Arapiuns and its surrounding, and 58.4% of the FLONA Tapajós’s area and its surrounding.
The highest exposure values in the other dimensions, especially fire, follow the spatial distribution of the territorial management dimension. It was observed that the assignment of weights does not influence the result of the final index, since the fire and landscape indices follow the same spatial pattern. Which was confirmed during the evaluation carried out on the weights in Supplementary Table S1, the greater the assigned weight, the greater the exposure in the area, while the decrease in weights presents the lowest maximum interquartile difference.
It is observed that the high values around FLONA Tapajós are mainly concentrated at the intersection of two of the main federal highways in the region. However, the presence of the SUR is evidenced due to the greater presence of less exposed cells in it. In 2020, the highest FEI values, between 0.8 and 1, were distributed in the areas surrounding the SURs, decreasing as one approaches their interior (Figure 4A). Areas with lower exposures (0.1–0.3) cover more than 3,800km2, representing more than 72% of the FLONA Tapajós (Figure 4B). The medium exposures (0.4–0.7) totaled less than 40%, distributed in areas of immediate contact with the surroundings. In the Tapajós-Arapiuns RESEX the exposure is lower (0.1–0.3) in 59,5% of the area, distributed in the habitation and management zones. The exposure is higher (0.8–1) in 28% of the surrounding area, mainly close to the Arapiuns River.
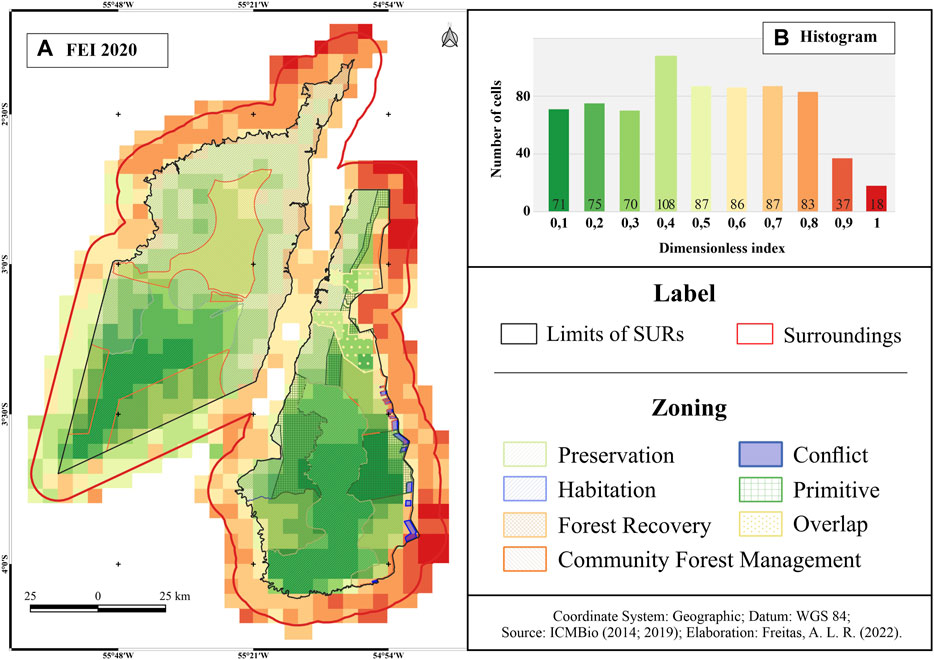
FIGURE 4. FEI Distribution; (A) FEI Map; (B) FEI Histogram.
4.2 Dashboard—FEI 2020
Figure 5 presents an example of the dashboard interface, which is available as an online monitoring system that contains the data and analyzes developed in this research. The spatialized data of the FEI for the year 2020 and the graphics with the information for all cells are available. The dashboard allows the user to trigger a filter by selecting the cell of interest so that the graphs are redistributed to illustrate the behavior of each variable. In this way it is possible to use the information to support planning and management activities of the area regarding wildfires prevention. The platform can potentially be updated every month to subsidize long term monitoring of the management practices.
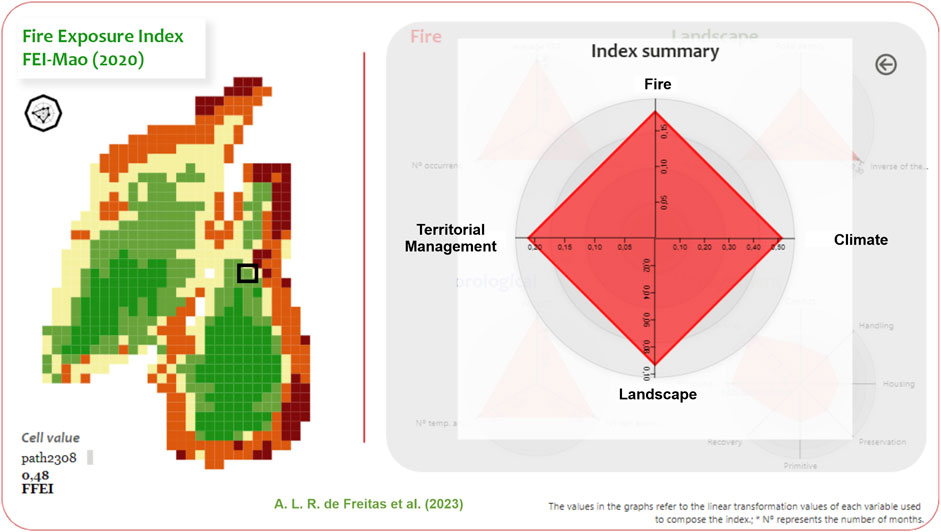
FIGURE 5. FEI Dashboard Representation (2020); Simplified representation of the dashboard with exposure information on each of the FEI dimensions in a cell. To guarantee the intercomparability of the different databases, the values resulting from the linear transformation were arranged. The filter is applied to the maps from the selection of the cell of interest in the SUR map, with the values of its composition being presented in a radar graph.
5 Discussion
Anthropogenic activities worldwide are the main responsible for the occurrence of fires [7]. This is confirmed when the distribution of exposures associated with degradation by fire and forest fragmentation is evaluated in areas intended for use by populations. The territorial management index acts as a guide in the configuration of fire exposure and landscape. However, exposure can be attenuated or intensified according to the behavior of the climatic index, the main responsible for the propagation of fire in the forest [36, 37]. In this case, climatic exposure influences higher FEI values, reaching up to 0.7 in the central areas of the SURs, which in the other indicators did not present exposures greater than 0.4.
In the central areas of the SURs, exposures related to forest fragmentation have values lower than 0.1 for the fire dimension. This is due to the occupation of housing and agricultural activities being concentrated on the banks of the rivers, following the distribution proposed in the management plans (Figures 1, 2) [23, 38]. Even following the management plan, in the Tapajós-Arapiuns RESEX the areas further inland are not occupied, so there are no high values of fire exposure resulting from escapes. However, in years of extreme drought such as the 2015/16 El Niño, occurrences of hotspots and burned areas were recorded inside the Tapajós-Arapiuns RESEX [3, 20]. This highlights the importance of monitoring the fire conditions, presented in this research with the exposure associated with them.
The difference between the typologies and the territorial planning determined by their respective zoning may have contributed to the fact that FLONA Tapajós had lower FEI values. The Tapajós FLONA appears to contain the advance of pressure exerted by its surroundings, unlike what was observed in the Tapajós-Arapiuns RESEX, which has greater exposures than its surroundings. This is an expected behavior, as there are areas allowed by the zoning for agricultural use, which can produce favorable conditions for fire escapes to the forest.
[39] identify that SURs with boundaries close to places with high rates of deforestation, conversion of forest into agriculture and/or fire incidence need long-term management planning to guarantee their conservation. The authors also claim that population density acts in the protection of their territories. In this way, the conservation potential arising from the presence of local communities at the FLONA Tapajós is observed, since it maintained a low occurrence of hotspots even with greater pressures exerted by its surroundings and/or in years of extreme weather (e.g., 2005, 2010 and 2015/16) [3, 20, 40, 41].
In management committee meetings held in 2019, which some authors participated, there were reports that some fires that affected FLONA Tapajós originated in areas close to its border. The large number of fire occurrences during the 2015/16 El Niño was accompanied by community mobilization to prevent fires from reaching the SURs. At FLONA Tapajós, as suggested by [39], population density was potentially one factor the successfully contributed to the containing of fires before reaching more communities. Despite the population density, in the RESEX Tapajós-Arapiuns this pattern was not observed, as large areas were burned in the interior of the SUR, where climatic exposure showed high values, which could act as an exogenous factor. This type of event makes it difficult to implement the measures already developed by managers in the monitoring and prevention of forest fires within the SURs. Therefore, prevention activities can benefit from the knowledge of the exposures of the areas of contact of the SURs with their surroundings.
The gap between fire management policies and local realities marginalizes the fire-use practice without considering the limitations of communities and contributes to failed interventions [15]. Thus, fire management represents a socio-environmental problem, with solutions that should be developed in a participatory manner with the different actors involved [42]. It is understood that by depicting the dynamics of fire exposure is essential to contribute to the creation of risk management strategies, mainly through integrated products, as they can help to support the planning and territorial management of these SURs in the face of internal and external pressures. This importance has increased in the last few years as Brazil has faced a scenario of weakening of the environmental protection [43].
The need and existence of time for the development of public policies together with specialists for the planning of long-term conservation strategies has been identified long ago and is still a measure to be taken today [44]. In this research, the important role of local organization arrangements of SURs in fire management is also highlighted [4], compared to what is found in their surrounding areas. In addition, the production of the tool with open access aims to bring science closer to decision makers, and represents a system that allows the manager to know the areas with greater exposure to fires and, from that, support strategic planning mitigate them.
The exposure obtained through this research can direct actions related to SDGs. The prevention of landscape degradation by fire can reduce an impact associated with the reduction of agricultural potential, leading to the loss of livelihoods, mainly of the women [16]. Among the impacts of fire on agriculture, even if indirect, are the spread of pests and diseases, food security, water supply, among others [45]. Economic consequences and negative impacts on human health from the occurrence of fires in the Amazon are also observed [46].
Additionally, the results and their arrangement in the panel developed in this research provides mechanisms that support risk prevention, configuring a new component of a risk information system, complying with one of the Sendai Protocol’s objectives [18]. In Brazil, some initiatives use early warning systems to prevent and fight forest fires, and confirms the importance of this kind of tool [47–52]. [53] developed a plan that guides actions based on activities already carried out for each alert level for a network of protected areas in the Pantanal biome. The activities that must be carried out by institutions from different spheres (municipal, state, federal and non-governmental) involve communication strategies and local actions.
We observed some limitations in this study methodology associated with the 0.05° spatial resolution: the transition areas between the territorial manage zones and the large areas with water resources present, at this scale has a mixed dimension, inherent to the data aggregation strategy [REF]. An example is when the largest area inside the cell is composed of the primitive zone and a smaller area is the surroundings, which can lead to low exposure of territorial management, but the dynamics in the other dimensions of exposure are greater, making it necessary more detailed analyzes on the influences of FEI on the cell. In these situations, a higher spatial resolution could reduce these mixed land cover and other typologies. However, for some of the variables used, such as the climatic data, there is currently no higher resolution dataset.
The weights assigned to the zones are based on the assumption that their respective management plans are followed in the SURs. This can influence the index use in areas where the plan is not being respected or followed. This caution must be observed in the replication of the methodology developed in this research, since the results were adherent to the reality of each SURs. In this study, this problem is minimized since the ICMBio managers are also part of the study, which means a deep knowledge of the management plans and activities in the protected areas territory.
6 Conclusion
Data from remote sensors and territorial management were used in this research in order to carry out a socio-environmental analysis to determine exposure to forest fires in FLONA Tapajós and RESEX Tapajós-Arapiuns. The integration of socio-environmental data allowed the temporal assessment of the dynamics of hotspots and the different relationships with their factors and conditions. The characteristics of this process were associated with territorial management data for the construction of the Fire Exposure Index (FEI). The research also provides a socio-environmental basis for the development of prevention strategies, since the areas most exposed to forest fires are identified in detail. In this way, preventive activities can be better targeted and more effective, given the identifications of landscape and climatic variables that occur spatially heterogeneously in the territory. In addition, the potential for intra-annual updates of the distribution of exposure in the territory was identified, since the monthly time scale was considered to obtain the indicators of the dimension of fire and climate.
In the study area, more than four thousand kilometers were identified with higher exposure to fires (0.8–1), concentrated in the areas surrounding the SURs, mainly in FLONA Tapajós’ surrounding. The largest exposures within these SURs are in the Tapajós-Arapiuns RESEX, which presented, in 2020, about 4,600 km2 of area in medium exposure (0.4–0.7). The application of the approach developed in this study is useful to indicate in an integrated way the places of greatest exposure to forest fires. The methods were developed by using freely available data and are displayed on-line, free of cost, which makes this methodology replicable for others SURs.
Within the scope of SURs, this methodology can be applied in future studies to assess the adherence of the management plan to the activities carried out in their zones, by exploring the temporal monitoring of exposure and the indicators responsible for its intensification or attenuation. It is recommended that data collection in the field and the use of information to access the other variables that determine vulnerability should be considered future researches. In addition, there is potential to expand the analysis to other territorial political definitions, such as the Brazilian municipalities, making it possible to understand the distribution of exposure in the Brazilian territory based on the zoning present in their master plans.
Data availability statement
The datasets presented in this study can be found in online repositories. The names of the repository/repositories and accession number(s) can be found below: https://github.com/anadefreitas/FireExposureIndex. Data will be made available by the Authors after the article is published.
Author contributions
AdF and LA wrote the manuscript with inputs from all co-authors.
Funding
Support from the Coordination for the Improvement of Higher Education Personnel—Brazil (CAPES) —Financing Code 001 (process 88887.334448/2019-00). To the Funbio Scholarship Program—Conserving the Future (2019) of the Brazilian Fund for Biodiversity in partnership with the Humanize Institute for the resource for field activities (process 089/2019). To the SEM-FLAMA Project: Solutions to reduce the socio-environmental impacts of fire in Sustainable Use Amazon Forests (National Council for Scientific and Technological Development—CNPq, process 441949/2018-5), for participating in the research team, fieldwork and shared knowledge. Voices of Recovery project (The São Paulo Research Foundation—FAPESP, process 2021/07660-2).
Acknowledgments
All authors thank the Brazilian Space Agency (AEB) for paying the article publication charge.
Conflict of interest
Author JF was employed by the company of Brazilian Agricultural Research Corporation—EMBRAPA.
The remaining authors declare that the research was conducted in the absence of any commercial or financial relationships that could be construed as a potential conflict of interest.
Publisher’s note
All claims expressed in this article are solely those of the authors and do not necessarily represent those of their affiliated organizations, or those of the publisher, the editors and the reviewers. Any product that may be evaluated in this article, or claim that may be made by its manufacturer, is not guaranteed or endorsed by the publisher.
Supplementary material
The Supplementary Material for this article can be found online at: https://www.frontiersin.org/articles/10.3389/fphy.2022.1064162/full#supplementary-material
References
1. Nogueira EM, Yanai AM, De Vasconcelos SS, De Alencastro Graça PML, Fearnside PM. Brazil’s Amazonian protected areas as a bulwark against regional climate change. Reg Environ Change (2018) 18(2):573–9. doi:10.1007/s10113-017-1209-2
2. Wade CM, Austin KG, Cajka J, Lapidus D, Everett KH, Galperin D, et al. What is threatening forests in protected areas? A global assessment of deforestation in protected areas, 2001–2018. Forests (2020) 11:539. doi:10.3390/f11050539
3. Withey K, Berenguer E, Palmeira AF, Espírito-Santo FDB, Lennox GD, Silva CVJ, et al. Quantifying immediate carbon emissions from El Niño-mediated wildfires in humid tropical forests. Phil Trans R Soc B (2018) 373:20170312. doi:10.1098/rstb.2017.0312
4. Spínola JN, Silva MJS, Silva JRA, Barlow J, Ferreira J. A shared perspective on managing Amazonian sustainable-use reserves in an era of megafires. J Appl Ecol (2020) 57(11):2132–8. doi:10.1111/1365-2664.13690
5. Geldmann J, Barnes M, Coad L, Craigie ID, Hockings M, Burgess D. Effectiveness of terrestrial protected areas in reducing habitat loss and population declines. Biol Conservation (2013) 161:230–8. doi:10.1016/j.biocon.2013.02.018
6. Tabor K, Hewson J, Tien H, González-Roglich M, Hole D, Williams JW. Tropical protected areas under increasing threats from climate change and deforestation. Land (2018) 7(3):90–14. doi:10.3390/land7030090
7. Sapountzaki K, Dandoulaki M, Louis W, Melissourgos K, Vikatou K, Parker DJ, et al. State-of-the-art on vulnerability territorial systems: The case of forest fire & drought. Brussels: Ensure (2009).
8. Jolly WM, Cochrane MA, Freeborn PH, Holden ZA, Brown TJ, Williamson GJ, et al. Danger from 1979 to 2013. Nat Commun (2015) 6:1–11.
9. Alencar AAC, Solorzano LA, Nepstad DC. Modeling forest understory fires in an eastern Amazonian landscape. Ecol Appl (2004) 14:S139–49. doi:10.1890/01-6029
10. Silva-Junior C, Aragão L, Fonseca M, Almeida C, Vedovato L, Anderson L. Deforestation-induced fragmentation increases forest fire occurrence in central Brazilian Amazonia. Forests (2018) 9(6):305–21. doi:10.3390/f9060305
11. Cardoso MF, Hurtt CG, Moore B, Nobre CA, Prins EM. Projecting future fire activity in Amazonia. Glob Change Biol (2003) 9:656–69. doi:10.1046/j.1365-2486.2003.00607.x
12. Costa BO. Degradação florestal por extração seletiva e fogo na Amazônia Legal. 186p. Tese (Doutorado em Ciências Florestais). Brasília, DF: Universidade de Brasília (2017).
13. Zeng N, Mariotti A, Wetzel P. Terrestrial mechanisms of interannual CO2 variability. Glob Biogeochem Cycles (2005) 19(1):1–15. doi:10.1029/2004gb002273
14. Aragão LEOC, Shimabukuro YE. The incidence of fire in Amazonian forests with implications for REDD. Science (2010) 328(5983):1275–8. doi:10.1126/science.1186925
15. Carmenta R, Coudel E, Steward AM. Forbidden fire: Does criminalising fire hinder conservation efforts in swidden landscapes of the Brazilian amazon? Geogr J (2019) 184(2):23–37. doi:10.1111/geoj.12255
16.UNEP (United Nations Environment Programme). Spreading like wildfire - the rising threat of extraordinary landscape fires. Nairobi: A UNEP Rapid Response Assessment (2022).
17.Intergovernmental Panel on Climate Change - IPCC. In: TF Stocker, D Qin, G-K Plattner, M Tignor, SK Allen, J Boschunget al. editors. Climate change 2013: The physical science basis. Contribution of working group I to the fifth assessment report of the intergovernmental panel on climate change. Cambridge, United Kingdom and New York, NY, USA: Cambridge University Press (2013). p. 1535.
18.UNISDR (United Nations International Strategy for Disaster Reduction). Sendai framework for disaster risk reduction 2015–2030 (2015). Available at: https://www.undrr.org/publication/sendai-framework-disaster-risk-reduction-2015-2030 (Accessed December 27, 2022).
19. Tedim F., Carvalho S. (2013). Vulnerabilidade aos incêndios florestais: reflexões emtorno de aspetos conceptuais e metodológicos. Territorium: Revista Portuguesa de Riscos. Prevenção e Segurança 20, 85–99.
20. Freitas ALR. Exposure to forest fires in sustainable use conservation units in the Amazon. Dissertation (Master in Remote Sensing). São José dos Campos: National Institute for Space Research (2021). p. 134.
22.IPCC. Managing the risks of extreme events and disasters to advance climate change adaptation. Cambridge: Cambridge University Press (2012). p. 582.
24.Instituto Chico Mendes de Conservação da Biodiversidade - Icmbio. Plano de manejo: Floresta Nacional do Tapajós. Brasília: MMA (2019). p. 316.
25.BrasilMinistério do Meio Ambiente - MMA. SNUC – sistema Nacional de Unidades de Conservação da Natureza: Lei nº 9.985, de 18 de julho de 2000; Decreto nº 4.340, de 22 de agosto de 2002; Decreto nº 5.746, de 5 de abril de 2006. Plano Estratégico Nacional de Áreas Protegidas: Decreto nº 5.758, de 13 de abril de 2006. Brasília: MMA (2000). p. 76.
26. Funk C, Peterson P, Landsfeld M, Pedreros D, Verdin J, Shukla S, et al. The climate hazards infrared precipitation with stations - a new environmental record for monitoring extremes. Sci Data (2015) 2:150066–21. doi:10.1038/sdata.2015.66
27.BrasilMinistério do Meio Ambiente - MMAConselho Nacional do Meio Ambiente (CONAMA). Resolução CONAMA N° 13, de 06 de dezembro de 1990 (1990). Define o órgão responsável por cada Unidade de Conservação, juntamente com os órgãos licenciadores e de meio ambiente.
28. Giglio L, Schroeder W, Justice CO. The collection 6 MODIS active fire detection algorithm and fire products. Remote Sensing Environ (2016) 178:31–41. doi:10.1016/j.rse.2016.02.054
29. Klemick H. Shifting cultivation, forest fallow, and externalities in ecosystem services: Evidence from the eastern amazon. J Environ Econ Manage (2011) 61(1):95–106. doi:10.1016/j.jeem.2010.07.003
30. Costa FA. Contributions of fallow lands in the Brazilian amazon to CO2 balance, deforestation and the agrarian economy: Inequalities among competing land use trajectories. Elementa: Sci Anthropocene (2016) 4. doi:10.12952/journal.elementa.000133
31. Silva-Junior CHL, Heinrich HA, Freire ATG, Broggio IS, Rosan TM, Doblas JP, et al. Benchmark maps of 33 years of secondary forest age for Brazil. Sci Data (2020) 7(1):e269. doi:10.1038/s41597-020-00600-4
32. Brandão AO, Souza CM. Mapping unofficial roads with landsat images: A new tool to improve the monitoring of the brazilian amazon rainforest. Int J Remote Sens (2006) 27(1):177–89. doi:10.1080/01431160500353841
33. Botelho J, Costa SCP, Ribeiro JG, Souza CM Mapping roads in the Brazilian amazon with artificial intelligence and sentinel-2. Remote Sensing (2022) 14(15):3625. doi:10.3390/rs14153625
34. Arai E, Shimabukuro YE, Anderson LO, Souza AF, Silva CM, Yamamoto MK. Avaliação da série temporal de dados de temperatura da superfície derivadas do sensor MODIS. In: Simpósio brasileiro de Sensoriamento remoto, 18. (SBSR). Campinas: Anais eletrônicos (2017).
35. Anazawa TM. Vulnerabilidade e território no litoral norte de São Paulo: Indicadores, perfis de ativos e trajetórias. Dissertação (Mestrado em Sensoriamento Remoto). São José dos Campos: Instituto Nacional de Pesquisas Espaciais (2012).
36. Aragão LEOC, Malhi Y, Roman-Cuesta RM, Saatchi S, Anderson LO, Shimabukuro YE. Spatial patterns and fire response of recent Amazonian droughts. Geophys Res Lett (2007) 34(7):L07701–5. doi:10.1029/2006gl028946
37. Morton DC, Le Page Y, Defries R, Collatz GJ, Hurtt GC. Understorey fire frequency and the fate of burned forests in southern Amazonia. Phil Trans R Soc B (2013) 368:20120163. doi:10.1098/rstb.2012.0163
38. Carmenta R, Vermeylen S, Parry L, Barlow J. Shifting cultivation and fire policy: Insights from the brazilian amazon. Hum Ecol (2013) 41:603–14. doi:10.1007/s10745-013-9600-1
39. Nepstad D, Schwartzman S, Bamberger B, Santilli M, Ray D, Schlesinger P, et al. Inhibition of Amazon deforestation and fire by parks and indigenous lands. Conservation Biol (2006) 20(1):65–73. doi:10.1111/j.1523-1739.2006.00351.x
40. Anderson LO, Ribeiro Neto G, Cunha AP, Fonseca MG, Moura YM, Dalagnol R, et al. Vulnerability of Amazonian forests to repeated droughts. Phil Trans R Soc B (2018) 373:20170411. doi:10.1098/rstb.2017.0411
41. Silveira MVF, Petri CA, Broggio IS, Chagas GO, Macul MS, Leite CCSS, et al. Drivers of fire anomalies in the Brazilian amazon: Lessons learned from the 2019 fire crisis. Land (2020) 9(12):516. doi:10.3390/land9120516
42. Carmenta R, Parry L, Blackburn A, Vermeylen S, Barlow J. Understanding human-fire interactions in tropical forest regions:a case for interdisciplinary research across the natural and social sciences. Ecol Soc (2011) 16:art53. doi:10.5751/es-03950-160153
43. Vale MM, Berenguer E, Menezes M, Castro E, Siqueira L, Portela C. The Covid-19 pandemic as an opportunity to weaken environmental protection in Brazil. Biol Conservation (2021) 255:108994. doi:10.1016/j.biocon.2021.108994
44. Mares MA. Conservation in south America: Problems, consequences, and solutions. Science (1986) 233(4765):734–9. doi:10.1126/science.233.4765.734
45. Hoegh-Guldberg O, Jacob D, Taylor M, Bindi M, Brown S, Camilloni I, et al. Impacts of 1.5°C global warming on natural and human systems. In: V Masson-Delmotte, P Zhai, H-O Pörtner, D Roberts, J Skea, PR Shuklaet al. editors. Global warming of 1.5°C. An IPCC special report on the impacts of global warming of 1.5°C above pre-industrial levels and related global greenhouse gas emission pathways, in the context of strengthening the global response to the threat of climate change, sustainable development, and efforts to eradicate poverty (2018).
46. Campanharo WA. Assessment of the impact caused by fires in the Brazilian Legal Amazon from 2001 e 2020. Thesis (Doctorate in Remote Sensing). São José dos Campos: National Institute for Space Research (2021). p. 154.
47. Anderson LO, Burton C, Reis JBC, Pessôa ACM, Bett P, Carvalho S, et al. An alert system for seasonal fire probability forecast for south American protected areas. Clim Resilience (2021) 1. doi:10.1002/cli2.19
48.CEMTEC (MS Weather and Climate Monitoring Center). Incêndios florestais (2022). Available at: https://www.cemtec.ms.gov.br/incendios-florestais/(Accessed on Set 20, 2022).
49.MAPBIOMAS. MAPBIOMAS fire method (2022). Available at: https://mapbiomas.org/metodo-mapbiomas-fogo-1 (Accessed on Set 20, 2022).
50.INPE (National Institute for Space Research). Fire hazard/weather (2022). Available at: https://queimadas.dgi.inpe.br/queimadas/portal/risco-de-fogo-meteorologia (Accessed on Set 20, 2022).
51.SIGA (Environmental Geographic Information System of the State of Goiás). Trend and risk of fires in goiás (2022). Available at: https://siga.meioambiente.go.gov.br/documents/821 (Accessed on Set 20, 2022).
52.GFED (Global Fire Emissions Database). Amazon dashboard (2022). Available at: https://globalfiredata.org/pages/amazon-dashboard/(Accessed on Set 20, 2022).
53. Guerra A, Roque FDO, Larcher L, Rabelo APC, Toma TSP, Anderson LO, et al. Plano operativo de prevenção e combate aos incêndios florestais da Rede Amolar. Technical Report. Rede Pantanal (2021) 50. doi:10.13140/RG.2.2.34550.52804
Keywords: exposure index, fires, sustainable use reserves, land use and land cover, dried
Citation: De Freitas A, Ferreira J, Escada M, Reis J, Leite C, Andrade D, Spínola J, Soares M and Anderson L (2023) Fire exposure index as a tool for guiding prevention and management. Front. Phys. 10:1064162. doi: 10.3389/fphy.2022.1064162
Received: 07 October 2022; Accepted: 06 December 2022;
Published: 08 March 2023.
Edited by:
Leonardo Nascimento Ferreira, University of Oxford, United KingdomReviewed by:
Derick Quintino, Luiz de Queiroz College of Agriculture, University of São Paulo, BrazilThais Michele Rosan, University of Exeter, United Kingdom
Copyright © 2023 De Freitas, Ferreira, Escada, Reis, Leite, Andrade, Spínola, Soares and Anderson. This is an open-access article distributed under the terms of the Creative Commons Attribution License (CC BY). The use, distribution or reproduction in other forums is permitted, provided the original author(s) and the copyright owner(s) are credited and that the original publication in this journal is cited, in accordance with accepted academic practice. No use, distribution or reproduction is permitted which does not comply with these terms.
*Correspondence: Ana De Freitas, YWxhcmlzaWdAZ21haWwuY29t