- 1Petroleum Exploration and Development Research Institute, Beijing, China
- 2College of Geosciences, China University of Petroleum, Beijing, China
- 3CNPC Engineering Technology R&D Company Limited, Beijing, China
- 4Petro China Changqing Oilfield Company Exploration and Development Research Institute, Xi’an, China
- 5College of Petroleum Engineering, Xi’an Shiyou University, Xi’an, China
Carbonate gas reservoirs in the eastern Sichuan Basin are featured by low matrix permeability and well-developed fractures, caves, and faults, which result in complicated fluid flow and connectivity. The Wubaiti Carboniferous gas reservoir is an earlier developed block in Eastern Sichuan with a development history of 27 years. The geological features, e.g., block structure and fault development, have been extensively studied, but a few studies address the connection relationship and gas–water interface of the DT 2 well area in the north. To solve this problem, this paper proposes a reserve simulation method based on the conventional connectivity analysis, which calculates the reserves of different gas–water interfaces in the well area. Combined with production performance analysis, the well-controlled reserves and drainage area were also determined. The analysis verifies the connectivity between wells. Integrating with interference testing, fluid properties, and seismic and geological data, the connection relationship between well areas is further clarified. The results show that the northern water bodies of the DT 2 well area consist of two independent and disconnected water bodies. There is a blocking zone between the DT 2 and DT 3 and DT 4 wells, which causes the disconnection of water bodies but the connection of gas. The results also indicate that the eastern water body of the main area and the eastern water body of the DT 2 well area are part of a uniform water body with a uniform gas–water interface. The research method is significant for the connectivity research of similar gas reservoirs.
Introduction
Connectivity evaluation is the key to designing a reasonable development policy for gas reservoirs and ensuring the efficient development of natural gas. Carbonate gas reservoirs in the Eastern Sichuan Basin have the characteristics of low matrix permeability, well-developed fractures and caves, and a high density of faults. The reservoirs are highly heterogeneous, and the fluid flow and connectivity relationships are very complicated. The Wubaiti Carboniferous gas reservoir has a long development history of 27 years in Eastern Sichuan. Geological features such as block structures and fault development have been studied extensively, but the connection relationship and the gas–water interface in the DT 2 well area, north of the development area, remain unknown. Understanding the gas reservoir connectivity and gas–water relationship has a significant meaning for finding water control measures and proposing technical countermeasures to extend the production life [1–4].
Geological Setting and Development Features
The Wubaiti block is located in Kaijiang County, Sichuan Province, and Kaizhou District, Chongqing City. It belongs to a local structure at the northern end of the Datianchi high-steep structural belt in eastern Sichuan, which is a short-axial anticline. The second member of the Huanglong Formation is the primary natural gas-bearing interval, and the first and third members of the Huanglong Formation are secondary. The accumulative thickness of the gas reservoir ranges between 25 and 35 m, and the total thickness of the reservoir is up to 25.12 m. The gas-bearing reservoirs are highly heterogeneous with an outstanding difference in permeability, and the high and low permeability intervals are staggered. Well-test interpretation results show that most wells have the flow characteristics of multilayer composite formations. The low permeability reservoir is commonly located at the edge of the gas field. Reservoir space includes four types of pores, caves, throats, and fractures, and the reservoir space is dominated by fracture pores. Additionally, the fractures are generally fault-related. The methane content of natural gas is over 95%, which is a dry gas reservoir. The gas reservoir is surrounded by edge water, and the type of formation water is CaCl2. The original formation pressure of the gas reservoir is 59.74 MPa with a pressure coefficient of 1.33. The depth of the middle part of the reservoir is -4,175 m above sea level with a formation temperature of 113.03°C. The gas reservoir type is a stratigraphic–structural composite trap gas reservoir with weak edge water. There are 53 gas wells and 23 water-producing gas wells within the study block, and the cumulative gas production is 201.6 × 10⁸ m3. The gas production of each well varies dramatically with a high proportion of water-producing well (the absolute open flow rate of gas wells: 8–60 × 104 m3/day). Previous studies suggest that the reason and rule for water production are very complicated [5–8].
Connectivity and Gas–Water Distribution in the DT 2 Well Area
There are currently six wells in the DT 2 well area in the northern part of the block, of which DT 3 and DT 4 are water-producing wells. The early production well (DT 2) has a higher gas production than the later production wells (DT 022-1, DT 002-2, and DT 002-3). The interference test results approved that with the exploitation of DT 2 well, the measured formation pressure of DT 3 and 4 wells keeps decreasing. The DT 3 well decreased from the original 64.93–58.03 MPa, and the DT 4 well dropped from 60.19 to 46.32 MPa. DT 002-1, 002-2, and 002-3 wells are located between Fault 1 and Da13 Fault (Figure 1). These three wells penetrate the same trap and intervals with the DT 2 well, and the formation pressure of these three wells maintains decreased since the start of production. It indicates that DT 2 well is connected with DT 3 and 4 and DT 002-1 and 002-2 wells.
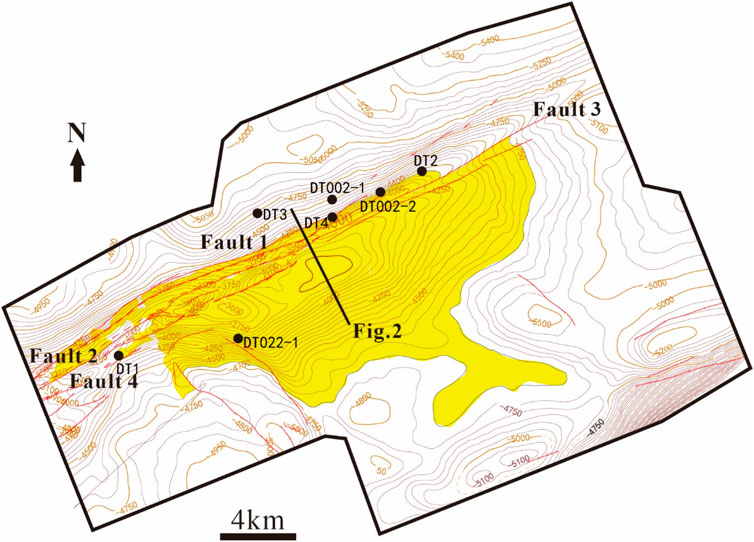
FIGURE 1. Structure map of the lower Permian bottom of Wubaiti structure belt. Yellow block shows extent of study gas reservoir.
The initial formation pressure of DT 2 well converted to an altitude of -4,175 m in the middle of the main gas reservoir is 59.48 MPa, which is consistent with the converted formation pressure (59.53 MPa) of the main gas reservoir. To verify the connectivity between the DT 2 well area and the main area, interference tests were carried out in the study block. In January 1992, the formation pressure of the DT 2 well was 59.79 MPa after the completion of the well. TD 15 well was put into production in October 1993. DT 2 well measured formation pressure of 59.03 Mpa in July 1994, which was 0.76 Mpa lower than when the well was completed. (The shut-in casing pressure of the TD 15 well was 48.4 Mpa when the well was opened. In July 1994, the well's production casing pressure was 37.86 Mpa, and the pressure change value was 10.44 Mpa.) In addition, the Da 13 fault has a relatively small displacement at the northeastern end of the block, which does not completely breach the Carboniferous reservoirs. The discussed data all demonstrate that the DT 2 well area is connected to the main area of the gas reservoir.
The TD 23 well in the eastern part of the main area of the block is a water-producing well. The gas–water interface in the main area has been confirmed to be −4,700 m by many data. Because the DT 2 well area is connected to the DT 3 and 4 well water-bearing areas and the main gas reservoir area, the gas–water interface data determined by the gas and water well pressure intersection method are shown in Table 1. It can be seen from Table 1 that the calculated gas–water interface results are quite different. According to the actual drilling data of DT 3 and 4 wells, the gas–water interface is around −4,200 m (the calculation result has errors due to the previous pressure drop in DT 4), which is quite different from the main area. Two questions, therefore, arise: what is the depth of the gas–water interface in the DT 2 well area, and what is the distribution and connection of the surrounding water?

TABLE 1. Table for calculating gas–water interface in the Datian 2 well area by the pressure intersection method.
Connectivity Analysis
To solve the problems mentioned earlier, firstly, the seismic data, geological data, oil, gas, and water properties, and interference testing data are integrated to investigate the connection relationship between the well areas. Then, a reserve simulation method is introduced into the conventional connectivity analysis method. By simulating the reserves of different gas–water interfaces in the well area constrained by the well-controlled reserves and gas drainage range determined by the production data, the connection relationship between the well areas have been further clarified [9, 10].
Analysis of Oil and Gas Properties
According to the natural gas analysis results of each well, the natural gas composition in the main area of the gas reservoir is basically similar to that of the gas wells in the DT 2 well area. They all have a high-volume percentage of CH4 above 95%, a low percentage of heavy hydrocarbons below 0.6%, and a low percentage of non-hydrocarbons. Therefore, it is believed that the geological environment of oil and gas preservation in each well area is consistent, which indicates a high possibility of well connection.
Analysis of Production Characteristics
The DT 2 well was put into production in September 1994. The initial daily gas production was 32.1 × 10⁴ m3. This well penetrated into a well reservoir with a high density of fractures. The formation water began to be produced in February 2003, but the initial water production was not high, with a daily water production of approximately 1–2 m3/day. Water production has been on the rise in the later stage, but the overall water production is not large. The water production types of gas wells in the Wubaiti block can be divided into two types: partially sealed water and edge water intrusion. Due to the limited energy of the water, the water–gas ratio of the partially sealed water is usually characterized by a gradual decrease. The water–gas ratio of the DT 2 well has increased year by year, which is in line with the type of water produced by edge water intrusion. The cumulative gas production of the DT 2 well before water breakthrough is 3.53 × 10⁸ m3, and the calculated drainage radius is approximately 500 m. Therefore, the gas–water interface is estimated to be approximately −4,700 m.
Seismic and Geological Data Analysis
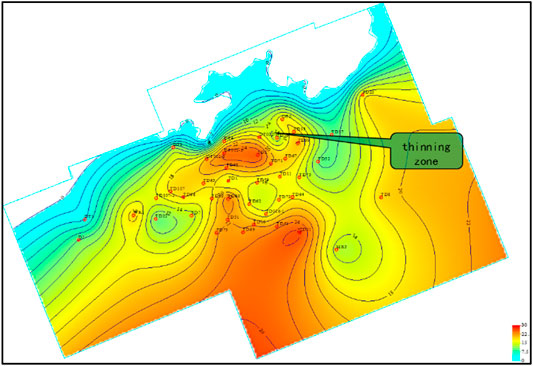
According to the seismic interpretation results, the seismic survey line 86DTC-D470 section shows that the carboniferous on the hanging wall of Fault 1 has not been thoroughly eroded and has a thick residual thickness (Figure 2). In contrast, the seismic reflectors of the carboniferous strata on the footwall of Fault 1 are weak, and the formation becomes progressively thin toward Fault 2. The reservoir thickness distribution map was conducted based on the latest geological research results, such as logging and cores. It shows that there is a thinning zone between DT 2 well and DT 3 and 4 wells (Figure 3). Consequently, it is inferred that a series of block zones exist between DT 2 well and DT 3 and 4 wells.
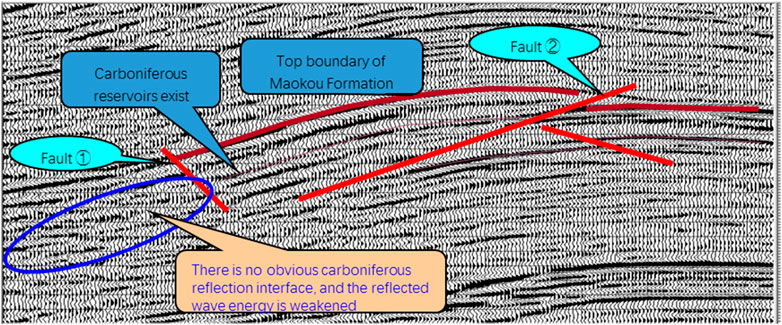
FIGURE 2. Seismic profile of line 86DTC-D470. Location is marked in Figure 1.
Reserve Simulation Method
According to the analysis of single-well production characteristics and the calculation results of dynamic reserves, DT 2, DT 002-1, DT 002-2, and DT 002-3 wells have an accumulative gas production of 13.1 × 10⁸ m3. The total dynamic reserves of the four wells are 24.3 × 10⁸ m3. The ratio of dynamic and static reserves in the block is taken as the average value of 0.83, which translates into geological reserves to be approximately 29.3 × 10⁸ m3. The gas reservoir numerical model method is used to simulate different gas–water interfaces, and then, the geological reserves are calculated. Two reservoir models are designed for reservoir numerical modeling. Comparing the calculated reserves with the geological reserves converted using dynamic data, we can determine which model is able to reflect the actual reservoir structure.
Model 1: DT 3, 4, and 2 wells are connected without blocking zone, and the gas–water interface is set as −4,200 m.
According to the structural map, there are two small traps in the east and west in the DT 2 well area in the north. The western small trap currently has no well control. Therefore, only the eastern trap of the DT 2 well area is considered for the reserve comparison. In the numerical model (Figure 4), the gas–water interface is set as −4,200 m. According to parameters such as porosity, saturation, and effective thickness, the geological reserves are calculated to be approximately 23.5 × 10⁸ m3. It is far from the 29.3 × 10⁸ m3 of geological reserves converted from the dynamic data and even smaller than the dynamic reserves. Therefore, this model cannot represent the actual reservoir structure.

FIGURE 4. Gas–water distribution map of Wubaiti Carboniferous gas reservoir (gas–water interface of Datian 2 well area is −4,200 m).
Model 2: There are blocking zones among DT 3, 4, and 2 wells, and the gas–water interface in the northeast of the DT 2 well area is set as −4,700 m.
In the numerical model (Figure 5), the gas–water interface of the eastern trap is set at −4,700 m. According to parameters such as porosity, saturation, and effective thickness, the geological reserves are calculated to be approximately 30.2 × 10⁸ m3. It is very close to the geological reserves converted from the dynamic data, which is 29.3 × 10⁸ m3. Therefore, it is inferred that the gas–water interface in the northeast of the DT 2 well area is −4,700 m, which reflects the actual situation of the gas reservoir.
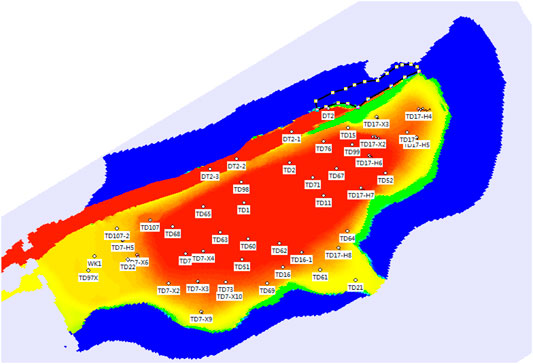
FIGURE 5. Gas–water distribution map of Wubaiti Carboniferous gas reservoir (gas–water interface in the eastern trap of Datian 2 well area is −4,700 m).
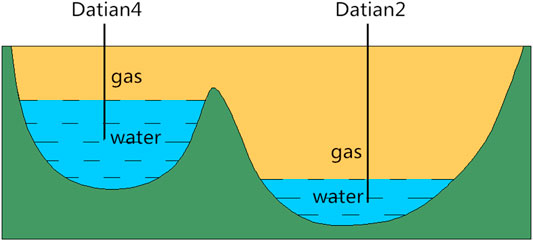
In summary, in the eastern trap of the DT 2 well area, there should be some kind of blocking zone at the northeast end of Fault 1 between the DT 2 well and the DT 4 well. These blocking zones divide the water body in the northern part of the well into two independent and disconnected water bodies. However, the blocking zones are not high enough to block the gas flow in the upper gas cap and only block the lower water body (Figure 6). The water body in the east of the DT 2 well area and the water body in the main area should be the same water body and have the same gas–water interface.
Conclusion
(1) Carbonate gas reservoirs in the eastern Sichuan Basin are affected by factors such as cracks and faults, and their internal structure is complex, which results in complex fluid flow and connectivity.
(2) The results show that the northern water body of the DT 2 well area should be two independent and disconnected water bodies. The eastern water body of the main body area and the eastern water body of the DT 2 well area should be the same water body with the same gas–water interface. There is a blocking zone among the DT 2 and DT 3 and 4 wells, which leads to the gas connection in the well area and the disconnection of the water body.
(3) The reserve simulation method is introduced into the connectivity analysis method. By comparing the calculated reserves of different gas–water interfaces through reservoir modeling with the well-controlled reserves determined by the dynamic analysis method, better analysis and verification of the inter-well connectivity relationship is achieved. It has a strong significance for similar gas reservoirs during the connectivity analysis.
Data Availability Statement
The raw data supporting the conclusions of this article will be made available by the authors without undue reservation.
Author Contributions
YJ wrote the manuscript. All authors discussed the contents.
Conflict of Interest
TZ was employed by CNPC Engineering Technology R&D Company Limited. This company is owned by CNPC, not a sponsor, and our work was not funded by this company. LY was employed by Petro China Changqing Oilfield Company Exploration and Development Research Institute.
The remaining authors declare that the research was conducted in the absence of any commercial or financial relationships that could be construed as a potential conflict of interest.
Publisher’s Note
All claims expressed in this article are solely those of the authors and do not necessarily represent those of their affiliated organizations or those of the publisher, the editors, and the reviewers. Any product that may be evaluated in this article, or claim that may be made by its manufacturer, is not guaranteed or endorsed by the publisher.
References
1. Zhuang H. Dynamic Well Testing in Petroleum Exploration and Development[M]. Beijing: Petroleum Industry Press (2009).
2. Shen P, Xu R, Li Z. Reservoir Formation Conditions of Wubaiti Gas Field in East Sichuan and its Efficient Exploration Experiences [J]. Nat Gas Industry (1998) 18(6):5–9.
3. Ma X, Yang Y, Wen L, Luo B. Distribution and Exploration Direction of Medium- and Large-Sized marine Carbonate Gas fields in Sichuan Basin, SW China. Pet Exploration Dev (2019) 46(1):1–15. doi:10.1016/s1876-3804(19)30001-1
4. Jia A, Meng D, He D. Technical Measures of Deliverability Enhancement for Mature Gas fields: A Case Study of Carboniferous Reservoirs in Wubaiti Gas Field, Eastern Sichuan Basin, SW China[J]. Pet Exploration Dev (2017) 44(4):580–9. doi:10.1016/s1876-3804(17)30070-8
5. Zhang R, Zhang P, Ma G. Adaptability of Recovery Method for Low Permeability Carboniferous Gas Reservoir Sin Eastern Sichuan Basin[J]. Nat Gas Exploration&Development (2009) 32(4):32–6.
6. Dong C, Yang W, Wu S. Type and Enrichment Characteristics of Carboniferous Gas Reservoir in East Sichuan Basin[J]. Fault-Block Oil & Gas Field (2014) 21(5):564–8.
7. Chen S, Zhang N, Liu J. Discussion on EOR Technologies in Late Development Period of Carboniferous Gas Reservoirs in East Sichuan basin [J]. Nat Gas Industry (2009) 29(5):92–4.
8. Zhong F. Practice and Knowledge of Natural Gas Development in Sichuan Basin[J]. Nat Gas Industry (2002) 22(supplementary issue):8–10.
9. Su Y, Li X, Wan Y. Research on Connectivity Evaluation Methods and Application for Dolomite Reservoir with fracture-Cave[J]. Nat Gas Geosci (2017) 28(8):1219–25.
Keywords: carbonate rock, gas reservoir, connectivity, gas-water interface, blocking zone
Citation: Jiang Y, Chen L, Zhou T, You L, Chu G, Ren D and Zhou Z (2022) Research on Well Area Connectivity of Carbonate Gas Reservoir in Eastern Sichuan Basin—A Case Study of Wubaiti Block. Front. Phys. 10:818804. doi: 10.3389/fphy.2022.818804
Received: 20 November 2021; Accepted: 21 January 2022;
Published: 18 March 2022.
Edited by:
Qingxiang Meng, Hohai University, ChinaReviewed by:
Xiang Shan, PetroChina Hangzhou Research Institute of Geology, ChinaXing Wu, Sinopec, China
Copyright © 2022 Jiang, Chen, Zhou, You, Chu, Ren and Zhou. This is an open-access article distributed under the terms of the Creative Commons Attribution License (CC BY). The use, distribution or reproduction in other forums is permitted, provided the original author(s) and the copyright owner(s) are credited and that the original publication in this journal is cited, in accordance with accepted academic practice. No use, distribution or reproduction is permitted which does not comply with these terms.
*Correspondence: Yandong Jiang, bWFpbHRvOjQ3MDM3NDI1QHFxLmNvbQ== Liang Chen, R2VvcmFiYml0MTk4N0Bob3RtYWlsLmNvbQ==
 Yandong Jiang
 Liang Chen
 Tuo Zhou3