 Shan Lin
 Jun Chang
 Jiachen Sun
 Peng Xu
- 1School of Information Science and Engineering and Shandong Provincial Key Laboratory of Laser Technology and Application, Shandong University, Qingdao, China
- 2Key Laboratory of Laser and Infrared System of Ministry of Education, Shandong University, Qingdao, China
- 3Jinan Jingheng Electronics Co., Ltd., Jinan, China
Tunable Diode Laser Absorption Spectroscopy (TDLAS), a trace gas sensing technology based on infrared absorption spectroscopy, has been developed rapidly in the past few decades. The advantages of low cost and easy miniaturization could be applied in real-time monitoring. As an important factor, the detection sensitivity of TDLAS has been improved by a variety of methods. In this review paper, the important advances in TDLAS detection sensitivity are discussed, including the selection of absorption lines, the improvement of diode lasers, the design of effective optical paths, data demodulation, and the suppression of background interference. For gases with high application values, such as CH4, CO2, and NO, we summarize the detection sensitivity that the existing TDLAS system has been achieved, combined with the above-improved process. However, considering the principle of infrared absorption, the increase in detection sensitivity could reach an ultra-limit. Therefore, the hypothesis of the sensitivity limit of TDLAS is proposed at the end of the paper, through the quantization analysis.
Introduction
Real-time monitoring of trace gas concentrations has become more significant in the domains of business, agriculture, social life, and environmental protection in recent years. Trace gas sensing detection of spectroscopy approach is widely employed in different industries, such as environmental monitoring, combustion diagnosis, and aerospace, due to its benefits of high sensitivity, low cost, real-time monitoring, and non-invasiveness [1–3]. In the early 1970s, tunable diode lasers were applied to trace gases detection, greatly improving the portability of optical gas sensing technology and reducing detection costs [4]. With the improvement of the output power and wavelength stability of semiconductor lasers, many spectroscopy-based techniques such as tunable diode laser absorption spectroscopy (TDLAS), photoacoustic spectroscopy (PAS) [5, 6], photothermal spectroscopy (PTS) [7], cavity ring-down spectroscopy (CRDS) [8], and other detection methods have been widely used [9, 10].
In PAS, quartz-enhanced photoacoustic spectroscopy (QEPAS) is the most commonly used technique. While the quartz tuning fork improves the anti-interference and selectivity of QEPAS, it also has a long process of accumulating acoustic energy and is easily disturbed by strong electromagnetic environment. As another indirect absorption spectroscopy technique, PTS has high sensitivity and is not affected by scattering and background signals. However, the cost of the PTS system is high, and it is not suitable for large-scale industrial applications at this stage. As for CRDS, the absorption optical path could be extended to thousands of meters by the optical mirror, so the detection accuracy is extremely high. However, this method has relatively high requirements on the experimental system and is difficult to be used for on-site online measurement. TDLAS has strong adaptability to complex environments, high selectivity, low cost, and the measurement results meet most actual needs. Its application value has always been the focus of researchers.
With the development of related technologies, researchers are paying more and more attention and hoping to improve the detection sensitivity of the TDLAS system through a variety of methods. These approaches mainly include the selection of absorption lines and diode lasers, the improvement of the effective optical path, the demodulation of data, and the suppression of background interference, which together achieved a quite ideal detection effect. However, based on the principle of infrared absorption, there should be a limitation of the detection sensitivity, which is related to the type of gas and the laser energy involved in the absorption.
Therefore, this review covers the evolution of TDLAS detection sensitivity in recent years, discusses the improvement of key components in the existing system, and compares the detection sensitivity with different improved techniques. However, the improvement of TDLAS sensitivity is not endless. Through the quantization analysis of gas infrared absorption, the assumption about the ultra-limit of TDLAS detection sensitivity is proposed at the end of this paper.
Principle
According to Beer Lambert’s law, the attenuation of light intensity is related to the concentration of the absorbing medium, the length of the optical path, and the lineshape. Based on this theory, the output wavelength of the tunable diode lasers could be tuned by current, temperature, and other ways to cover the gas absorption lines. The photon energy is absorbed by the gas molecules through the optical path, and the transmitted light intensity is attenuated. Then the absorption information of the gas can be obtained by detecting the variation of light intensity. Scanned-wavelength direct absorption spectroscopy (DAS) and scanned-wavelength modulation spectroscopy (WMS) are two commonly used detection techniques.
As shown in Figure 1, a low-frequency triangular wave, sawtooth wave, or trapezoidal wave is used to drive the diode laser in scanned-wavelength direct absorption spectroscopy so that its output wavelength changes in the same way. After scanning the characteristic absorption peak of the corresponding gas, the concentration information of the gas can be obtained through the photodetector and the related data processing modules. The high-frequency sinusoidal signal is superimposed on the low-frequency scanning signal in wavelength-modulation spectroscopy, which can effectively suppress the interference of the system noise. The harmonic signal is generated after being absorbed by the gas, and its amplitude is proportional to the concentration of the gas to be measured [11].
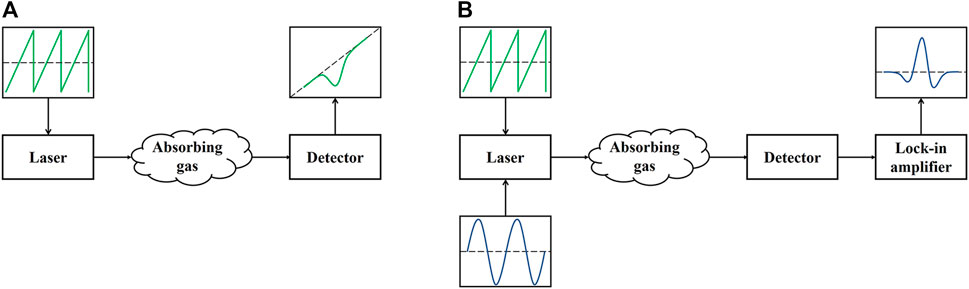
FIGURE 1. (A) Scanned-wavelength direct absorption spectroscopy. (B) Scanned-wavelength modulation spectroscopy.
Methods to Improve TDLAS Detection Sensitivity
Researchers have done a lot of work to improve the sensitivity of TDLAS, mainly including the selection of absorption lines, the improvement of diode lasers, the design of effective optical path, signal demodulation, and the suppression of background interference.
The Selection of Absorption Lines
The fundamental, overtone, and difference bands are mostly concentrated in the infrared area, which features a lot of absorption lines. Figure 2 shows the linestrength of various infrared absorption transitions for a few common species in the range of 400–10,000 cm−1 at 296 K. Therefore, it is important to select an appropriate absorption line for trace gas detection. Firstly, the absorption lines should be sufficiently independent to avoid interference from other gases that are abundant in the atmosphere, such as H2O and CO2 [12]. Furthermore, the line strength should be appropriate to improve the detection sensitivity of the TDLAS system [13, 14]. The line strength of the gas absorption spectroscopy represents the absorption capacity of a specific wavelength, which is related to the distribution of low-energy particles and the transition probability of the gas molecules. Therefore, the absorption line strength is most affected by temperature. Moreover, the lineshape function is highly significant when simulating the profile of the gas absorption spectroscopy, and different lineshape functions might reflect different broadening mechanisms. The Doppler effect of molecular motion dominates spectroscopy broadening in high-temperature and low-pressure conditions, and it is commonly characterized by the Doppler line profile. As for low-temperature and high-pressure conditions, the collision of molecular motion plays a dominant role and the Lorentzian line profile is generally used to describe the line broadening [15]. In most cases, the effects of Lorentz broadening and Gaussian broadening must be evaluated at the same time, and the Voigt profile is the convolution of the Gaussian and Lorentzian profiles [16].
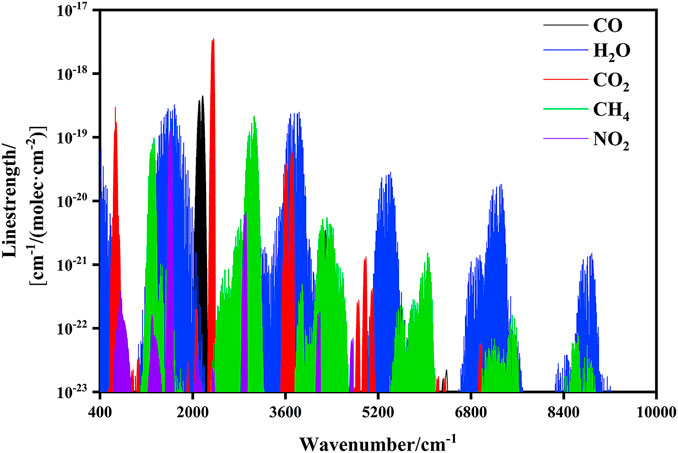
FIGURE 2. Absorption lines of typical atmospheric species in the infrared. Data are taken from the spectroscopic database HITRAN.
Databases such as GEISA, HITEMP, and HITRAN provide detailed spectral parameters [17–19], covering more than 709,000 transitions for most atmospheric species. The individual spectral line data including line strength, wavenumber, and lower state energy, are suitable for analysis and selection of absorption lines. Furthermore, the relevant data are corrected and supplemented by related researchers, which helped to further improve the accuracy of gas detection [20].
The Improvement of Diode Lasers
As the light source, the linewidth of the laser should be narrow. It should also have the characteristics of stable performance, compact structure, and high output power. Therefore, the main applications for trace gas monitoring in the laboratory and industrial settings are distributed feedback laser diode (DFB-LD), vertical cavity surface emitting lasers (VCSEL), and the mid-infrared lasers including interband cascade lasers (ICL) and quantum cascade lasers (QCL), the characters are shown in Figure 3.
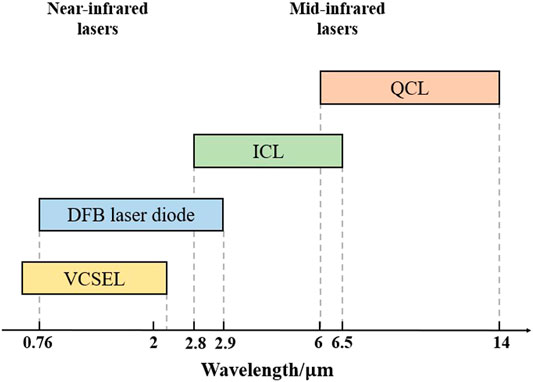
FIGURE 3. The characters of VCSEL, DFB laser diode, ICL, and QCL, according to the data from Nanoplus.
DFB-LD is a type of useful tunable diode laser that is operated on the principle of grating mode selection to get a specific wavelength depending on the Bragg gratings contained in the laser structure. The effective refractive index of the grating will be changed by temperature, leading to the change of output wavelength. Therefore, the tuning range of the DFB-LD is closely related to the effective refractive index of the grating material. In 1973, Nakamura et al. developed the first DFB laser, which achieved a narrow linewidth output near 830 nm [21]. However, the early GaAs DFB lasers have extremely high threshold conditions and need to operate at extremely low temperatures, making it difficult for large-scale applications [22]. In addition to GaAs, other III-VI group semiconductor materials, such as InP, can achieve longer output wavelength and are successfully achieved operation under low-temperature conditions (<0°C) [23]. Sakai et al. exploited the separate-confinement heterostructure to obtain a 1.5-μm continuous wavelength output that can operate continuously between −20°C and 58°C, with a threshold current as low as 50 mA at room temperature [24, 25]. Since then, the DFB laser’s application potential as a light source used for the optical sensors has been discovered. Morris et al. used graded-index separate-confinement heterostructure to achieve a 760 nm continuous single-mode tunable laser with a critical current of 25 mA, temperature tuning rate of 0.06 nm/°C, current tuning rate of 0.0075 nm/mA, and the tunable wavelength range is 4.2 nm, and successfully used for O2 detection [26]. Doussiere et al. designed a novel structure that integrates a relatively short distributed-Bragg grating near the output facet and a high reflectivity facet coating on the rear facet [27]. And they achieved the single-mode power over 200 mW at case temperature up to 60°C is consistently obtained for current below 300 mA.
DFB-LD is usually modulated by the current and temperature to control the range of output wavelength. Its tuning efficiency is closely related to the frequency of the driving current and the material of the laser diode, and it will have a great impact on the signal-to-noise ratio (SNR) and residual amplitude modulation. Sun J et al. found that tuning efficiency is affected by the different materials inside the DFB-LD, which is a robust parameter guiding us to choose favorable DFB-LD [28]. Since the injection current has a great influence on the internal temperature of the DFB-LD, which leads to the fluctuation of output wavelength range, suppressing the change of the internal temperature of the DFB-LD is beneficial to improve the sensitivity of the gas detection system [29]. Compared with traditional LD sources, the biggest advantage of DFB-LD is that it can be used in complex industrial environments and on-site detection. Wei Y et al. employed the 1.62 μm fiber-coupled DFB diode laser as the light source to achieve a ppm-level high sensitivity detecting system for the multi-point ethylene concentration detection, meeting the needs of fire warning in coal mine goafs [30]. Wang Z et al. chose the absorption line of water vapor at 1,368.5597 nm for detection and achieved the lowest detection limit of 790 ppb [31]. Using a single DFB diode laser emitting at 2.33 μm, Shao L et al. presented a spectrometer for constantly measuring atmospheric CO and CH4 [32]. According to the Allan variance, the respective minimum detection limits for CO and CH4 are 0.73 and 36 ppb at 122 s and 137 s.
Although the DFB-LD may provide extremely narrow laser output, the tuning range is limited; nevertheless, VCSEL compensates for this shortage. The VCSELs have good wavelength tunability and can achieve a tuning range of 10 cm−1 at a modulation frequency around 1 MHz. Soda H et al. proposed the concept of vertical cavity surface emission for the first time and obtained dynamic single longitudinal mode semiconductor lasers by shortening the cavity length [33]. And they successfully prepared the first VCSEL operated at 77 K, but its threshold current is as high as 0.9 A. Later, they further realized a pulsed VCSEL made of GaAs/GaAlAs. The threshold current under 77 K conditions was reduced to 350 μA, but the threshold current under room temperature conditions was 1.2 A [34]. K. Iga et al. developed a VCSEL that can operate continuously at room temperature in 1989. Since then, the advancement of VCSEL has ushered in a major turning point, with the technology progressing towards long wavelengths. The advent of the devices continuously operated at the wavelength of 1,310 nm and 1,550 nm under room temperature has greatly enriched the wavelength detection range of VCSELs [35, 36].
With the maturity of VCSELs, the excellent characteristics have become the focus of researchers in the field of gas sensing. Wang J et al. used the VCSEL with a wide current-tuning frequency range as the light source to detect oxygen in a high-pressure environment [37]. The wider tuning range enables VCSELs to obtain more spectral information and then realize the simultaneous detection of multiple gases with a single light source and the correction of gas concentration. Chen J et al. employed VCSEL to achieve simultaneous detection of CO and CH4 at 2.3 μm at an effective absorption path length of 20 cm, with detection accuracy reaching the ppm-level [38]. Wang Y et al. used a VCSEL with output wavelengths over the range from 1,682.7 nm to 1,685.7 nm achieving a detectable concentration of 300 ppm with relative errors below 5% is sufficient for successful early warning of propane leaks in the petrochemical and oil-gas storage and transportation industries [39]. At the same time, VCSELs have well-developed uses in the near-infrared region for detecting the concentrations of CO, CO2, CH4, and other typical gas. Chen J et al. achieved the first 2.3 µm VCSEL-based CO sensor. They employed an absorption cell with a 10 cm optical path length that can detect CO in 1 s with a ppm resolution [40]. And with the development of miniaturization, the VCSELs with a micro-electro-mechanical system(MEMS) capable of spans of 2–110 nm and repetition rates of 10–1,000 kHz, which successfully applied to the absorption spectroscopy detection of H2O and HF in the range of 1,321–1,354 nm [41].
Compared with the near-infrared band, the fundamental band of most gas molecules is mainly concentrated in the mid-infrared band. Therefore, many researchers are considering the use of tunable diode lasers in the mid-infrared band for trace gas detection to increase the SNR and sensitivity of the system. Theoretically, Lead salt diode lasers made from IV-VI semiconductor materials can operate in the 3–30 μm spectral region [42]. However, due to the structural of IV–VI materials, Lead salt diode lasers must work in cryogenic temperatures, and problems such as beam divergence, multi-mode competition, and low output power are not suitable for gas absorption spectroscopy detection [43]. The temperature properties and output light intensity of the telluride-based semiconductor laser are better than those of the lead salt laser, however, it is difficult to achieve a wavelength range of more than 5 μm [44, 45]. The appearance of Interband Cascade lasers (ICL) and Quantum Cascade lasers (QCL) ameliorates these problems. Different from the inter-band transition process of traditional semiconductor lasers, the laser generation process of QCLs only involves the conduction band and the electrons in it to achieve the inversion of the number of particles between different quantum well energy levels and radiate laser light. Based on this idea, Faist J et al. designed the first quantum cascade laser in 1994, with an output wavelength of about 4.2 μm, an output power of only 8.5 mW under 10 K conditions, and a threshold current density as high as 14 kA/cm2 [46]. In the following 20 years, the rapid development of QCLs has been achieved in terms of operating temperature, output performance, and wavelength coverage. In 1997, a DFB-QCL capable of working at room temperature was successfully developed. The output wavelengths were 5.4 and 8 μm respectively, and the former can achieve a peak power of 60 mW at 300 K [47]. In 2001, Faist J et al. further realized the QCL with an output wavelength of 9.1 μm, which operated continuously at room temperature, with an output power of 17 mW at 292 K and a maximum continuous operating temperature of 321 K [48].
With continuous improvement, QCLs have gradually become the most competitive light source in the mid-to-far infrared band and have shown extremely high application value in trace gas detection. Although long-wavelength devices still require low-temperature cooling, the continuous output within 16 μm could be achieved at room temperature, through the design of quantum wells [49], which are suitable for monitoring the greenhouse gases like CH4, NO, N2O. Kasyutich et al. used a continuous wave DFB-QCL and a single-pass absorption cell with an optical path length of only 21 cm to detect CO, N2O, and NO, with detection limits of 2.8, 0.6, and 2.7 ppm, respectively [50]. Using a novel compact MGC, Ren W et al. demonstrated the construction of a single-QCL based absorption sensor for the simultaneous detection of atmospheric CH4 and N2O at 7.8 μm. The detection limit of 5.9 ppb for CH4 and 2.6 ppb for N2O was achieved respectively, at the 1-s averaging time [51]. Maity et al. selected the absorption line of C2H2 at 1,311.76 cm−1 and achieved the lowest detection limit of the ppb level within the integration time of 110 s [52].
The electrons of ICLs could transition between the conduction and valence band, enabling semiconductor materials with a narrow bandgap to be used. Therefore, the wavelength range of ICLs is narrower, which makes up for the lack between traditional semiconductor diode lasers and QCLs. Yang et al. produced DFB-ICL with a single-mode lasing wavelength of 3.3 μm by introducing distributed feedback Bragg gratings, and its working temperature reached 175 K [53]. In 2006, under the temperature of 78 K, the continuous output power of ICL was increased to 1.1 W [54]. In the same year, under the adjustment of the temperature controller, the 3.3 μm ICL achieved continuous operation at a temperature of 264 K [55]. In 2013, Nanoplus provided 3–6 μm commercial ICLs. This wavelength region includes fundamental C-H, O-H, and N-H stretch vibrations [56–58] and it covers an important gap in wavelength coverage between diode lasers and QCLs. Song F et al. proposed the sensor system with a 3,291 nm ICL and a multi-pass gas cell with a 16 m optical path length. A limit of detection of ∼13.07 ppb with an averaging time of 2 s was achieved using the DSP-based digital lock-in amplifier (DLIA) and a limit of detection of ∼5.84 ppb was obtained using the LabVIEW-based DLIA with the same averaging time [59].
In general, among the above tunable lasers, it can be found that DFB-LD is suited for large-scale production applications. DFB-LD could operate at room temperature without the use of a complicated cooling device, and the line width could exceed 1 MHz. However, the tuning range of DFB-LD is small, and the absorption line strength in the near-infrared region is lower than mid-infrared, so it is difficult to achieve extremely sensitive detection results. VCSELs are cheap to produce, have a wide tuning range and low thresholds. As mid-infrared laser sources, QCL and ICL could achieve higher detection sensitivity. But these types of lasers are expensive and need to operate at low temperatures. They are therefore suitable for extremely high demands on detection results or for experimental exploration.
The Design of Effective Absorption Path
In absorption spectroscopy gas sensor detection, in addition to the selection of an appropriate light source, the design of an effective absorption path is also very important to improve the detection sensitivity and SNR of the system. According to the Beer-Lambert law, the effective interaction length of the laser energy and the gas sample has a significant effect on the absorption signal. In the traditional absorption spectroscopy gas sensing technology, a multipath absorption cell is often used to increase the effective absorption optical path. In 1942, White proposed a long optical path absorption cell composed of three concave mirrors with the same radius of curvature and named by his name [60]. Although the White cell achieves a long absorption path through multiple reflections between the mirrors, the design of this three-sided mirror makes the entire device bulky and the mirrors need to be strictly aligned. Herriott simplified the structure of the white cell and designed a new type of multi-optical path absorption cell [61]. The Herriott cell only retains two concave mirrors. The incident light enters the absorption cell through a hole of one mirror, and after multiple reflections in it, it exits from the same hole. Compared with White cell, the structure of the Herriott cell has been greatly simplified, and by adjusting the structure of the two mirrors, an effective absorption path of tens of meters to hundreds of meters can be achieved [62]. Although Herriott cell improves the problem to a certain extent, the structure of this kind of absorption cell is often complex to achieve a long absorption path. Moreover, once the optical path is fixed, the number of reflections cannot be changed and the effective absorption path cannot be flexibly adjusted. This is not conducive to practical engineering applications, so researchers have been exploring the miniaturization of multi-path absorption cells. Through the precise design of the absorption cell, the light spot covers the entire mirror surface as much as possible, although the path of a single absorption is not long, it can finally achieve long optical path absorption through hundreds of reflections [63]. To further improve the detection limit, this kind of multi-reflection long optical path absorption cell is gradually applied to the mid-infrared gas detection system and realizes the detection of C2H6, N2O, and CH4 at the ppb or even ppt level [62, 64, 65].
Based on the idea of multiple reflections, another cavity enhancement technique that combines the resonant characteristics of the optical resonator with the laser gain characteristics is designed to obtain a long absorption optical path. In 1998, O’Keefe and Engeln almost simultaneously proposed the technique to detect the integration of the light intensity passing through the resonant cavity [66, 67]. The method uses a semiconductor laser as a coherent light source, and uses a cavity mirror with high reflectivity to form a resonant cavity to achieve an extremely long effective absorption optical path, and detects the target gas by detecting the time-integrated light intensity passing through the cavity. Paul et al. proposed an off-axis incident cavity enhancement method considering the sensitivity in different environments [68]. This method effectively suppresses cavity mode noise by exciting more high-order transverse modes in the resonant cavity and has a simple optical structure and stronger adaptability to different conditions, so it is widely used in the field of gas detection. Barry et al. applied the integrated cavity to the study of methane near 1.73 μm using a tunable diode laser and achieved a detection sensitivity of 1.8 × 10⁻⁷ cm−1 for mirror reflectivities of 99.84% [69]. With the maturity of mid-infrared semiconductor lasers, more and more researchers have begun to combine them with cavity enhancement technique. Rao et al. used a quantum cascade laser with a tuning range of 1,601–1,670 cm−1 to detect the concentration of NO2, and the lowest detection limit improved to 28 ppt [70]. In a recent study, Mhanna et al. used a 3.3 μm DFB-ICL as the light source and obtained an effective absorption path length of 1.39 km through the off-axis incidence. They finally realized the detection of the ppt level of benzene vapor [71].
Signal Demodulation and Background Interference Suppression
The method for signal demodulation, as well as the suppression of background interference, plays a key role in enhancing the detection accuracy and sensitivity, in addition to selecting appropriate components for a gas detection system.
Signal Demodulation
A low-frequency scanning signal must be used to tune the tunable laser in scanned-wavelength direct absorption spectroscopy so that the modulated wavelength can sweep the characteristic absorption peak of the gas to be measured. However, in the detection of trace gases, weak signal changes are usually drowned out by background signals. Therefore, the output of the laser is usually divided into two paths, one as the signal and the other as the reference, and the signal generated by the gas absorption is extracted by the method of differential demodulation. The commonly used processing methods include subtraction, division, Balanced Ratiometric Detector (BRD), and the schematic diagrams of the three demodulation methods are shown in Figure 4.
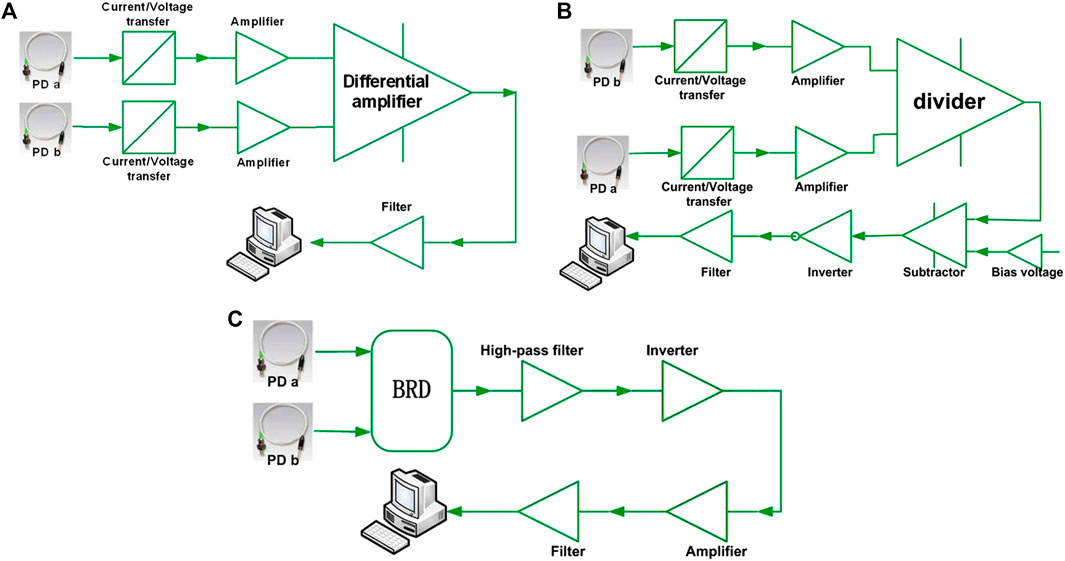
FIGURE 4. Schematic diagram of the (A) subtraction demodulation circuit (B) division demodulation circuit (C) BRD demodulation circuit.
In the subtractive demodulation algorithm, the light is divided into two paths through the coupler, one path does not pass through the gas cell and serves as the reference; the other is absorbed by the gas to be measured, and serves as the signal. The two signal lights are converted into current signals by the photodetector, and after gain amplification, enter the subtractor, and demodulate the absorption peak of the gas. Here we assumed the intensity of reference light
Then the output signal
In trace gas detection,
It can be seen that subtractive demodulation is greatly affected by the input light intensity. The principle of subtractive demodulation is simple and easy to operate. To determine the concentration of water vapor, Wang Q et al. devised a novel method based on the differential value of two adjacent absorption peaks [72]. Two absorption lines at 1,367.862 nm and 1,368.597 nm are selected to integrate the adjacent absorption peaks, the accuracy and resolution can reach to 20 and 10 ppm, respectively.
However, in actual detection or facing some harsh environments, the stability of the input optical power cannot be guaranteed, and the subtractive demodulation has certain problems. On this basis, dual-optical division demodulation has been developed. The structure of division demodulation is similar to that of subtraction. The biggest difference is that it used the division circuit to demodulate the absorbed signal. The reference signal and the detection signal can still be expressed as Eqs 1, 2. After the division operation, the output signal can be expressed as:
The initial intensity in the two signals are canceled out after the division operation, and the output signal is related with the concentration of the gas, theoretically eliminating the influence of input optical power fluctuations. Although the divider has a good suppression effect on the fluctuation of optical power, it is more suitable for eliminating the noise in the low-frequency range.
Although BRD is still a differential demodulation method, it can directly normalize the current signal output by the photodetector, avoiding the process of voltage transfer [73]. The voltage V at the output of the BRD system could be given by:
As mentioned above,
When weak absorption is applied to Eq. 7, the measured voltage is nearly proportional to absorbance and consequently V is proportional to concentration C. The working bandwidth of this method is affected by the photodetector, which can usually reach GHz. Sonnenfroh, Upschulte and the others [74, 75] explored and proved that the BRD can be applied to the gas absorption spectroscopy of tunable diode lasers. By adding matching resistors, Wang Q et al. improved the influence of conductivity mismatch on the measured absorption spectra. With the application of averaging and filtering, absorption sensitivity of 1.093 × 10⁻⁶ for water vapor at 1,368.597 nm has been demonstrated, and the corresponding concentration is 71.8 ppb in just a 10 cm path length [76]. Zhu C et al. comprehensively compared the three demodulation methods of subtraction, division, and BRD [77]. The division approach has a variance of only 0.29% when the ambient temperature varies by 1°C, which exceeds the subtraction method (2.90%) and the BRD method (0.55%).
As another important technique of TDLAS, wavelength-modulation spectroscopy has a very important impact on improving detection sensitivity. Wavelength modulated spectroscopy superposes high frequency modulated signal based on low-frequency scanning wave, which provides the possibility for the application of harmonic detection technique [78, 79]. In general, the system noise below 1 kHz is mainly 1/f noise. In the harmonic detection technique, each harmonic component carries the concentration information generated by gas absorption. After periodic modulation of a certain frequency by the laser, the signal could be moved to the relatively high-frequency area by the harmonic component, so that the 1/f noise can be effectively suppressed. However, not all harmonic components can effectively reflect gas concentration. With the number of harmonics increasing, the amplitude gradually decreases, and the amplitude of odd harmonics is zero at the center of the absorption line. Therefore, harmonic detection usually needs to be combined with the phase-locked amplification technique to achieve trace gas detection.
Phase-locked amplification is a commonly used weak signal detection technique. Through the two key steps of phase-sensitive detection and low-pass filtering [80], according to the frequency and phase of the signal to be measured, the DC component that carries the amplitude of the useful signal is extracted. Wei W et al. used wavelength modulation spectroscopy combined with signal–reference beam method for trace gas detection, which not only achieved common-mode noise suppression but also improved the SNR. The measurement accuracy of the system can reach 1 ppm for an optical path length of 10 cm verified by trace water vapor detection experiments [81]. Wang F et al. have expanded the functionality of the phase-locked amplification technique, which can accurately measure the phase information from the extremely weak signal. As shown in Figure 5A, hanging amplitudes and phases of the sinusoidal signals, a phase detection linearity of 0.99999 R-square is achieved by the phase demodulator. The output of low-pass filter SR1 and SR2 are shown in Figure 5B and the noises of the signals are shown in Figure 5C. Figure 5D is the noise levels comparison of phase detection. They achieved a resolution of better than ±0.005% in 0.99% O2 [82].
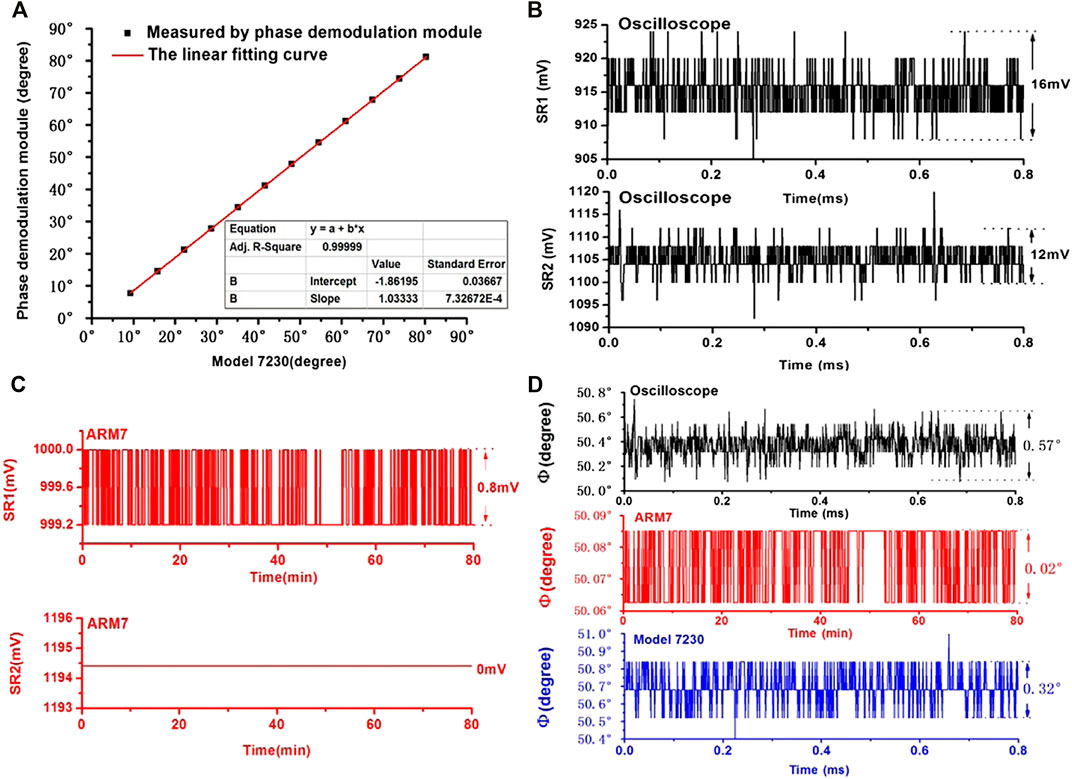
FIGURE 5. Functional verification of the phase demodulator. (A) Phase detection linearity. (B) Signals SR1, SR2. (C) Signals SR1, SR2 after 160,000 times of average algorithm. (D) Noise levels comparison of phase detection.
To further eliminate the influence of common-mode interference, researchers have proposed a method of normalizing the second harmonic signal using the first harmonic [83]. The influence such as light intensity fluctuations and random scattering in the optical path could be eliminated in this way. To eliminate the influence of light intensity fluctuations in wavelength modulation, Yang C et al. obtained gas concentration by measuring the first harmonic phase angle that is independent of light intensity [84]. This method has great potential in the applications of the WMS technique especially under high modulation frequencies or modulation-amplitude limited conditions. Roy et al. suggested a method in which the 1f WMS and 2f WMS signals are normalized by the linear and non-linear intensity modulation components, respectively [85]. With a single-pass detection limit of 3 ppb for CO (using 1f WMS and 4.05 m route length) and 45 ppb for CO2 (using 2f WMS and 20 cm path length), the system has an optimum integration time of 17 s and 69 s, respectively.
Background Interference Suppression
The main interference includes non-absorptive background caused by light dispersion, optical path loss, etc., and additional absorption background caused by device packaging or poor coupling.
Non-absorptive background fluctuations for gas detection systems, especially in low-concentration detection, will affect the output light intensity and seriously interfere with the final detection results. In order to eliminate this part of the impact, Wang F et al. proposed a demodulation algorithm based on the head-tail technique for single-beam water vapor detection under rough environmental conditions. The experiment indicates that, when the light power attenuates 4%, the deviation in a single-beam system is 1.29%, which is superior to a dual-beam subtraction system whose deviation is 8.45% [86]. Wei W et al. presented an artificial absorption peak technology, which created an artificial absorption peak of known concentration next to the real absorption peak without being overlapped. The artificial absorption peak technology can suppress the effect of non-absorption transmission losses and noise on the selection of potential reference points in the sensor system. The signal of the artificial absorption peak is added to the driving signal of the laser, and as shown in Figure 6, the reference points become easier to distinguish. When the non-absorption transmission losses change between 0 and 70%, measurement error reaches as low as 0.425% (0.17 ppm) with the DA method and 0.225% (0.09 ppm) with the WMS method [87].
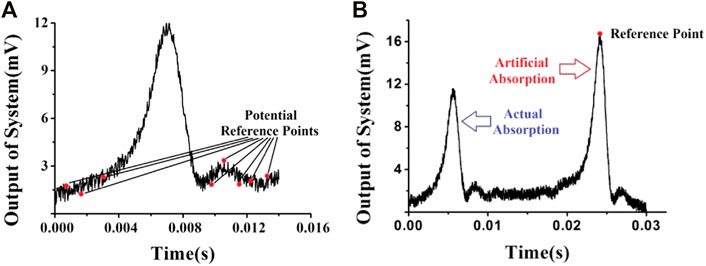
FIGURE 6. (A) Detected signal of a single absorption line with the DA method, revealing that noise increases the difficulty and uncertainty of the selection of the reference point. (B) Differential detection of the signals of two absorption peaks, one of which is artificial. By creating an artificial absorption peak next to the real absorption zone, the reference point becomes easier to distinguish.
A large part of the extra absorptive background interference comes from the background absorption in the free space inside the optoelectronic device. When detecting gases with high components in the atmosphere, such as oxygen, water vapor, and carbon dioxide, these gases would inevitably remain inside the device and become the background interference of the detection system. The signal received by the detector not only contains the absorption information of the gas to be measured but also carried the intrinsic absorption signal inside the device, which will have a great impact on the detection of trace gases. Wang Q et al. chose a strong absorption line near 1,368.6 nm for water vapor and designed a simple test to verify the existence of background absorption inside the optoelectronic device [88]. Zhu CG et al. also found the distortion of the absorption spectroscopy caused by the water vapor in the gap between the end faces of the optical elements [89]. Wang Q et al. proposed a method of reasonable recombination of the collimator and the PD to suppress the influence of background absorption in the system [76]. However, this method is cumbersome to operate due to the effect of the pairing of optoelectronic devices. Lv GP et al. combined the dual-beam differential method to achieve time-domain differential correction through optical switches, thereby suppressing the influence of water vapor inside the device [90]. Wang Y et al. directly used waterless optical components, combined with Herriot cell, to reduce the impact of background absorption from 726 to 25 ppm [39].
Combining with the above-improved methods, we summarize the detection sensitivity that the existing TDLAS system can achieve for gases with great application value, as shown in Table 1.
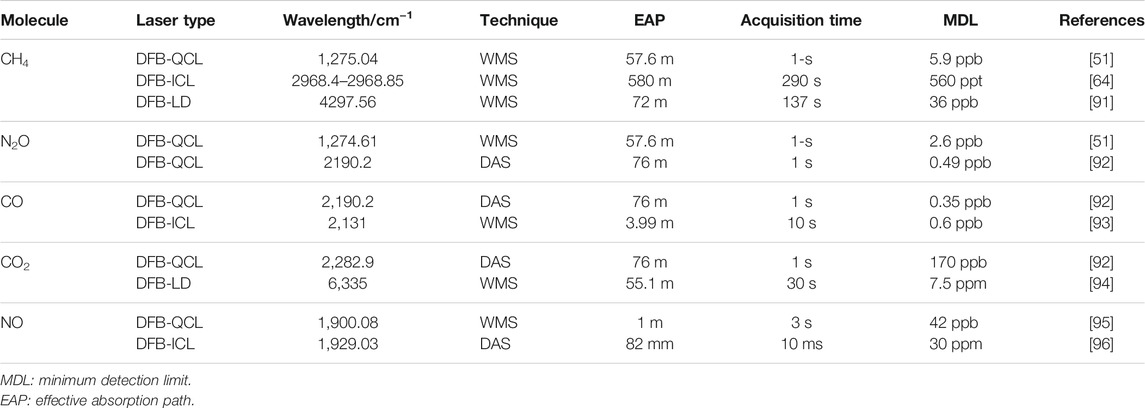
TABLE 1. Summary of TDLAS trace gas sensors or instruments.
The Hypothesis of the Sensitivity Limit
The sensitivity of the TDLAS system has always been an issue of concern to researchers, and a lot of work has been done to achieve the lowest limit. The most common one is to increase the length of the effective optical path. Through a variety of methods, the absorption optical path of tens or even hundreds of meters can be obtained to achieve ppb, ppt, or even lower detection limit. However, considering that there is always a limit to the number of low-state gas molecules. When a certain “threshold” is captured, the significance of continuing to improve the detection limit for practical research becomes quite limited.
According to the assumptions of quantum mechanics, atoms or molecules could only exist in specific quantum states, and each quantum state has discrete energy and angular momentum. For TDLAS, the energy of the molecule to be measured is also quantized. At room temperature, molecules are at the lowest state. Infrared absorption spectroscopy gas sensing involves the absorption of gas molecules caused by the transition from the ground state to the first or second excited state. Therefore, when discussing the detection sensitivity limit of a gas sensor system based on infrared absorption spectroscopy, the number of low-state gas molecules participating in the absorption should be considered. According to the Boltzmann distribution, we determine the number of molecules of the absorbed species on effective optical path for absorption, N:
Where
If there is only one low-state gas molecule in the effective optical path,
The lowest detection limit that the system can achieve under this condition is obtained when its absorption transition occurs, which is the “threshold” we mentioned. It can be seen that N will vary depending on absorbed species, specific absorption transition, and temperature T. To correlate N and the detection limit of TDLAS, we used integrated absorbance (IA). The IA under the condition of N is represented as:
Where
Sun J et al. analyzed the distribution of the number of gas molecules at low energy states, and combined with the integrated absorbance, proposed the concept of inherent limit (IL). They chose the R(76) line near 2,390.522470 cm−1 of CO2 and P(7) line near 2,115.628975 cm−1 of CO to explore IL at different temperatures and corresponding absorption. And they proposed a constructive method to change the IL [97].
Conclusion and Outlook
This paper reviews the important developments of TDLAS technology in recent years and the improvement of system detection sensitivity. With the improvement of the system structure and key processing devices; the innovation of data acquisition and signal processing technology, TDLAS has played a very important role in the online and real-time monitoring of gas concentration. The development of the semiconductor diode laser industry has enabled the laser wavelength to cover most of the spectral range, making TDLAS detection light sources more choices. Moreover, its capability of narrow linewidth and high-power output provides a basic guarantee for the improvement of the sensitivity and detection limit of the TDLAS system. With the improvement of the effective optical path, the TDLAS system is continuously developing towards miniaturization and portability while improving detection accuracy. Simultaneously, the optimization of data processing provides many new possibilities for TDLAS detection.
However, as an important indicator of the development of the TDLAS system, the increase in sensitivity will ultimately reach an ultra-limit, which is determined by the principle of gas infrared absorption. If the number of molecules in the low-state cannot meet the transition conditions, the infrared absorption will not occur, and the TDLAS system will not be able to detect the corresponding concentration information. Therefore, through the quantization analysis of the absorption process, this paper put forward and analyzed the hypothesis of the sensitivity limit of TDLAS technology, which has reference significance for future development.
Author Contributions
SL is responsible for the writing and conception of the overall content of this review paper. JS is responsible for investigation. JC and PX are responsible for correcting the details of the paper.
Conflict of Interest
Author PX was employed by Jinan Jingheng Electronics Co., Ltd.
The remaining authors declare that the research was conducted in the absence of any commercial or financial relationships that could be construed as a potential conflict of interest.
Publisher’s Note
All claims expressed in this article are solely those of the authors and do not necessarily represent those of their affiliated organizations, or those of the publisher, the editors and the reviewers. Any product that may be evaluated in this article, or claim that may be made by its manufacturer, is not guaranteed or endorsed by the publisher.
References
1. Sun H, Ma Y, He Y, Qiao S, Yang X, Tittel FK. Highly Sensitive Acetylene Detection Based on a Compact Multi-Pass Gas Cell and Optimized Wavelength Modulation Technique. Infrared Phys Techn (2019) 102:103012. doi:10.1016/j.infrared.2019.103012
2. Laj P, Klausen J, Bilde M, Plaß-Duelmer C, Pappalardo G, Clerbaux C, et al. Measuring Atmospheric Composition Change. Atmos Environ (2009) 43:5351–414. doi:10.1016/j.atmosenv.2009.08.020
3. Hanson RK. Applications of Quantitative Laser Sensors to Kinetics, Propulsion and Practical Energy Systems. Proc Combustion Inst (2011) 33:1–40. doi:10.1016/j.proci.2010.09.007
4. Hinkley ED. High‐resolution Infrared Spectroscopy with a Tunable Diode Laser. Appl Phys Lett (1970) 16:351–4. doi:10.1063/1.1653222
5. Ma Y, Hong Y, Qiao S, Lang Z, Liu X. H-shaped Acoustic Micro-resonator-based Quartz-Enhanced Photoacoustic Spectroscopy. Opt Lett (2022) 47(3):601–4. doi:10.1364/OL.449822
6. Ma Y, Hu Y, Qiao S, Lang Z, Liu X, He Y, et al. Quartz Tuning forks Resonance Frequency Matching for Laser Spectroscopy Sensing. Photoacoustics (2022) 25:100329. doi:10.1016/j.pacs.2022.100329
7. Wang Q, Wang Z, Zhang H, Jiang S, Wang Y, Jin W, et al. Dual-comb Photothermal Spectroscopy. Research Square (2021). [Preprint]. doi:10.21203/rs.3.rs-1106913/v103
8. Hu M, Hu M, Wang W, Wang Q. Wavelength-scanned All-Fiber Cavity Ring-Down Gas Sensing Using an L-Band Active Fiber Loop. Appl Phys B (2022) 128(2):1–7. doi:10.1007/s00340-022-07757-3
9. Liu X, Qiao S, Ma Y. Highly Sensitive Methane Detection Based on Light-Induced Thermoelastic Spectroscopy with a 2.33 µm Diode Laser and Adaptive Savitzky-Golay Filtering. Opt Express (2022) 30(2):1304–13. doi:10.1364/OE.446294
10. Liu X, Ma Y. Sensitive Carbon Monoxide Detection Based on Light-Induced Thermoelastic Spectroscopy with a Fiber-Coupled Multipass Cell [Invited]. Chin Opt Lett (2022) 20(3):031201. doi:10.3788/COL202220.031201
11. Magalhaes F, Carvalho JP, Ferreira LA, Araujo FM, Santos JL. Methane Detection System Based on Wavelength Modulation Spectroscopy and Hollow-Core Fibres. In: SENSORS, 2008 IEEE, Lecce, Italy, October 26–29, 2008 (2008). p. 1277–80. doi:10.1109/ICSENS.2008.4716677
12. Lu H, Zheng C, Zhang L, Liu Z, Song F, Li X, et al. A Remote Sensor System Based on TDLAS Technique for Ammonia Leakage Monitoring. Sensors (2021) 21(7):2448. doi:10.3390/s21072448
13. Pogány A, Ott O, Werhahn O, Ebert V. Towards Traceability in CO2 Line Strength Measurements by TDLAS at 2.7µm. J Quantitative Spectrosc Radiative Transfer (2013) 130:147–57. doi:10.1016/j.jqsrt.2013.07.011
14. Pogány A, Klein A, Ebert V. Measurement of Water Vapor Line Strengths in the 1.4-2.7 µm Range by Tunable Diode Laser Absorption Spectroscopy. J Quant Spectrosc Radiat Transf (2015) 165:108–22. doi:10.1016/j.jqsrt.2015.06.023
15. Meng Y, Liu T, Liu K, Jiang J, Wang T, Wang R, et al. Temperature and Pressure Measurement Based on Tunable Diode Laser Absorption Spectroscopy with Gas Absorption Line Width Detection. Proc SPIE (2014) 9274:927423. doi:10.1117/12.2073852
16. Ngo NH, Lisak D, Tran H, Hartmann JM. An Isolated Line-Shape Model to Go beyond the Voigt Profile in Spectroscopic Databases and Radiative Transfer Codes. J Quant Spectrosc Radiat Transf (2013) 129:89–100. doi:10.1016/j.jqsrt.2013.05.034
17. Jacquinet-Husson N, Scott NA, Chédin A, Crépeau L, Armante R, Capelle V, et al. The GEISA Spectroscopic Database: Current and Future Archive for Earth and Planetary Atmosphere Studies. J Quant Spectrosc Radiat Transf (2008) 109:1043–59. doi:10.1016/j.jqsrt.2007.12.015
18. Rothman LS, Gordon IE, Barber RJ, Dothe H, Gamache RR, Goldman A, et al. HITEMP, the High-Temperature Molecular Spectroscopic Database. J Quant Spectrosc Radiat Transf (2010) 111:2139–50. doi:10.1016/j.jqsrt.2010.05.001
19. Rothman LS, Gordon IE, Babikov Y, Barbe A, Chris Benner D, Bernath PF, et al. The HITRAN2012 Molecular Spectroscopic Database. J Quant Spectrosc Radiat Transf (2013) 130:4–50. doi:10.1016/j.jqsrt.2013.07.002
20. Mondelain D, Chelin P, Valentin A, Hurtmans D, Camy-Peyret C. Line Profile Study by Diode Laser Spectroscopy in the 12CH4 ν2+ν4 Band. J Mol Spectrosc (2005) 233:23–31. doi:10.1016/j.jms.2005.05.012
21. Nakamura M, Yariv A, Yen HW, Somekh S, Garvin HL. Optically Pumped GaAs Surface Laser with Corrugation Feedback. Appl Phys Lett (1973) 22:515–6. doi:10.1063/1.1654490
22. Streifer W, Burnham R, Scifres D. Effect of External Reflectors on Longitudinal Modes of Distributed Feedback Lasers. IEEE J Quan Electron. (1975) 11:154–61. doi:10.1109/JQE.1975.1068581
23. Mikami O. 1.55 µm GaInAsP/InP Distributed Feedback Lasers. Jpn J Appl Phys (1981) 20(7):L488–L490. doi:10.1143/JJAP.20.L488
24. Sakai K, Utaka K, Akiba S, Matsushima Y. 1.5 µm Range InGaAsP/InP Distributed Feedback Lasers. IEEE J Quan Electron. (1982) 18(8):1272–8. doi:10.1109/JQE.1982.1071682
25. Lee T-P. Recent Advances in Long-Wavelength Semiconductor Lasers for Optical Fiber Communication. Proc IEEE (1991) 79(3):253–76. doi:10.1109/5.75084
26. Morris NA, Connolly JC, Martinelli RU, Abeles JH, Cook AL. Single-mode Distributed-Feedback 761-nm GaAs-AlGaAs Quantum-Well Laser. IEEE Photon Technol Lett (1995) 7(5):455–7. doi:10.1109/68.384508
27. Doussiere P, Tashima M, Djie H, Lee KW, Wong V, Venables D, et al. 830nm High Power Single Mode DFB Laser for High Volume Applications. In: SPIE OPTO, San Francisco, CA (2012). p. 82770A. doi:10.1117/12.910238
28. Sun J, Chang J, Wang F, Zhang Q, Wang Z, Xie Y, et al. Tuning Efficiency of Distributed Feedback Laser Diode for Wavelength Modulation Spectroscopy. IEEE Sensors J (2019) 19:9722–7. doi:10.1109/JSEN.2019.2927043
29. Xie Y, Chang J, Chen X, Sun J, Zhang Q, Wang F, et al. A DFB-LD Internal Temperature Fluctuation Analysis in a TDLAS System for Gas Detection. IEEE Photon J. (2019) 11:1–8. doi:10.1109/JPHOT.2019.2916800
30. Wei Y, Chang J, Lian J, Liu T. A Coal Mine Multi-point Fiber Ethylene Gas Concentration Sensor. Photonic Sens (2015) 5:67–71. doi:10.1007/s13320-014-0206-z
31. Wang Z, Chang J, Liu Q, Tian C, Zhang Q. Gas Absorption center-based Wavelength Calibration Technique in QEPAS System for SNR Improvement. Photonic Sens (2018) 8:358–66. doi:10.1007/s13320-018-0502-0
32. Shao L, Fang B, Zheng F, Qiu X, He Q, Wei J, et al. Simultaneous Detection of Atmospheric CO and CH4 Based on TDLAS Using a Single 2.3 μm DFB Laser. Spectrochim Acta A: Mol Biomol Spectrosc (2019) 222:117118. doi:10.1016/j.saa.2019.05.023
33. Soda H, Iga K-i., Kitahara C, Suematsu Y. GaInAsP/InP Surface Emitting Injection Lasers. Jpn J Appl Phys (1979) 18(12):2329–30. doi:10.1143/JJAP.18.2329
34. Iga K, Ishikawa S, Ohkouchi S, Nishimura T. Room‐temperature Pulsed Oscillation of GaAlAs/GaAs Surface Emitting Injection Laser. Appl Phys Lett (1984) 45(4):348–50. doi:10.1063/1.95265
35. Baba T, Yogo Y, Suzuki K, Koyama F, Iga K. Near Room Temperature Continuous Wave Lasing Characteristics of GaInAsP/InP Surface Emitting Laser. Electron Lett (1993) 29(10):913–4. doi:10.1049/el:19930609
36. Uomi K, Yoo SJB, Scherer A, Bhat R, Andreadakis NC, Zah CE, et al. Low Threshold, Room Temperature Pulsed Operation of 1.5 μm Vertical-Cavity Surface-Emitting Lasers with an Optimized Multi-Quantum Well Active Layer. IEEE Photon Technol Lett (1994) 6(3):317–9. doi:10.1109/68.275476
37. Wang J, Sanders ST, Jeffries JB, Hanson RK. Oxygen Measurements at High Pressures with Vertical Cavity Surface-Emitting Lasers. Appl Phys B (2001) 72:865–72. doi:10.1007/s003400100539
38. Chen J, Hangauer A, Bachmann A, Lim T, Kashani K, Strzoda R, et al. CO and CH4 Sensing with Single Mode 2.3 μm GaSb-Based VCSEL. In: Conference on Lasers and Electro-Optics, Baltimore, MD, May 31–June 5, 2009 (2009). p. CThI2. doi:10.1364/CLEO.2009.CThI2
39. Wang Y, Wei Y, Chang J, Zhang T, Liu T, Sun T, et al. Tunable Diode Laser Absorption Spectroscopy- Based Detection of Propane for Explosion Early Warning by Using a Vertical Cavity Surface Enhanced Laser Source and Principle Component Analysis Approach. IEEE Sensors J (2017) 17(15):4975–82. doi:10.1109/JSEN.2017.2713769
40. Chen J, Hangauer A, Strzoda R, Amann M-C. VCSEL-based Calibration-free Carbon Monoxide Sensor at 2.3 μm with In-Line Reference Cell. Appl Phys B (2011) 102:381–9. doi:10.1007/s00340-010-4011-0
41. Stein BA, Jayaraman V, Jiang JY, Cable A, Sanders ST. Doppler-limited H2O and HF Absorption Spectroscopy by Sweeping the 1,321-1,354 Nm Range at 55 kHz Repetition Rate Using a Single-Mode MEMS-Tunable VCSEL. Appl Phys B (2012) 108:721–5. doi:10.1007/s00340-012-5135-1
42. Tacke M. New Developments and Applications of Tunable IR lead Salt Lasers. Infrared Phys Techn (1995) 36:447–63. doi:10.1016/1350-4495(94)00101-p
43. Werle P, Slemr F, Gehrtz M, Bräuchle C. Quantum-limited FM-spectroscopy with a lead-salt Diode Laser. Appl Phys B (1989) 49(2):99–108. doi:10.1007/BF00332268
44. Nicolas J-C, Baranov AN, Cuminal Y, Rouillard Y, Alibert C. Tunable Diode Laser Absorption Spectroscopy of Carbon Monoxide Around 235 μm. Appl Opt (1998) 37(33):7906–11. doi:10.1364/AO.37.007906
45. Hasenberg TC, Miles RH, Kost AR, West L. Recent Advances in Sb-Based Midwave-Infrared Lasers. IEEE J Quan Electron. (1997) 33:1403–6. doi:10.1109/3.605563
46. Faist J, Capasso F, Sivco DL, Sirtori C, Hutchinson AL, Cho AY. Quantum cascade Laser. Science (1994) 264(5158):553–6. doi:10.1126/science.264.5158.553
47. Faist J, Gmachl C, Capasso F, Sirtori C, Sivco DL, Baillargeon JN, et al. Distributed Feedback Quantum cascade Lasers. Appl Phys Lett (1997) 70:2670–2. doi:10.1063/1.119208
48. Faist J, Beck M, Aellen T, Gini E Quantum-cascade Lasers Based on a Bound-To-Continuum Transition. Appl Phys Lett (2001) 78:147–9. doi:10.1063/1.1339843
49. Capasso F. High-performance Midinfrared Quantum cascade Lasers. Opt Eng (2010) 49:111102. doi:10.1117/1.3505844
50. Kasyutich VL, Holdsworth RJ, Martin PA. Mid-infrared Laser Absorption Spectrometers Based upon All-Diode Laser Difference Frequency Generation and a Room Temperature Quantum cascade Laser for the Detection of CO, N2O and NO. Appl Phys B (2008) 92:271–9. doi:10.1007/s00340-008-3097-0
51. Ren W, Jiang W, Tittel FK. Single-QCL-based Absorption Sensor for Simultaneous Trace-Gas Detection of CH4 and N2O. Appl Phys B (2014) 117:245–51. doi:10.1007/s00340-014-5828-8
52. Maity A, Pal M, Maithani S, Banik GD, Pradhan M. Wavelength Modulation Spectroscopy Coupled with an External-Cavity Quantum cascade Laser Operating between 7.5 and 8 µm. Laser Phys Lett (2018) 15(4):045701. doi:10.1088/1612-202X/aaa61a
53. Yang RQ, Hill CJ, Yang BH, Wong CM, Muller RE, Echternach PM. Continuous-wave Operation of Distributed Feedback Interband cascade Lasers. Appl Phys Lett (2004) 84:3699–701. doi:10.1063/1.1738184
54. Canedy CL, Bewley WW, Lindle JR, Kim CS, Kim M, Vurgaftman I, et al. High-power and High-Efficiency Midwave-Infrared Interband cascade Lasers. Appl Phys Lett (2006) 88:161103. doi:10.1063/1.2195778
55. Mansour K, Qiu Y, Hill CJ, Soibel A, Yang RQ. Mid-infrared Interband cascade Lasers at Thermoelectric Cooler Temperatures. Electron Lett (2006) 42(18):1034–5. doi:10.1049/el:20062442
56. Ren W, Luo L, Tittel FK. Sensitive Detection of Formaldehyde Using an Interband cascade Laser Near 3.6 μm. Sensors Actuators B: Chem (2015) 221:1062–8. doi:10.1016/j.snb.2015.07.078
57. Ye W, Li C, Zheng C, Sanchez NP, Gluszek AK, Hudzikowski AJ, et al. Mid-infrared Dual-Gas Sensor for Simultaneous Detection of Methane and Ethane Using a Single Continuous-Wave Interband cascade Laser. Opt Express (2016) 24:16973. doi:10.1364/OE.24.016973
58. Li C, Dong L, Zheng C, Lin J, Wang Y, Tittel F. Ppbv-level Ethane Detection Using Quartz-Enhanced Photoacoustic Spectroscopy with a Continuous-Wave, Room Temperature Interband cascade Laser. Sensors (2018) 18:723. doi:10.3390/s18030723
59. Song F, Zheng C, Yu D, Zhou Y, Yan W, Ye W, et al. Interband cascade Laser-Based Ppbv-Level Mid-infrared Methane Detection Using Two Digital Lock-In Amplifier Schemes. Appl Phys B (2018) 124:124. doi:10.1007/s00340-018-6916-y
60. White JU. Long Optical Paths of Large Aperture. J Opt Soc Am (1942) 32:285. doi:10.1364/JOSA.32.000285
61. Herriott DR, Schulte HJ. Folded Optical Delay Lines. Appl Opt (1965) 4(8):883–9. doi:10.1364/AO.4.000883
62. Li C, Dong L, Zheng C, Tittel FK. Compact TDLAS Based Optical Sensor for Ppb-Level Ethane Detection by Use of a 3.34 μm Room-Temperature CW Interband cascade Laser. Sensors Actuators B: Chem (2016) 232:188–94. doi:10.1016/j.snb.2016.03.141
63. Liu K, Wang L, Tan T, Wang G, Zhang W, Chen W, et al. Highly Sensitive Detection of Methane by Near-Infrared Laser Absorption Spectroscopy Using a Compact Dense-Pattern Multipass Cell. Sensors Actuators B: Chem (2015) 220:1000–5. doi:10.1016/j.snb.2015.05.136
64. Xia J, Feng C, Zhu F, Ye S, Zhang S, Kolomenskii A, et al. A Sensitive Methane Sensor of a Ppt Detection Level Using a Mid-infrared Interband cascade Laser and a Long-Path Multipass Cell. Sensors Actuators B: Chem (2021) 334:129641. doi:10.1016/j.snb.2021.129641
65. Shen F, Akil J, Wang G, Poupin C, Cousin R, Siffert S, et al. Real-time Monitoring of N2O Production in a Catalytic Reaction Process Using Mid-infrared Quantum cascade Laser. J Quant Spectrosc Radiat Transf (2018) 221:1–7. doi:10.1016/j.jqsrt.2018.09.022
66. Engeln R, Berden G, Peeters R, Meijer G. Cavity Enhanced Absorption and Cavity Enhanced Magnetic Rotation Spectroscopy. Rev Scientific Instr (1998) 69:3763–9. doi:10.1063/1.1149176
67. O'Keefe A. Integrated Cavity Output Analysis of Ultra-weak Absorption. Chem Phys Lett (1998) 293:331–6. doi:10.1016/S0009-2614(98)00785-4
68. Paul JB, Lapson L, Anderson JG. Ultrasensitive Absorption Spectroscopy with a High-Finesse Optical Cavity and off-axis Alignment. Appl Opt (2001) 40:4904–10. doi:10.1364/ao.40.004904
69. Barry HR, Corner L, Hancock G, Peverall R, Ritchie GAD. Cavity-enhanced Absorption Spectroscopy of Methane at 1.73 μm. Chem Phys Lett (2001) 333(3-4):285–9. doi:10.1016/S0009-2614(00)01388-9
70. Rao GN, Karpf A. Extremely Sensitive Detection of NO2 Employing off-axis Integrated Cavity Output Spectroscopy Coupled with Multiple-Line Integrated Absorption Spectroscopy. Appl Opt (2011) 50:1915–24. doi:10.1364/AO.50.001915
71. Mhanna M, Zhang G, Kunnummal N, Farooq A. Cavity-enhanced Measurements of Benzene for Environmental Monitoring. IEEE Sensors J (2021) 21:3849–59. doi:10.1109/JSEN.2020.3026981
72. Wang Q, Chang J, Zhu C-G, Li C, Song F-J, Liu Y-N, et al. Detection of Water Vapor Concentration Based on Differential Value of Two Adjacent Absorption Peaks. Laser Phys Lett (2012) 9:421–5. doi:10.7452/lapl.201210015
73. Hobbs PCD. Shot Noise Limited Optical Measurements at Baseband with Noisy Lasers (Proceedings Only). In: Advances in Intelligent Robotics System, Boston, MA, 1990 (1991). p. 1376. doi:10.1117/12.25014
74. Sonnenfroh DM, Allen MG. Ultrasensitive, Visible Tunable Diode Laser Detection of NO2. Appl Opt (1996) 35(21):4053–8. doi:10.1364/AO.35.004053
75. Upschulte B, Allen M, Upschulte B, Allen M. Diode Laser Measurements of Line Strengths and Self-Broadening Parameters of Water Vapor between 300 and 1100 K Near 1.31 Micron. In: 35th Aerospace Sciences Meeting and Exhibit, Reno, NV, January 6–9, 1997 (1997). p. 319. doi:10.2514/6.1997-319
76. Wang Q, Chang J, Zhu C, Liu Y, Lv G, Wang F, et al. High-sensitive Measurement of Water Vapor: Shot-Noise Level Performance via a Noise Canceller. Appl Opt (2013) 52:1094. doi:10.1364/AO.52.001094
77. Zhu C, Chang J, Wang P, Wang W, Wang Q, Liu Y, et al. Reliability Analysis and Comparison of Demodulation Methods for Dual-Beam Wavelength-Modulation Spectroscopy Water Vapor Detection. Appl Opt (2013) 52:4171. doi:10.1364/AO.52.004171
78. Che L, Ding Y-J, Peng Z-M, Li X-H. Calibration-free Wavelength Modulation Spectroscopy for Gas Concentration Measurements under Low-Absorbance Conditions. Chin Phys. B (2012) 21:127803–70. doi:10.1088/1674-1056/21/12/127803
79. Yin S, Liu Y, Dong T. Trace Gas Detect Based on Spectral Analysis and Harmonic Ratio. Opt Rev (2020) 27:304–11. doi:10.1007/s10043-020-00597-6
80. Aguirre J, Medrano N, Calvo B, Celma S. Lock-in Amplifier for Portable Sensing Systems. Electron Lett (2011) 47(21):1172–3. doi:10.1049/el.2011.2472
81. Wei W, Chang J, Huang Q, Zhu C, Wang Q, Wang Z, et al. Wavelength Modulation Spectroscopy with Signal-Reference Beam Method for Highly Sensitive Gas Detection. Appl Phys B (2015) 118:75–83. doi:10.1007/s00340-014-5956-1
82. Wang F, Chang J, Chen X, Wang Z, Wang Q, Wei Y, et al. Optical Fiber Oxygen Sensor Utilizing a Robust Phase Demodulator. Measurement (2017) 95:1–7. doi:10.1016/j.measurement.2016.09.022
83. Rieker GB, Jeffries JB, Hanson RK. Calibration-free Wavelength-Modulation Spectroscopy for Measurements of Gas Temperature and Concentration in Harsh Environments. Appl Opt (2009) 48:5546–60. doi:10.1364/AO.48.005546
84. Yang C, Mei L, Deng H, Xu Z, Chen B, Kan R. Wavelength Modulation Spectroscopy by Employing the First Harmonic Phase Angle Method. Opt Express (2019) 27:12137. doi:10.1364/OE.27.012137
85. Roy A, Chakraborty AL. Intensity Modulation-Normalized Calibration-free 1f and 2f Wavelength Modulation Spectroscopy. IEEE Sensors J (2020) 20:12691–701. doi:10.1109/JSEN.2020.3000470
86. Wang F, Chang J, Zhu C, Wang Z, Liu Y, Wei W, et al. Demodulation Algorithm Used in Single-Beam System Immune to Light Power Drift. Appl Opt (2015) 54:2032–8. doi:10.1364/AO.54.002032
87. Wei W, Chang J, Cao L, Liu Y, Chen X, Zhu C, et al. Artificial Absorption Creation for More Accurate Tunable Diode Laser Absorption Spectroscopy Measurement. Opt Commun (2017) 399:112–9. doi:10.1016/j.optcom.2017.04.052
88. Wang Q, Chang J, Song F, Wang F, Zhu C, Liu Z, et al. Measurement and Analysis of Water Vapor inside Optical Components for Optical Fiber H2O Sensing System. Appl Opt (2013) 52(26):6445–51. doi:10.1364/AO.52.006445
89. Zhu CG, Chang J, Wang PP, Sun BN, Wang Q, Wei W, et al. Improvement of Measurement Accuracy of Infrared Moisture Meter by Considering the Impact of Moisture inside Optical Components. IEEE Sensors J (2014) 14:920–5. doi:10.1109/JSEN.2013.2291033
90. Lv GP, Chang J, Huang QJ, Wang QP, Wang Q, Wang ZL. Suppressing the Impact of Water Vapor inside Optical Components for Optical Fiber H2O Sensing System. Opt Quant Electron (2015) 47:663–72. doi:10.1007/s11082-014-9942-y
91. Shao L, Fang B, Zheng F, Qiu X, He Q, Wei J, et al. Simultaneous Detection of Atmospheric CO and CH4 Based on TDLAS Using a Single 2.3 μm DFB Laser. Spectrochim Acta A Mol Biomol Spectrosc (2019) 222:117118. doi:10.1016/j.saa.2019.05.023
92. Hundt PM, Tuzson B, Aseev O, Liu C, Scheidegger P, Looser H, et al. Multi-species Trace Gas Sensing with Dual-Wavelength QCLs. Appl Phys B (2018) 124:124. doi:10.1007/s00340-018-6977-y
93. Ghorbani R, Schmidt FM. ICL-based TDLAS Sensor for Real-Time Breath Gas Analysis of Carbon Monoxide Isotopes. Opt Express (2017) 25:12743. doi:10.1364/OE.25.012743
94. Li C, Shao L, Jiang L, Qiu X, Wei J, Ma W. Simultaneous Measurements of CO and CO2 Employing Wavelength Modulation Spectroscopy Using a Signal Averaging Technique at 1.578 μm. Appl Spectrosc (2018) 72:1380–7. doi:10.1177/0003702818766904
95. Cui H, Wang F, Huang Q, Yan J, Cen K. Sensitive Detection of NO Using a Compact Portable CW DFB-QCL-Based WMS Sensor. Appl Opt (2020) 59:9491–8. doi:10.1364/AO.402484
96. Diemel O, Pareja J, Dreizler A, Wagner S. An Interband cascade Laser-Based In Situ Absorption Sensor for Nitric Oxide in Combustion Exhaust Gases. Appl Phys B (2017) 123:123. doi:10.1007/s00340-017-6741-8
Keywords: TDLAS, trace gas sensing, infrared absorption spectroscopy, tunable diode lasers, detection sensitivity, quantization
Citation: Lin S, Chang J, Sun J and Xu P (2022) Improvement of the Detection Sensitivity for Tunable Diode Laser Absorption Spectroscopy: A Review. Front. Phys. 10:853966. doi: 10.3389/fphy.2022.853966
Received: 13 January 2022; Accepted: 08 February 2022;
Published: 01 March 2022.
Edited by:
Yufei Ma, Harbin Institute of Technology, ChinaReviewed by:
Qiang Wang, Changchun Institute of Optics, Fine Mechanics and Physics (CAS), ChinaCunguang Zhu, Liaocheng University, China
Wei Wei, Los Alamos National Laboratory (DOE), United States
Copyright © 2022 Lin, Chang, Sun and Xu. This is an open-access article distributed under the terms of the Creative Commons Attribution License (CC BY). The use, distribution or reproduction in other forums is permitted, provided the original author(s) and the copyright owner(s) are credited and that the original publication in this journal is cited, in accordance with accepted academic practice. No use, distribution or reproduction is permitted which does not comply with these terms.
*Correspondence: Jun Chang, Y2hhbmdqdW5Ac2R1LmVkdS5jbg==