- 1Institute of Glass and Ceramics, Friedrich-Alexander University Erlangen-Nürnberg, Erlangen, Germany
- 2Coherent Munich GmbH & Co. KG, Gilching, Germany
Utilizing ultra-short-pulse laser filamentation of glass is one of the latest developed techniques to cut glass. In comparison with other techniques the superior benefits are a small heat-affected zone, a quasi-non-gap cut, and the possibility to free from cut. However, despite the large interest in the laser/glass interaction for various laser sources and pulse durations, the process of cleaving and the underlying mechanisms are fairly undescribed. In this study, we utilized a Nd:YAG laser with an average power of 100 W, a center wavelength of 1,064 nm, and a pulse duration of 12 ps via a specially designed optic to generate laser filamentation in soda-lime- and borosilicate glass with varying Pitch and Burst parameters. The filaments and cut edge are analyzed with scanning electron- and laser scanning microscopy to study the topological phenomena and roughness. Photoelastic measurements were done to assess the stress distribution within the glass and show cumulative interactions at the filament extremity. From the observations made, phenomenological models are proposed to describe the initial micro crack formation considering the shock wave and thermal influence caused by the laser pulses. Two types of micro cracks are identified, with radial cracks passing through the filament and bypass cracks that form around the laser-affected zone. Models are elaborated for both glass types to evaluate the influence of a parameter change on the micro crack formation and the cleaving guidance. The different behavior between soda-lime- and borosilicate glass, with their distinct physical properties, helps to interpret the influence of laser parameters on the micro crack formation and the cleaving guidance.
1 Introduction
In our modern society technical applications, products and devices have an immense impact and define our everyday life in a vast range. Product design has become a key-factor in nearly every sector of modern technical consumer products. Not only has the product to be functional and fulfill its intended technical purpose, but also it has to be appealing to the customer in a visual and tactile way. Especially, in the last few years, the designs of technical glass products have changed to complex, often rounded shapes to meet these design demands that can be noticed for example at handheld devices, smart watches, cover glass for displays in automotive sector, and many more. To manufacture such glass products conventional cutting with scribe and break reaches its limits and new processing techniques have to be established which meet the requirements and serve the rising demand. Ultra-short-pulse laser processing is a relatively new technique for material processing and is extensively developed [1–7]. The high-energy input evokes nonlinear effects that introduce filamentary propagation along the glass thickness leaving a thread-like damage. A consecutive trail of laser modifications is scribed along a desired geometry and is cleaved by applying mechanical force or thermal-induced stress. Owing to the short pulse width, the energy that modifies the material is deposited highly localized with a rather small heat-affected zone. Next to that a practical non-gap cut can be achieved as no grooves are introduced at the surfaces, which is beneficial to obtain a homogenous cut edge without large-scale chipping and therefore to give high mechanical strength to the final product [8]. It is possible to free-form cut glass with small radii and undercuts, which is restricted in other cutting techniques. Despite the large research interest in the past few years, further development and research is needed as the process has a large parameter window that can be adjusted to fit to a specific glass or cut geometry. While the generation, origin, and evolution of laser modifications during the pulse/time-scale and the cleaving strength have driven most of the attention, the crack formation mechanisms at the microscale between the modified regions were not described in detail, until now. It is the aim of this article to assess the sensitivity to certain parameters, i.e., Burst and Pitch, and to conclude general rules and guidelines of the underlying mechanisms. As an outcome, several schematic models for the laser/glass interaction and crack formation are established. The input data were assessed with high-resolution surface analysis, e.g., SEM and LSM as well as measurements using photoelasticity to study the stress distribution within the glass.
2 Laser Processing of Soda-Lime-Silicate and Borosilicate Float Glass
Commercially available soda-lime-silicate glass OptiWhite™ in 1.85 and 1.1 mm thickness (Pilkington Ltd./NSG Co. Ltd./Tokyo, Japan; Composition [mol%]: 71.33 SiO2, 12.37 Na2O, 9.25 CaO, 6.29 MgO, 0.35 Al2O3, 0.25 K2O, 0.15 SO3, 0.01 Fe2O3) and borosilicate glass Borofloat 3.3™ in 1.0 mm thickness (Schott AG/Mainz, Germany; Composition [mol%]: 83.37 SiO2, 11.04 B2O3, 3.51 Na2O, 0.06 CaO, 0.11 MgO, 1.53 Al2O3, 0.39 K2O) were used as sample materials. The compositions were determined by utilizing inductively coupled plasma optical emission spectrometry (ICP-OES) and wet chemical gravimetric determination methods. A HyperRapid NX laser source (Coherent Inc./Santa Clara, United States) with an average power of 100 W, 1,064 nm wavelength, and a pulse duration of 12 ps in combination with a specially designed SmartCleave™ optic, which produces an elongated focus facilitating filament generation, was used for sample preparation. The focus position was set to 300 µm below the Focus-Side for each sample in the same plane, considering the thickness and the index of refraction to avoid any changes from the material focus shift (see Figure 1). The vertical axis has an accuracy of ±30 µm and once the focus position was set for each material, the preparation process of the full sample set was done in one run to avoid focus errors due to play in the stage axis. Three Burst settings with a descending pulse ramp, consisting of either two, three, or four pulses with a time distance of 24 ns between consecutive pulses, were used. The variation in the Burst is accompanied by a change in repetition rate (Burst 2 = 240 kHz; Burst 3 = 185 kHz; Burst 4 = 155 kHz) and subsequently a change in energy. The energy of the first pulse is set equal for all Burst settings at 109.0 µJ. The energies of the following pulses, determined at 2nd = 73.92 µJ, 3rd = 55.46 µJ, and 4th = 47.43 µJ, are adding up to the total deposited energy following the Burst number. The pulse energies were calculated considering the repetition rate and power output of the laser measured with a thermal power meter, resulting in an accuracy of 0.1 µJ. The energy was checked before and after sample processing and did not show variation above the measurement precision. The fluence of the first pulse was determined with 138.8 J/cm2 and exceeds the ablation threshold for OptiWhite™ = 9.54 J/cm2 and Borofloat 3.3™ = 9.40 J/cm2 significantly, hence evoking nonlinear effects [9]. Therefore, the first pulse is expected to be primarily responsible for the initial plasma formation, whereas the following pulses, which are still far above the ablation threshold, interact with an already preexcited material and keep the plasma persisting for a longer time [10, 11]. This portion-wise and cumulative deposition of energy by consecutive pulses happens to add to the process of material modification [11]. Filament-to-filament distance (Pitch) was varied with 2, 5, and 7 µm by adjusting the movement of the X/Y-stage according to the repetition rate of the Burst. The spatial precision of the stage was validated by taking the mean above more than 100 filaments. To maintain reasonable and executable moving speeds of the X/Y-stage, a pulse picker was utilized to only use every 10th pulse package, i.e., Burst, for filamentation, therefore keeping the energies of any original pulse unaffected. Two sample series were generated where either a Pitch of 5 µm or a Burst 4 was kept constant to allow observations related to the evolution of only one parameter. As an outcome five parameter combinations are obtained for OptiWhite™ 1.1 mm and Borofloat 3.3™ 1.0 mm: Burst 4/Pitch2, Burst 4/Pitch 5, Burst 4/Pitch 7, Burst 3/Pitch 5, and Burst 2/Pitch 5. For OptiWhite™ 1.85 mm only one setting with Burst 4/Pitch 5 was investigated for the sake of comparison within a glass system. Several glass tiles of each specific parameter set with a total size 200 mm × 150 mm and subdivided by fourteen segments with 10 mm width and 50 mm length were produced. The sample layout allows studying the resulting properties of a filament cut glass. Eventually, these segments were separated manually with cleaving initiation via the Entry-Side to obtain the samples for the various investigation methods with similar conditions. The color code and symbols belonging to each series, as well as the scales in the graphs, were adjusted accordingly to maintain comparability between the various characterization methods.
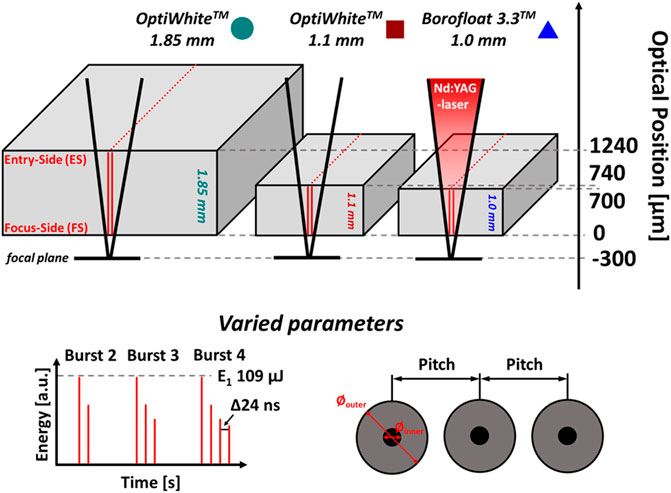
FIGURE 1. Schematic drawing defining the nomenclature and abbreviations. Turquoise dots ≙ OptiWhite™ 1.85 mm, Bordeaux red squares ≙ OptiWhite™ 1.1 mm, blue triangles ≙ Borofloat 3.3™ 1.0 mm. Red lines and dots indicate laser filament orientation and location. The focal plane was set constant 300 µm below the Focus-Side (FS). The “optical position” on the right indicates the location of the corresponding surface considering the index of refraction (gray dashed lines are guide to the eye). At the bottom an explanation of the varied parameters is shown: variation of the pulses/filament, i.e., Burst (left); filament to filament distance, i.e., Pitch (right). This figure is adapted from “Figure 1” by [8] licensed under CC BY 4.0 [8] https://doi.org/10.1002/adem.202000471.
3 Experimental Methods
3.1 SEM Observation at the Air/Glass Boundary and Cut Edge
To examine the surface modifications generated by the filamentation process, both Entry- and Focus-Side were observed via SEM (Quanta 200/FEI, Waltham, United States). To avoid artifacts, the samples were sputter coated with gold before imaging. To determine the thickness of the Au-layer, a plain glass slide was partially covered with scotch tape and sputter coated with the same parameters. After the coating the scotch tape was removed and the difference in height between pristine and coated glass was measured with the LSM at 40 ± 5 nm. As the Au-layer is thin in comparison with the observed features, no influence or significant alteration of the results is expected. Owing to the high resolution of the SEM the surface modifications were resolved exactly and the width of the outer diameter as well as the inner diameter could be analyzed very precisely (see Figure 1). The images were obtained from the cut edge to observe the phenomena from the cross section in high resolution to maintain a maximum visibility of details.
3.2 Evaluation of the Cut Edge Condition and Height Profile of Surface Modifications
To investigate the cut edge, laser scanning microscopy (LSM, confocal LSM VK-X-160K/KEYENCE Corp., Osaka, Japan) was utilized. It operates with a 658 nm laser that is focused via a ×100/numerical aperture 0.95 objective onto the sampling surface generating a spot size of ∼0.845 µm. A cross section scan along the complete cut edge was done in several planes with a step size of 0.13 µm, reaching from the lowest to the highest visible feature. To locally assess the maximum roughness Rz of the cut edge the scans were subdivided into several profiles, covering between 15 and 54 filaments depending on the Pitch, and special attention at the Entry-Side and Focus-Side. As Rz resembles the maximum peak-to-valley size of the defects at the cut edge, it is expected to be more closely related to the mechanical properties of the glass than the arithmetic mean roughness Ra. As it is not easily possible to obtain height information from the SEM data, the surface modifications at the Entry-Side were measured as well to determine their height with high precision of several nanometers.
3.3 Stress Optical Imaging of a Filament Line
A StrainScope Flex (ilis gmbh, Erlangen, Germany) with a circular polarized, monochromatic light source of 590 nm and a telecentric lens was used to analyze the local residual stress of samples containing a filament line in the center of the sample at half length (see Figure 1) with a spatial resolution determined at 7 µm/pixel utilizing a microscopic calibration target. The method of stress optics is widely known and utilizes the effect of birefringence in transparent materials. Residual stress is changing the local atom density and therefore the usually optical isotropic glass is going to be anisotropic. If the light passes through a region where local variations of residual stress are present, its electromagnetic components experience a retardation δ. Subsequently, the retardation is a measure of the present stress σ that is calculated according to Wertheim’s law (Eq. 1), where C is the stress optical coefficient and d is the thickness of the material [12].
The equation makes it clear that only the difference (σ1-σ2) between the two principal stress axes, which have a 90° angle to each other and are oriented perpendicular to the optical axis of the setup, can be calculated. The optical axis coincides with the thickness dimension of the sample. Also, it must be mentioned that the retardation along the full thickness of the material is collected integrally, which needs to be considered in the interpretation of the stress distribution. The stress optical coefficient C = 2.7 1/TPa for soda-lime silicate glass was retrieved from the literature and the resulting experimental values were determined with an uncertainty of ±2 MPa [13].
4 Results and Discussion
4.1 Surface Modifications at the Interface—Melting Effects
To maintain a good visibility and comparability of the SEM images of both glass systems, the arrays in Figures 2, 3 were designed with the same layout displaying the Entry-Side in (A), respectively, the Focus-Side in (B) with the Pitch increasing horizontally from 2 to 7 µm from left to right and the pulse number within a Burst increasing vertically from 2 pulses/filament to 4 pulses/filament from bottom to top. When looking at the Entry-Side of OptiWhite™ in (Figure 2A/1) one can notice a large variation of size and shape of the surface modifications with an overlap and even merging of adjacent surface modifications at Burst 4/Pitch 2 µm. From the overlap it is clear to say that the bulges are formed and become solid before the next filament and surface modification is generated. With increasing Pitch, the bulges are well separated and evenly shaped. Fine and small sprinkles starting from the bulges can be seen, which indicate the fluid character of the surface modifications during the formation. The surface modifications are similar for Burst 4 and Burst 3. However, the sample prepared with Burst 2 shows partially closed center holes and flow of material in contact with neighboring modifications (see the red arrows). It seems that the viscosity of the surface modifications was higher for Burst 2, as the connection created by the fluid material is larger in comparison with the fine sprinkles observed for the other Bursts. This indicates an increased temperature with an increased Burst energy, i.e., deposited energy (see Section 4.6). In the vicinity to the filament line expelled and condensed material can be observed covering the unmodified glass [14]. At the Focus-Side for Pitch 2 (2B/1), the filamentation process caused a broad ruptured area and the before-mentioned fluid behavior and merging is increased, which points out that the deposited energy was significantly larger in comparison with the Entry-Side. For a larger Pitch 5 & 7 (2B/2,3) the surface modifications are again well separated. The Burst-related series (2B/2,4,5) shows a similar shape for all samples. Contrary to the Entry-Side, the bulges are flatter. This difference indicates that the stream of fluid material is tending upward in the direction of the bulk. A clearly visible crack is propagating along the filament line (2A/2 & 3; see the yellow arrows). Following the interpretation of our previous investigation, this surface crack is correlated with the presence of a thorough micro crack network over the entire thickness of the material [8]. It is visible for all parameter sets, except for the sample prepared with Burst 2/Pitch 5 at the Focus-Side. The final cleaving will take place by applying an external force that boosts the micro cracks growth.
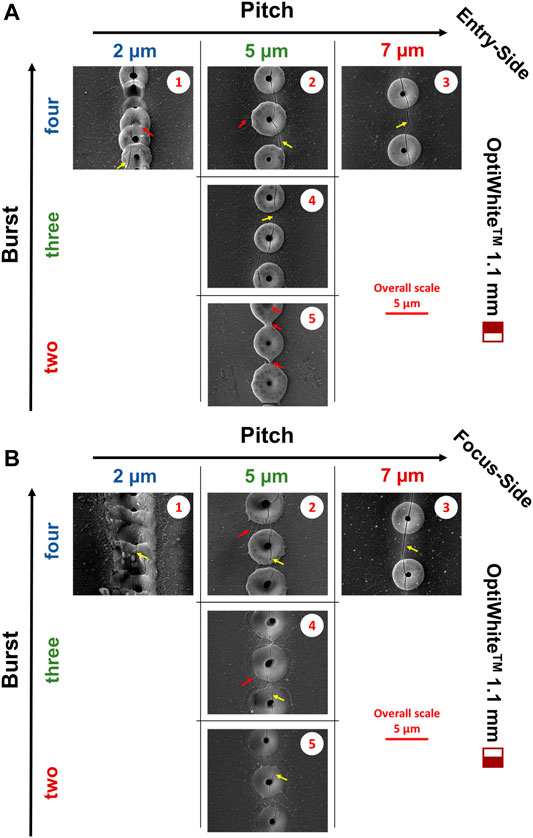
FIGURE 2. The SEM images of the Entry-Side (A) and of the Focus-Side (B) of OptiWhite™ 1.1 mm samples. Pitch is increasing from left to right and pulse number within one Burst from bottom to top. The scale bar is attached to the right of the images. Numeration in the top right corner is set to better address specific image. Surface modifications show partially strong melting and overlapping flow (red arrows) but also discrete round regular shapes. Small fine sprinkles of fluid material (red arrows) point out the fluid character during formation. Condensed matter and expelled material are found in the environment. Continuous surface cracks are observed (yellow arrows), except for B5.
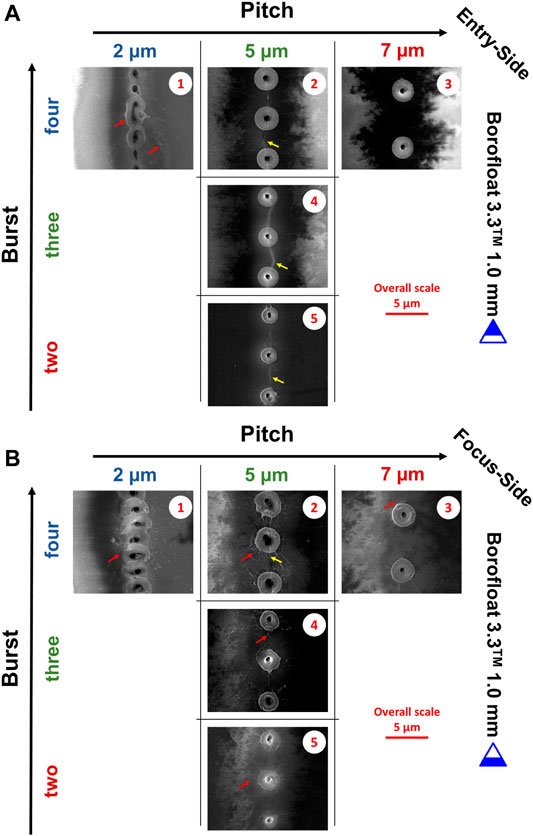
FIGURE 3. The SEM images of the Entry-Side (A) and of the Focus-Side (B) of Borofloat 3.3™ 1.0 mm samples. Pitch is increasing from left to right and number of pulses within one Burst from bottom to top. The scale bar is attached to the right of the images. Numeration in the top right corner is set to better address specific image. Surface modifications show partially strong melting and overlapping but also discrete round regular shapes and fine sprinkles (red arrows). Continous surface cracks are indicated by yellow arrows. Charge effects in the surrounding material might be related to nano fragmented recondensed liquid droplets.
The most prominent visible features for the Borofloat 3.3™ samples are the large-scale charge effects. These effects occur when the electron beam of the SEM negatively charges the material locally and this charge is not conducted properly, e.g., by the gold coating. As they only appear at the filament line or in the close vicinity and not in remote areas of the glass, it is assumed that these effects are related to the laser treatment. At (3A/1) the charge effect is surrounding the filament line and the surface modifications again are overlapping and merging. Expelled material and sprinkles are deposited next to the filament line, more than for OptiWhite™. With greater Pitch 5 & 7 (3A/2 & 3) regular round bulges are formed. In general, the modifications look similar to OptiWhite™, but overall are smaller in scale. Borosilicate glasses are known to be more fragile than soda-lime silicate glass, which means that the viscosity decreases more sharply at high temperatures. This difference of fragility can explain the differences observed due to higher fluid fragmentation of the Borofloat 3.3™. Perhaps, the charge effect could be associated with nano fragmented or recondensed liquid droplets. At the Focus-Side more expelled material and fine sprinkles are seen, which is in good agreement with an even lower viscosity due to higher energy deposition. Surface cracks (yellow arrows) are observed at the Entry-Side of the Burst series (Figure 3A/2,4,5) and at the Focus-Side only for Burst 4/Pitch 5 (Figure 3B/2).
4.2 Size Determination of Surface Modification
From the SEM images the diameters of the surface modifications were determined and are shown in Figure 4 in relation to the Pitch (4A) and to the Burst (4B). The symbols are partially filled to denote the corresponding sample side, i.e., half-filled top symbol ≙ Entry-Side and half-filled bottom symbol ≙ Focus-Side, while dashed red and blue lines are guides to the eyes to allow better tracing of each side. Each point was averaged by measuring at least ten modifications in the perpendicular and parallel direction to the filament line trajectory, whereas the error bars were assessed as the standard deviation. In the case where the filaments were too deformed and overlapping in the direction of the filament line, only the perpendicular distance was used to assess the diameter. The black dashed lines show several theoretical geometry thresholds for ideal round-shaped surface modifications where adjacent filaments:
-touch each other with a diameter-to-Pitch ratio of 1:1 (see small sketch within Figure 4A)
-reach into the center of an adjacent filament with a 1.5:1 ratio
-cover the adjacent filament entirely when a ratio of 2:1 is exceeded
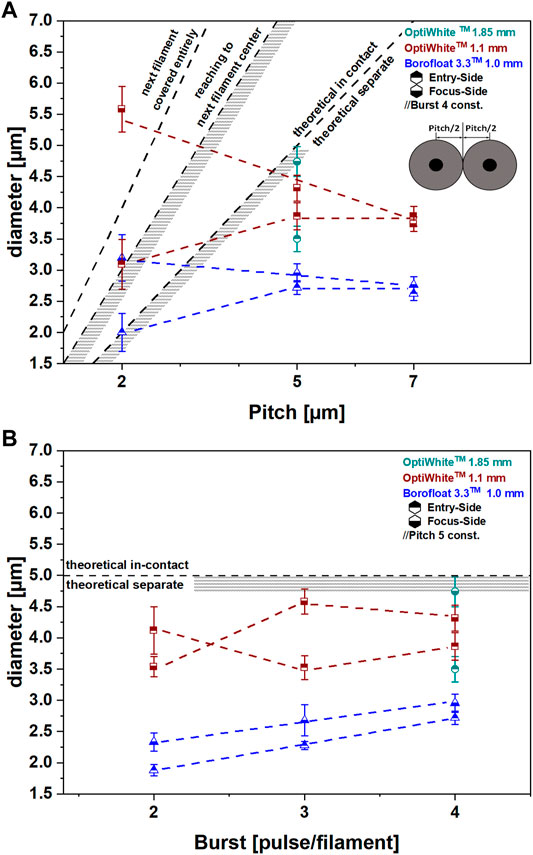
FIGURE 4. Surface modification diameter measured from SEM images in relation to the Pitch (A) and to the Burst (B). Small sketch in (A) illustrates the criteria of surface modifications being in contact with a diameter/Pitch ratio of 1:1. Further critical thresholds are displayed with a 1.5:1 ratio marking the border when surface modifications reach into the adjacent center position, or with a 2:1 ratio when the surface modifications cover the adjacent filament entirely. The blurred regions attached to the thresholds resemble the viscous behavior of the surface modifications. In general, OptiWhite™ is forming larger surface modifications than Borofloat 3.3™. A too narrow Pitch caused melting and exceedingly large surface modifications, whereas the Burst showed minor influence on the modification size.
It can be observed that OptiWhite™ forms larger surface modifications than Borofloat 3.3™ and that the Focus-Side tends to develop slightly larger surface modifications than the Entry-Side for both glass-systems, which originates from the larger deposited energy. OptiWhite™ 1.85 mm shows an even higher deviation between both sides due to its thickness and therefore an increased difference of energy deposition. Both glasses show no evolution between Pitch 5 and 7 µm. If the filaments are put too close with a Pitch 2 µm the surface modifications are no longer of discrete shape and are at least in contact (Borofloat 3.3™/Entry-Side) with each other or reach into the next filament position (OptiWhite™/Entry-Side; Borofloat 3.3™/Focus-Side). At Pitch 2 µm OptiWhite™/Focus-Side the laser-treated region is determined with a width of almost three times larger than the corresponding Pitch. A too narrow Pitch is causing a confined energy deposition at smaller material volume, which results in a local temperature accumulation that heats the material in a large area leaving a broad heat-affected zone. Beyond the theoretical in contact threshold a remelting of micro cracks is expected, which is seen by the absence of surface cracks. This is not desirable as it can affect the cleavability of the filament line and the properties of the cut piece of glass. To avoid such an influence, it is advised to choose the Pitch above the threshold of the surface modifications reaching the adjacent filament position. As long as the surface modifications are separate or just touching, no influence on the crack propagation during cleaving is expected and the energy deposition of the following filament is not influenced by the previous one (theoretical in contact threshold, Figure 4). On approach to the second threshold, where the surface modifications are large enough to reach the center position of the next adjacent filament (indicated by the blurred region in Figure 4), inter-filament influences are expected. Only the samples prepared with Pitch 2 µm are in this category. Looking at the variation of the modification size in relation to the Burst (Figure 4B), the diameters are below the contact threshold for all samples. The modifications for OptiWhite™ remain almost constant at each side. Borofloat 3.3™ seems to show a slight increase at both sides, as a greater pulse number within a Burst inevitably means a higher energy deposition.
4.3 Fracture Pattern From Cut Edge Observation
A cross section of the cut edge, taken with LSM, of both glass-systems is shown in Figures 5, 6, whereas the top three images are related to the Pitch and the bottom three are related to the Burst. The images are oriented with the Focus-Side to the right and the Entry-Side to the left. Sample parameters are located within the images and indicators, as in Figures 2, 3, are located at the left. A scattered fracture pattern can be observed, which is a result of the micro cracks formed by the laser treatment. For OptiWhite™ Burst 2, large areas that show characteristic, plain glass fracture can be seen between 1,100 μm and 600 μm at the Entry-Side (see the yellow arrows). For the rest of the sample the micro crack network is homogenous throughout the cut edge. For Burst 2 it is evident that at the Entry-Side the deposited energy was partially too low, and the effects needed for micro crack formation were not fully developed, i.e., the cleaving guidance was not fully effective. All Borofloat 3.3™ samples show an entire and visually finer scattered fracture. This slight difference seems to show that both glasses undergo a different micro crack network formation. Anyway, it is complicated to extract further detailed information by the eye and therefore the maximum roughness Rz was evaluated (see Figures 7, 8).
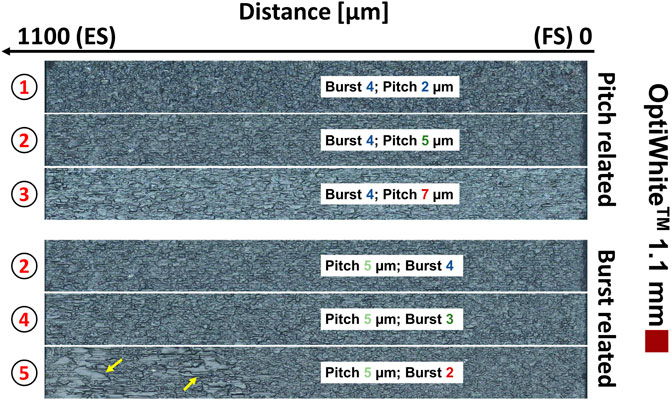
FIGURE 5. Optical cross section images of the cut edge of OptiWhite™ obtained with LSM. Entry-Side is located at the left (1,100 µm) and Focus-Side is at the right (0 µm). The top three images (numeration at the left) show the cross section in relation to the Pitch and on the bottom the corresponding Burst series is shown. Sample names are mentioned within the images. At the Entry-Side of image 5 the ineffective filamentation is leaving characteristic glassy fracture surfaces (yellow arrows) instead of scattered fracture pattern as for the rest of the glass.
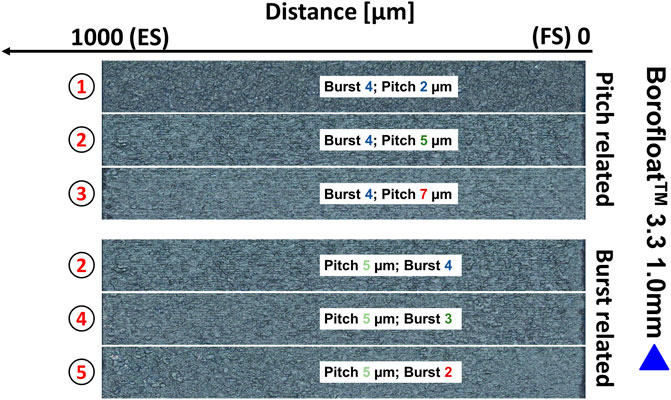
FIGURE 6. Optical cross section images of the cut edge of Borofloat 3.3™ obtained with LSM. Entry-Side is located at the left (1,000 µm) and Focus-Side is at the right (0 µm). The top three images (numeration at the left) show the cross section in relation to the Pitch and on the bottom the corresponding Burst series is shown. Sample names are mentioned within the images. Scattered fracture pattern is visible for all images throughout.
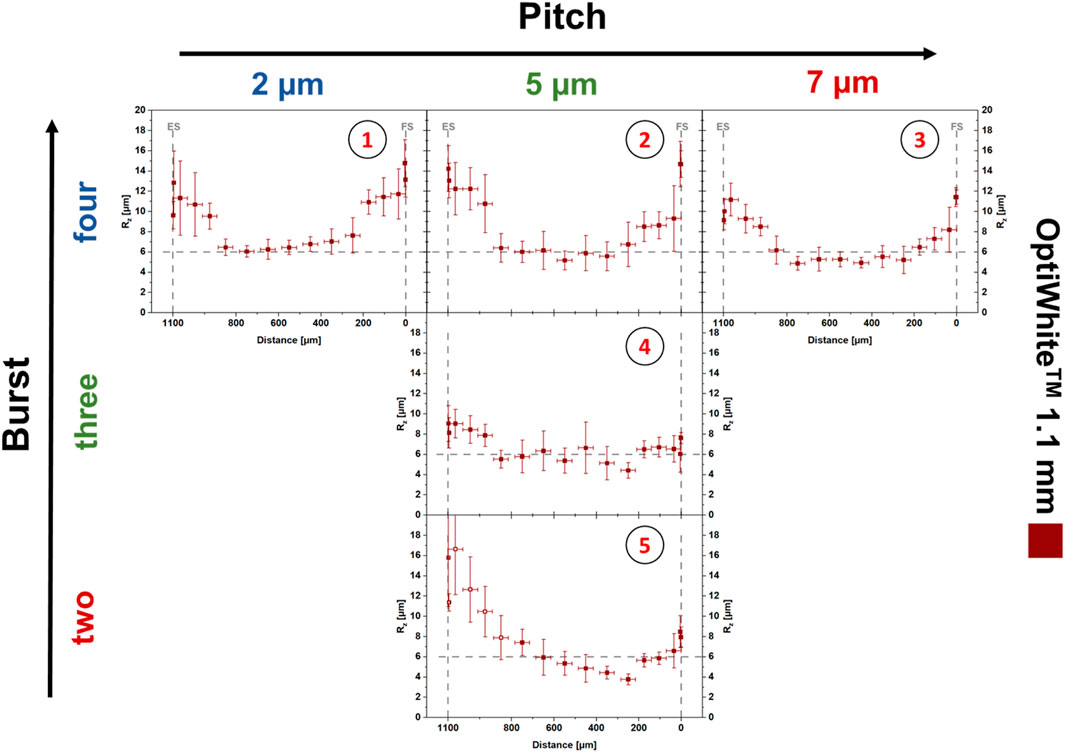
FIGURE 7. Maximum roughness Rz profiles along the cross section for the OptiWhite™ 1.1 mm series. Gray dashed lines are guide to the eye, i.e., horizontal line fixed at 6 µm and mark Entry- and Focus-Side (vertical). Increased roughness at the Entry- and Focus Side can be seen, while the middle area remains at lower values. Hollow symbols in graph 5 indicate ineffective filamentation with a characteristic glassy fracture pattern, which is responsible for the elevated values.
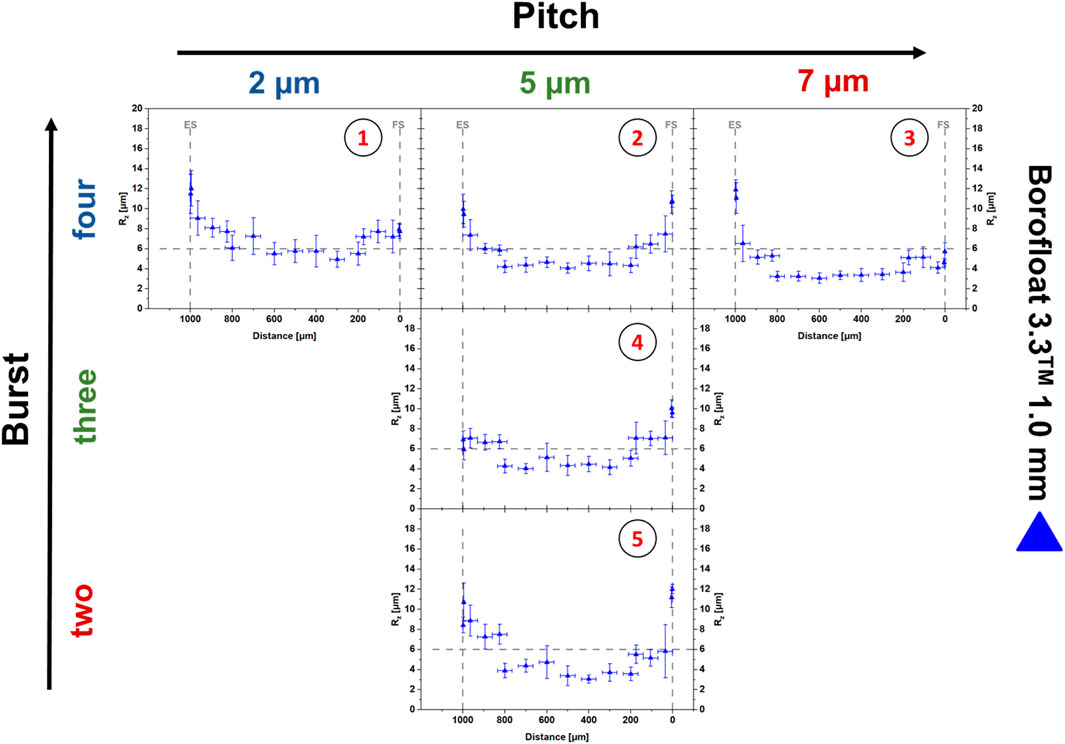
FIGURE 8. Maximum roughness Rz profiles along the cross section for the Borofloat 3.3™ 1.0 mm series. Gray dashed lines are guide to the eye, i.e., horizontal line fixed at 6 µm and mark Entry- and Focus-Side (vertical). Increased roughness at the Entry- and Focus Side can be seen while the middle areas remain at lower values.
4.4 Maximum Roughness Rz Evaluation—Quantification of the Micro Crack Network
Themaximum roughness Rz assessed from the LSM measurements is shown in Figures 7, 8, with the Entry-Side (left) and Focus-Side (right), denoted by gray dashed lines. Each value is the mean value of eleven lines which were evenly distributed over an area of interest. The error bars of Rz were determined as the standard deviation and the distance error bars as the distance between the adjacent areas. To give a guide to the eye, the horizontal gray dashed line was fixed at a Rz = 6 µm and kept constant in both figures. For all samples and Pitch/Burst combinations Rz is larger at the edges compared with inner regions. Within 200–300 µm from the edge Rz is determined ∼12 μm, whereas the inner region is lower between 3 and 6 µm. With varying Pitch an overall decrease of Rz is observed, for both OptiWhite™ and Borofloat 3.3™. It can be deduced that at high Pitch the micro crack length is smaller. Looking at the Burst influence, no clear trend can be identified. The only difference observable was for OptiWhite™ Burst 2, where the effective filament length was not enough to reach through the entire sample, leaving only traces of the laser treatment at the Entry-Side but causing no micro crack formation. This is indicated by the hollow symbols in Figure 7/graph 5. As Rz is resembling the value to characterize the maximum variation of a rough surface from maximum peak-to-valley, it is problematic as soon as a large variation of surface-/crack patterns is present in one evaluated area, which explains the drastic increase at the Entry-Side. Borofloat 3.3™ and OptiWhite™ samples show a similar cut edge roughness in the cross section. It can be noticed that the roughness in the middle section is always lower for Borofloat 3.3™. The reduction of Rz in the region of the bulk material suggests that the cleaving and micro crack mechanism is not identical for both glasses, which is going to be explained in detail in the following section by the morphology of the void channel. From the characteristic Rz distribution it can be deduced that the cleaving guidance is mainly determined by the overlap of the micro cracks at the Entry- or Focus-Side and not from the inner regions. Indeed, for OptiWhite™ and Borofloat 3.3™ the samples with Pitch 7/Burst 4 show a lower roughness in the middle than the Pitch distance.
4.5 SEM Imaging of the Cut Edge—Void Channel Morphology
To better highlight the features of the cut edge, some exemplary SEM images are shown in Figure 9, with the sample name and parameters mentioned next to the corresponding image. The images were chosen to highlight morphological phenomena at the cut edge. For Burst 4/Pitch 7 (Figure 9/C & D) the central void channels of the filaments are well separated to each other (orange double arrows). For OptiWhite™ the channels show sections of long voids but overall more singular voids are present, whereas the Borofloat 3.3™ shows long open channels (blue arrows). The presence of multiple voids in OptiWhite™ could be a result of the non-linear Kerr-effect and repeating focus/defocus cycles, which will be discussed further in Section 4.9 [15, 16]. Images on top show samples prepared with Burst 4/Pitch 2 for OptiWhite™ (A) and for Borofloat 3.3™ (B). As already observed for the surface modifications with Pitch 2, an interaction between the channels is present. The voids merge into their adjacent neighbor and create interconnections of the channels or agglomeration of voids (turquoise arrows), for both materials. This means that the next filament is formed while the material at the previous filament is still in a liquid/soft state. Estimation of the exact time the plasma is persisting is a complicated problem, as the recombination effects happen on various time scales. The calculation and simulation of the energy, time, and space distribution of laser light propagating in various gasses and matter at varying parameters, e.g., beam shapes, pulse durations, laser polarization, power, and others is a currently studied topic with a rather large number of published articles [17–23]. To provide such determinations of these effects a sophisticated simulation approach is needed, which is beyond the scope of this article. Anyhow, the samples prepared with a narrow Pitch of 2 µm and Burst 4 show merging of voids. Thus, it is evident that the filament environment is liquid or soft for at least 64.5 µs, which is the time the stage needs to move to the next dedicated filament position. Looking more carefully in Figures 9C–F, an area can be identified that envelopes the void channel (red dashed wavy lines), which was observed in other articles, also [11, 24]. It shows remolten characteristics and due to rotational symmetry, it can be idealized as a cylinder with the void channel as the center axis. As the merging is not present for OptiWhite™ Pitch 5 & 7/Burst 4, the soft surrounding material must be lower than 5 µm in diameter. From Figures 9E,F, showing Burst 2/Pitch 5, it is hinted that the diameter of the laser affected zone is reduced which can be easily understood due to the smaller energy deposition. Also, when comparing both materials the laser affected zone of Borofloat 3.3™ seems slightly smaller, perhaps due to its higher thermal conductivity. As the void channel is prominently visible, the cleaving crack apparently split the laser affected zone rather precisely in half. This suggests that highly oriented radial micro cracks are formed in the direction of the filament line trajectory [11, 25, 26]. However, a second type of cracks can be identified bypassing around the laser affected zone leaving a hill-and-dale like topography (green arrows and sketch in Figure 9/G). Further on, a void can be seen as an inhomogeneity, i.e., a flaw, that enables a local stress overshoot, which means that an increased amount of singular, small voids is beneficial for micro crack formation (see the yellow arrows in Figures 9A,B). Here, it is obvious that the micro crack density is much higher for OptiWhite™ than for Borofloat 3.3™. When looking at the borders, the bulge of the surface modifications can be identified with a cone-like transition between surface modification and the void channel within ∼3 µm (indicated by white dashed lines). To estimate the amount of expelled material in correlation to the open channel depth, some further quantification is possible.
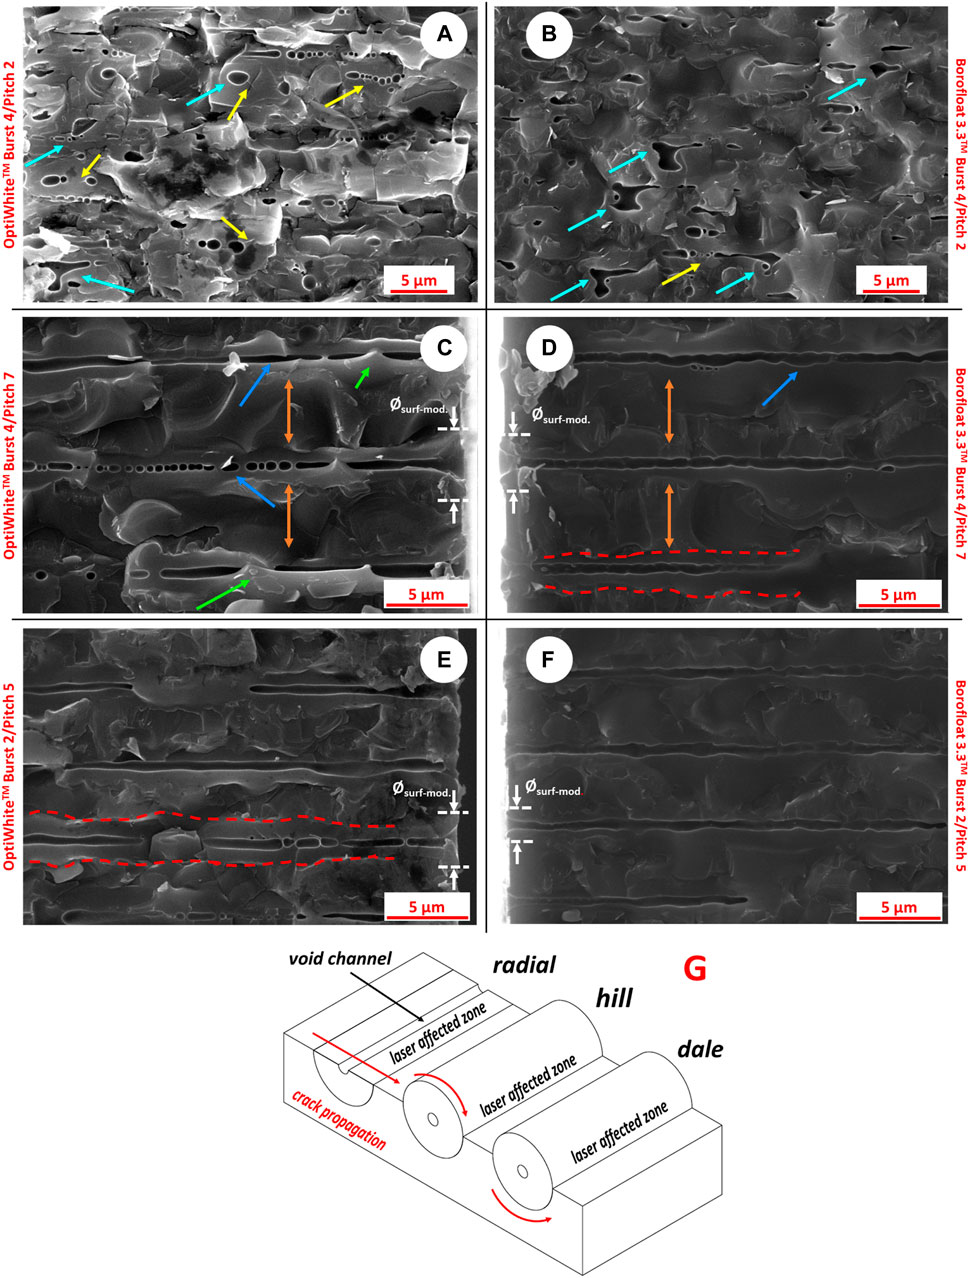
FIGURE 9. Exemplary SEM images of the cut edge to highlight special features of void formation and void channels (OptiWhiteTM: left column (A, C, E)/Borofloat 3.3TM: right column (B, D, F)). In (A,B) samples prepared with Burst 4/Pitch 2 show strong interaction of adjacent filaments with merging of void channels, large-, singular-, and agglomeration of voids (turquoise arrows). In (A) micro cracks starting from the voids can be visually identified (yellow arrows). Samples prepared with Pitch 7 (C,D) present well-separated void channels (orange double arrow) and general differences of the void channels can be seen (blue arrows). OptiWhite™ (C) shows a mix of longer and singular voids due to pinching caused by nonlinear propagation of the laser, whereas Borofloat 3.3™ (D) shows long and open channels that are formed along the entire thickness. In (D,E) the laser-affected zone (red dashed wavy line) shows remolten characteristics and is visibly smaller in comparison with the outer diameter of the surface modifications. The laser-affected zone is not distinguishable in (A,B) as they are largely overlapping due to the narrow Pitch 2 µm. In (G) the different crack propagation modes are illustrated. The generally good visibility of the void channel means that highly oriented radial cracks split the laser-affected zone precisely in half but also bypass cracks around the laser-affected zone can be observed (the green arrows in (C)).
4.6 Quantification of Expelled Material in the Bulges
Figure 10 shows the schematic drawing of the sideview (left) and a top view (right) of the bulge modification. It is not round/donut shaped but presents a flattened area, which originates from the fact that the bulge height is much smaller in comparison with the outer diameter. With the information of the lateral size dimensions of the surface modifications all necessary radii can be determined, and the calculation of the volume is possible according to Eqs 2–5. The inner diameter of the void channel was determined in the same manner as the before discussed outer diameter of the bulge. Height information of the bulges was retrieved from LSM imaging of the Entry-Side, where regular shaped bulges were present and suitable for measurement. A height profile was taken along the filament line considering >80 filaments. Both the inner diameter of the void channel ∼600 nm and the height of the bulges ∼400 nm remained constant within the error bars and therefore are not displayed in detail. Volume evolution is only shown in relation to varying Burst (Figure 11), as for the Pitch-series the volume remained constant for Pitch 5 and Pitch 7. Above the theoretical in contact threshold, the Pitch does not influence the expulsion conditions. For Pitch 2, which is below the contact threshold, no evaluation was possible. Owing to the constant inner diameter of the void channel and the height, the outer diameter is the determining variable and therefore the volume follows the same trend ranging from ∼0.5 µm³ to ∼2.0 µm³ for Borofloat 3.3™ and from ∼2.5 µm³ to ∼4.5 µm³ for OptiWhite™. At Burst 2 for OptiWhite™ the volume is drastically increased to ∼6.5 µm³ which probably originates from a higher viscosity. The filamentation was not fully effective for this sample since the cut edge presents plain glass fracture at the Entry-Side (see Section 4.3 and the yellow arrows in Figure 5/5). With knowledge of the bulge volume, the equivalent void channel volume and the corresponding open channel depth can be calculated to estimate the origin of the material that forms the bulge. Here, the void channel is idealized to be a discrete cylinder without singular voids. For Borofloat 3.3™ the open channel depth is determined between ∼2.5 μm at Burst 2 and ∼7 μm at Burst 4, whereas for OptiWhite™ it was calculated to be ∼50 μm at Burst 2 and ∼13 μm at Burst 4. The material remaining in the surface modifications is smaller than the overall material removed during the laser process by several orders of magnitude. This means that most of the material that is ionized by the laser radiation is either volatilized, recondensed on the surface, expelled as fragments, or densified on the sidewall of the void channel [14, 27, 28]. At first glance, the marginally remaining material deposited in the bulge is bigger when the viscosity is largest, i.e., for OptiWhite™ at Burst 2, but also the overall expulsed material is lower. This is explained by the reduced effective filamentation of Burst 2 in comparison with Burst 4. In contrary, the expulsion by fragmentation and vaporization is favored at low viscosity as seen for the more fragile borosilicate.

FIGURE 10. Schematic drawing of the cross section of a surface modification and parts of the bulk (left) and from the top view (right). With the results obtained from SEM and LSM measurements all mentioned spatial characteristics can be derived and the area and volume can be calculated according to Eqs 2–5. With the assumption of an ideal, open cylinder in the center, the equivalent void channel volume and open channel depth can be obtained, and estimation of the remaining material can be concluded.
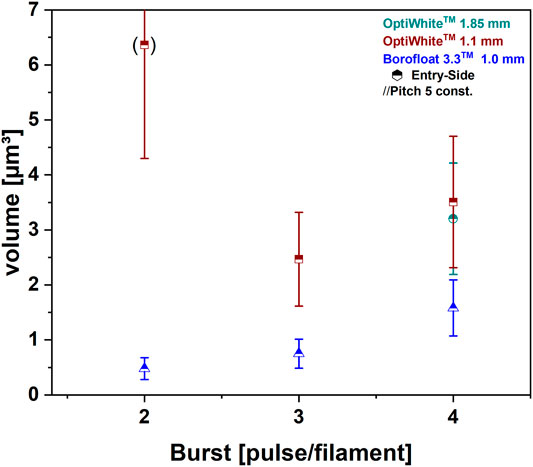
FIGURE 11. Calculated volume of the surface modifications at the Entry-Side in relation to the Burst. An increase can be observed which goes along with the corresponding outer diameter. The inner diameter and the height of the surface modifications were found to be constant.
4.7 Anisotropic Stress Distribution at the Front of a Filament Line
Using stress optical measurements all the parameter combinations look qualitatively similar. In Figure 12/filament front, a representative stress optic image of a filament line with Pitch 5 that ends in the bulk material can be seen. A butterfly-like shape of the stress is visible with stressed regions reaching far in the direction of the bulk material at the end of filament line, whereas the consecutive scribed filament line is free of stress. Furthermore, an asymmetry of the stress distribution with a singularity in the center can be observed. The stress is slightly elevated in the direction of the unfilamented pristine glass whereas there is less in the direction of the already scribed filament line (red arrows, filament front). It is surprising that the surrounding of the scribed filament line is stress free and only the last filaments present an intense stress field at the front. At the top right in Figure 12 a filament line with a Pitch 1,500 µm is shown displaying well-separated filaments where no interactions between filaments are visible. Around each filament position a weak stress field is observable and confined to a few microns. The formed stress field shows a similar butterfly shape with a lower stress intensity (pay attention to scales, see Figure 12, mid right A). The observed variation of stress intensity could be associated with a variation of micro crack density, where each crack results in stress release. For a consecutive filament line where interaction between the filaments is observed, in our case for ≤ Pitch 7, a highly developed micro crack network releases the stress entirely along the filament line, but an accumulation of stress is observed at the filament line front. This suggests that the micro crack network is formed cumulatively under the influence of several adjacent filaments and the stress is not released when the filament line is stopped. One possible explanation for the development of the micro crack network is the temperature gradient and the concomitant shock waves of the laser pulses. The present temperature from the process was not sufficient to relax the material at the filament line front, which allows identifying that micro- and bypass crack formation is primarily responsible for the stress release. To better interpret the stress distribution, a line scan was extracted perpendicular to the filament line (profile 1). The maximal stress difference, calculated according to Eq. 1, was determined ∼18 MPa in approximately 25 µm distance to the filament line. After this maximum, the stress is halved after ∼100 µm and from there decreases steadily and reaches the equilibrium of untreated glass within 2 mm. Anyhow, the observed stress is rather small and far below the limit of crack propagation. To better understand the constitution at the filament front, profile 2 was placed along the filament line reaching from untreated glass into the terminal scribed filament line. A doublet is visible with one peak at the maximal value of ∼12 MPa in the pristine glass region and the other, less intense peak in the area of the filamented glass. A minimum is observed and coincides with the last filament position. The less intense peak covers ∼100 μm, i.e., a total of 20 filaments. Observation of the singularity suggests that the very last filament only generated weak or no micro cracks at all, and the majority of tangential stress remains in the material. A single filament would generate a symmetric doublet with two peaks of the same height (see profile 3 in Figure 12). It is proposed that the reduction of stress in the less intense peak in the filament region originates from the presence of a micro crack network linked to the previous filaments. Again, this is an evidence that for thorough micro crack formation several consecutive filaments are mandatory. This dependence assures the directional character of the radial cracks, leading to the asymmetric, butterfly stress distribution.
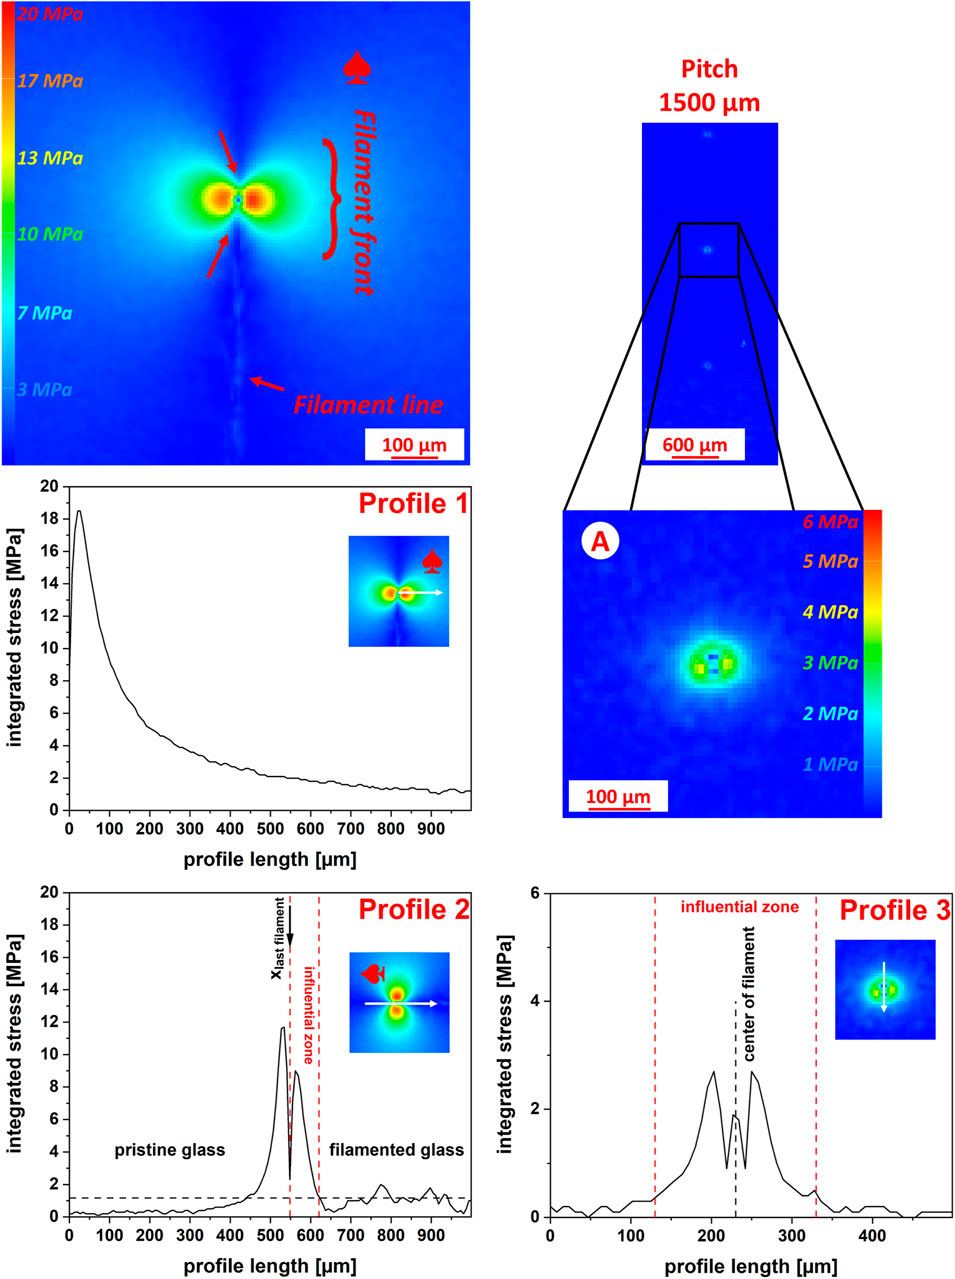
FIGURE 12. Stress optic image of a filament line that ends inside the bulk material with Pitch 5 µm (top left, filament front) and well-separated filament line with Pitch 1,500 µm (top right). The red arrows at the filament line front indicate the directional dependency of the radial cracks. Below, two extracted profiles are shown: Profile 1 (mid left) horizontal extraction as shown by white arrow in the inset; Profile 2 (bottom left) was extracted along the filament line (white arrow) reaching from pristine to filamented glass. The position of the last scribed filament is determined at the singularity. The influential zone, where filaments affect each other, is determined to be ∼100 µm. The magnified region (mid right) shows a singular filament with lower stress scale and its corresponding profile 3 (bottom right) shows a symmetric stress distribution.
4.8 Interaction Between Filaments and Micro Crack Formation—Schematic Model
From all the investigations and observations made, a model of filamentation and its accompanied influence on the glass is given in this section. The mechanism of crack formation is often explained with the emission of a shock wave caused by the laser pulse impact, which originates from the electron to ion energy transfer. The emission and propagation of this shock wave happens after several hundredths of picosecond to nanoseconds [29]. Thus, it is expected not to interact with the generating laser pulse itself and to be faded prior to the impact of following pulses after Δt = 24 ns. The influence of the thermal effects, inducing thermal shock and thermal expansion mismatch, can play a significant role in crack-formation and -propagation as well. To illustrate how these two effects could act on the formation of a micro crack network, a rough schematic model presenting the scribing of a series of five consecutive filaments with discrete increments of 64.5 µs is proposed in Figure 13. Owing to the laser pulse width of 12 ps and the electron-phonon relaxation time ranging at the same magnitude the thermalization of the plasma is reached very fast after the laser/glass interaction and due to the 24 ns between consecutive pulses the material is affected by temperature with only minor delay after the first pulse interaction. Temperatures of several thousand Kelvin can be generated, which results in a softened glass in the direct environment around the void channel while the rest of the material remains at low temperature (t1) [25, 30]. Thus, the micro crack formation via the shock wave is not possible at first, as the glass needs to be solid again to be brittle. After several nanoseconds, the first Burst is deposited and concomitant shock waves have ceased, the laser-affected zone resolidifies and cools rapidly at the outer regions while inner regions at the void channel are still elevated in temperature, i.e., strive to shrink (t2). Therefore, within the laser-affected zone the outer region is under radial compressive stress while in the inner region at the void channel tensile stress is present. Overall a tangential tensile stress component at the outer rim of the affected zone is introduced at the boundary to the non-affected glass (t2, dashed black contour and double arrow) [25]. Owing to the scribing direction of the filaments, an anisotropy of the temperature distribution can be expected which favors the micro crack extension to be in the opposed, cold direction of scribing. These mechanisms are proposed to be responsible for initial micro cracks asymmetry (t2). In general, the tangential stress is reduced upon crack formation which is indicated by the reduced length of the double arrow in the different orientations of the laser-affected zone. It is now that the shock waves emitted after each pulse from the consecutive filament are going to interact and elongate the preformed initial micro cracks (t2). A limit radius of the shock waves, rstop, can be defined as the distance at which the shock wave converts to a conventional sound wave being purely elastic. Estimation of rstop was done under the assumption of ideal absorbance without energy loss due to reflection, scattering, or thermal effects according to Eq. 6, where Eabs is the absorbed energy and E is the Young modulus of the material [24].
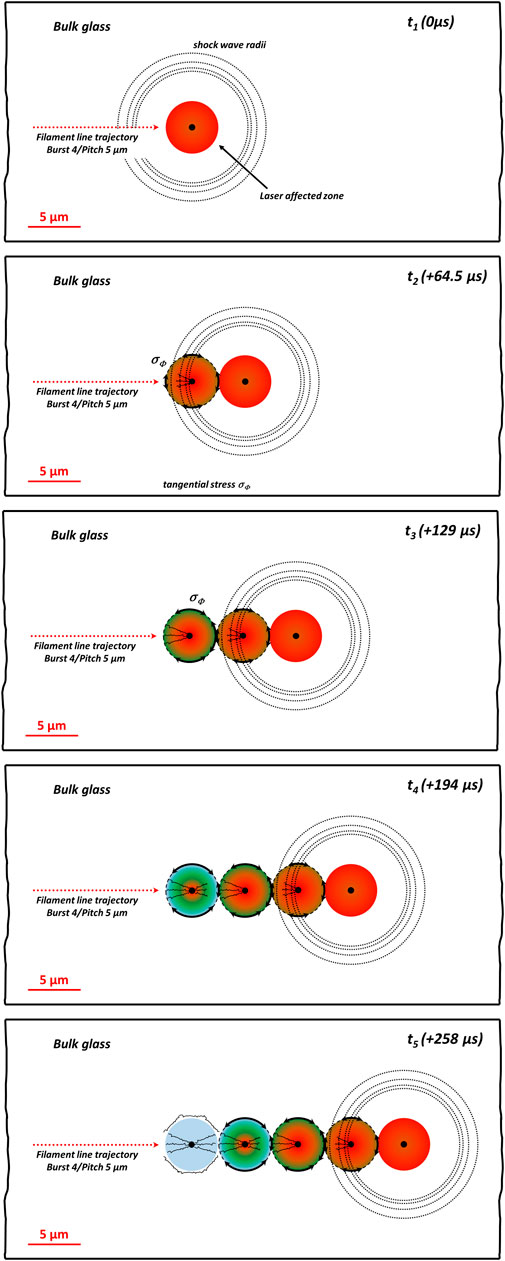
FIGURE 13. Schematic model of filament and micro crack formation with accompanied thermal effects and shock wave emission. Sketches were done in increments of 64.5 µs as it was the time for the stage to travel to the next dedicated filament position (noted in the top right corner). Parameters were chosen to be Burst 4/Pitch 5 and the diameter of the laser-affected zone was set to be 5 µm. Colors indicate the current temperature with red ≙ high-, green ≙ intermediate-, and blue ≙ low temperature. Short dashed black circles indicate the emitted shock waves after each pulse impact with the radius calculated according to Eq. 6. Dashed black contour encircling the laser-affected zone and the black double arrows indicate the presence and amount of tangential stress σφ caused by the temperature gradient. Consider Section 4.8 for a detailed description.
The shock wave diameters range between 14.25 µm for the first pulse of the Burst and 10.80 µm for the fourth pulse which shows that depending on the Pitch adjacent filaments are located well in the shock wave influence. Anyway, if the Pitch is set to greater distances, the interaction of shock waves with the micro cracks might be reduced or even completely ineffective after a certain distance, e.g., for the sample prepared with a Pitch 1,500 µm (see Figure 12). As the zone cools down further, already formed micro cracks grow larger (t3) and partially release the tangential stress in the direction of the filament line. At the same time, the laser-transformed region is locked through the glass transition with a higher volume creating a mismatch with the unaffected glass. This is increasing the tangential stress component in the direction toward the bulk (larger size of black double arrow). The micro crack formation will now proceed in scribing direction as the anisotropic heating due to the process diminishes (t4). Last, when the laser-affected zone is returned to ambient temperature, the tangential stress is at maximum and bypass cracks propagating around the laser-affected zone start to form. The tangential stress is considered to be the driving force of bypass crack generation, which releases the remaining tangential stress in the direction of the bulk (t5). For the sake of clarity, we only describe the effect on five filaments. A more detailed modeling of thermal effects is needed to estimate the heat diffusion time of the laser-modified zone precisely. The stress optical investigations show a stress field ranging up to ∼100 μm, which suggests that interactions can affect up to 20 filaments in the case of Pitch 5 µm. Eventually, these processes are generating a micro crack network along the filament line and through the entire thickness. In fact, it is expected that the micro cracks constitute a preferential pathway that guides the cleaving crack, which finally cuts the glass. Ultimately, the micro cracks determine the cleavability and set the topography of the cut edge.
4.9 Influence of the Laser Parameters on the Schematic Micro Crack Model
Now that a global schematic model of micro crack formation was established the influences of the laser parameters, Pitch and Burst, are detailed. Figures 14 and 15 show schematic models in which two exemplary filaments evolve upon Pitch (top row) and deposited energy (bottom row) variation. It was chosen to use the term “deposited energy” as the number of pulses is increasing the total deposited energy within a Burst (see Section 2). In relation to the Pitch evolution an entire effective filamentation reaching through the material is assumed, i.e., sufficient deposited energy. In the same way in relation to varying Burst the assumption of well-separated filaments is used, i.e., Pitch above the contact limit. In the schematic models in Figures 14, 15, different features related to the filamentation process are distinguished. The maximum crack extension (yellow zone) is established from the Rz profiles (see Figures 7, 8). The laser-affected zone (red dashed vertical lines) is established by the observation of the molten material in the SEM images of the cut edge (see Figure 9). The micro crack network is represented by the zigzag red lines and the filament content as surface modifications by gray shapes on the top at both sides.
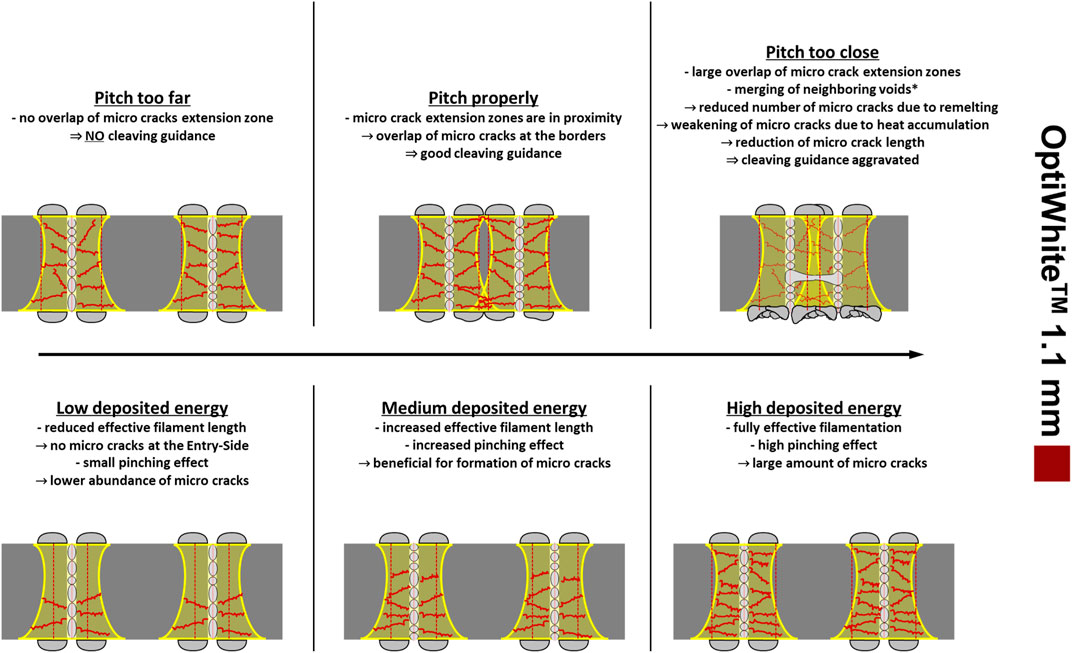
FIGURE 14. Schematic side view of two filaments to describe the ongoings of Pitch (top) and Burst (bottom) variation for OptiWhite™. The light gray hemispheres on the top and bottom of the surfaces represent the surface modifications (see Figure 2). The yellow profiles correspond to the maximum crack extension zone affected by micro cracks (red cracks) which is deduced from the roughness profiles (see Figure 7). The vertical dashed red lines indicate the laser-affected zone as seen in Figure 9. The void channel contains several voids due to the pinching effect. At the top row, entire effective filaments reach through the thickness. With a “Pitch too far” no interaction between adjacent filaments is visible and the micro cracks are only formed within the maximum micro crack extension zone (yellow). At “Pitch properly” the filaments approach each other, and micro cracks might connect where an overlap of the micro crack extension zones is present. For “Pitch too close” a very large overlap of the micro crack extension zones is present and a weakening of the micro cracks is expected as well as large, interconnecting voids are formed due to confined heat accumulation. At the bottom row, “Low deposited Energy” caused a reduced effective filament with stretched voids and micro cracks only form at the Focus Side. “Medium deposited Energy” increased the effective filament length, a larger fraction of the material is generating micro cracks and a higher abundance of singular voids due to a higher pinching effect is expected. With “High deposited Energy” a thorough effective filament is formed with a large variation of the void morphology. The laser-affected zone (red dashed vertical lines) changes gradually with increasing energy. *merging of voids is expected to be a combination of too close filaments generated with exceeding deposited energy. For more detailed explanation consider the description within the figure and Section 4.9.1.
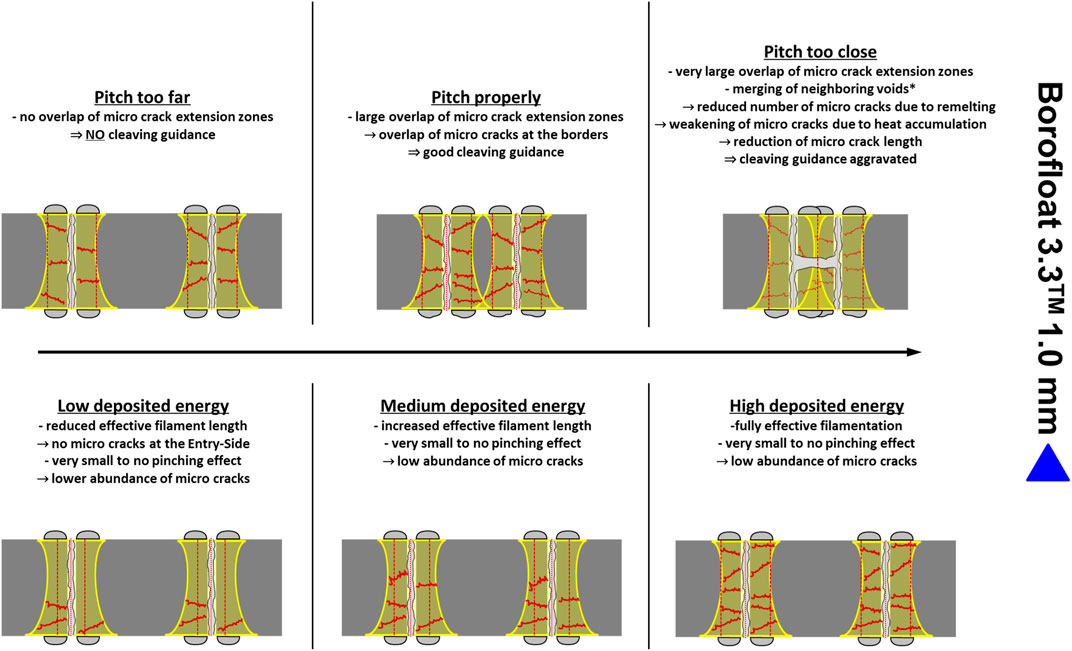
FIGURE 15. Schematic side view of two filaments to describe the ongoings of Pitch (top) and Burst (bottom) variation for Borofloat 3.3™. The light gray hemispheres on the top and bottom of the surfaces represent the surface modifications (see Figure 3). The yellow profiles correspond to the maximum crack extension zone affected by micro cracks (red cracks) which is deduced from the roughness profiles (see Figure 8). The vertical dashed red lines indicate the laser-affected zone as seen in Figure 9. At the top row, entire effective filaments with large, open void channels reach through the entire thickness. With a “Pitch too far” no interaction between adjacent filaments is visible and micro cracks are only formed within the maximum micro crack extension zone (yellow). At “Pitch properly” the filaments approach each other, and micro cracks might connect where an overlap of the micro crack extension zones is present. For “Pitch too close” a very large overlap of the micro crack extension zones is present and a weakening of the micro cracks is expected as well as large, interconnecting voids are formed due to confined heat accumulation. At the bottom row, no affection of the void morphology was observed. “Low deposited energy” caused a reduced effective filament length and micro cracks form only at the Focus-Side. “Medium deposited energy” increased the effective filament length and the micro crack density. With “High deposited energy” a thorough effective filament is formed. The laser-affected zone (red dashed vertical lines) changes gradually with increasing energy. *merging is expected to be a combination of too close filaments generated with exceeding deposited energy. For more detailed explanation consider the description within the figure and the detailed explanation in Section 4.9.2.
4.9.1 OptiWhite™
For OptiWhite™ (Figure 14, top row) at “Pitch too far” the filaments are well separated, while still forming micro cracks within the maximum crack extension zone (yellow zone). Still, the effects of the shock waves caused by the pulses and stress caused by the thermal effects of adjacent filaments are present, which leads to micro crack formation. The laser-affected zone (red dashed vertical lines) are fairly separated and no micro crack interaction or remelting is expected between adjacent neighbors. The void channel is constituted by a variation of singular and longer shaped voids. On the top of the glass the surface modifications form discrete shapes. On approach of the filaments “Pitch properly” the micro cracks are in proximity to each other and bridge where the maximal micro crack extension zone is overlapping, whereas the laser-affected zones are still separated. If this case is present, a guidance of the cleaving crack is possible. Surface modifications look similar as previously described, but show deforming at the Focus-Side. In the case of “Pitch too close” the adjacent filaments affect each other heavily. The laser-affected zones overlap and the temperature accumulation is remelting the material. The micro crack network might be developed with a greater overlap, but the micro cracks itself are weaker due to the afore mentioned partial remelting and ineffective shock wave interaction. In this case the voids merge into each other and the micro cracks extension is blocked by interconnecting voids. This is unfavorable in terms of cleaving, as the abundance and length of micro cracks is lowered. Strong overlapping and melting of the bulges at the surface can be identified. At the bottom row, the evolution of the filamentation with variation of the deposited energy is shown. For the sake of clarity the “Pitch too far” setting was chosen since overlap of the zones is explained before. The size of the laser-affected zone is increasing with a higher deposited energy. The maximum micro crack extension is unaffected with a change of deposited energy. Since the micro crack formation is depending on the shock wave and thermal effects of neighboring filaments, the density of cracks is going to be proportional to the deposited energy. This means that the cleaving guidance is not always maintained, which is indicated by the amount of cracks distributed along the glass thickness. Also, the deposited energy is having an effect on the effective filament length, e.g., as shown in Figure 5/5, where the reduced energy led to a non-cracked region toward the Entry-Side.
4.9.2 Borofloat 3.3™
Figure 15 displays the variations for Borofloat 3.3™. Similar considerations as for OptiWhite™ regarding the proximity and the influence of deposited energy can be applied, i.e., overlapping of the micro crack network at the surface layers, the size of the laser-affected zone, and the effective filament length. The void channel morphology and the maximal crack extension zone show differences. No visible change in the void channel morphology is noticed, and always entirely open channels are observed for all the investigated parameters. These open channels can be viewed as a single continuous inhomogeneity without pinching. The abundance of micro cracks is drastically reduced, as explained in Section 4.5, affecting the cleaving guidance. The so-called pinching of the void channel is a result of nonlinear effects, e.g., the Kerr-Effect, which causes spatial focus/defocus of the laser beam [2, 31–34]. These effects are energy dependent and determined by the characteristic nonlinear refractive index n2 of the material [10, 35]. The n2 of Borofloat 3.3™ (n2 = 0.96*10−13 esu) is much smaller in comparison with OptiWhite™ (n2 = 1.51*10−13 esu) [36]. This could explain the absence of pinching and the open channels in Borofloat 3.3™. The critical mechanisms for micro crack formation are shock wave and thermally induced stress. According to the material datasheet, Borofloat 3.3™ has a lower Young’s modulus (64 GPa) as well as a significantly lower thermal expansion coefficient (3.25*10−6 1/K) and a higher thermal conductivity (1.2 W/mK) than OptiWhite™ (72 GPa, 8.3*10−6 1/K, 0.937 W/mK). Borofloat 3.3™ combines an unfavorable set of material properties regarding the micro crack formation. This shows that it is intrinsically more complicated to laser cut borosilicate glass than regular soda lime glass.
5 Conclusion
In this study the general behavior and response of soda-lime- and borosilicate glass to the exposition to ultra-short-pulsed picosecond laser filamentation was investigated and from the observed phenomena the influence on the glass was evaluated. It was found that the surface modifications vary in size and different temperature regimes are present at the Entry-Side and Focus-Side. Several thresholds describing the diameter-to-Pitch ratio were formulated. It is emphasized that a too strong overlap of surface modifications must be avoided to maintain high quality and minimize perturbation of the laser beam. Evaluation of the cut edge has shown that near the Entry-Side and Focus-Side the roughness is increased while in inner regions the cut edge presents smoother regions. Volumetric calculations of the surface modifications have proven that most of the material from the bulk is removed, e.g., evaporated or deposited on the surface as expelled fragments. A model of micro crack-formation and -propagation was derived. A careful observation of the SEM images of the cut edge led us to propose the formation of bypass cracks around the laser-affected zone, but also highly oriented radial micro cracks in the trajectory of the filament, which split the void channel precisely in half, are identified. From stress optic imaging we concluded that the micro cracks are not formed on the impact of the laser pulses but under the influence of neighboring filaments at a distance up to ∼100 µm. Further stress optics revealed that the inevitable present temperature of the process is not responsible for stress relaxation, but the micro cracks formation is the major driving force of stress release. Schematic parameter-dependent models were established to describe how the change in Pitch and Burst influences the formation of the micro crack network and the cleaving guidance. It was found that the filaments need to be in certain proximity to generate an overlap of the micro cracks as well as to maintain a sufficient deposited energy to form an effective filament reaching from Focus-Side to Entry-Side. Anyway, it is crucial to avoid an exceeding temperature accumulation, as the concomitant merging of voids will interfere with the micro crack network and reduce the cleaving guidance.
It was identified that borosilicate glass presents an unfavorable combination of material properties regarding the laser filament cutting process. With the proposed models further understanding of the parameter influence is gathered, which allows us to better tune the filamentation process to a specific glass type and to achieve the desired laser filament quality, which sets the condition of the cleaving. Still, the full dynamic of the micro crack interaction on a long-distance scale is not fully understood. Furthermore, it needs to be quantified how the stress built up of several adjacent filaments within a line evolves and leads to micro crack formation. Even by utilizing sophisticated simulation approaches and calculations, the modeling and prediction of crack behavior, e.g., the simulation of a single crack formation as well as crack propagation, is still a challenging problem in the simulation community. With the phenomenological schematic models based on our observations, we strive to provide an understanding of the micro crack formation with an engineering mindset, to give a new approach to both the engineer and the scientist, as well as to contribute to a better and precise description of the phenomena in the future. Complementary experiments will be needed to better assert certain aspects of our model. Chemical and structural characterization of the laser-affected zone would be needed to establish if they present a real contrast of their properties, but this is difficult due to the submicroscopic size of these domains. Even if the filament front was established to be approximately 100 μm, i.e., 20 filaments, the exact extent of a self-standing filament front is for the moment unknown, as it is highly parameter and glass dependent. Also, the asymmetry of the stress field at the front of the filament line has to be discussed in detail and perhaps is in connection to polarization of the laser beam [6, 37]. Another unsolved question is the quasi-random distribution and size of the voids within the void channel, as well as the appearance of interconnecting voids between adjacent filaments when too close to each other. In the future a more quantitative approach to understand the pinching effect and the size of the micro cavities within the void channel should be done.
Data Availability Statement
The original contributions presented in the study are included in the article/Supplementary Material, further inquiries can be directed to the corresponding authors.
Author Contributions
Conceptualization, DdL and FW; methodology, DdL and FW; software, UE; validation DdL, FW, LM, and UE; formal analysis, FW; investigation, FW; resources, LM and UE; data curation, FW; writing—original draft preparation, FW; writing—review and editing, FW and DdL; visualization, FW; supervision, DdL; project administration, DdL; funding acquisition, DdL; All authors have read and agreed to the published version of the manuscript.
Funding
This paper is an outcome of the project OptiGLas (Grant Number NW‐1602‐0004).
Conflict of Interest
Authors UE and LM are employed by Coherent Munich GmbH & Co. KG.
The remaining authors declare that the research was conducted in the absence of any commercial or financial relationships that could be construed as a potential conflict of interest.
Publisher’s Note
All claims expressed in this article are solely those of the authors and do not necessarily represent those of their affiliated organizations, or those of the publisher, the editors, and the reviewers. Any product that may be evaluated in this article, or claim that may be made by its manufacturer, is not guaranteed or endorsed by the publisher.
Acknowledgments
The authors especially thank Forschungszentrum Jülich GmbH—PTJ for project-supervision and -management, as well as the Bavarian Ministry of Economic Affairs, Regional Development and Energy for financial funding.
References
1. Raciukaitis G. Ultra-Short Pulse Lasers for Microfabrication: A Review. IEEE J Select Top Quan Electron. (2021) 27:1–12. doi:10.1109/jstqe.2021.3097009
2. Couairon A, Mysyrowicz A. Femtosecond Filamentation in Transparent media. Phys Rep (2007) 441:47–189. doi:10.1016/j.physrep.2006.12.005
4. Nisar S, Li L, Sheikh MA. Laser Glass Cutting Techniques-A Review. J Laser Appl (2013) 25:042010. doi:10.2351/1.4807895
5. Phillips KC, Gandhi HH, Mazur E, Sundaram SK. Ultrafast Laser Processing of Materials: a Review. Adv Opt Photon (2015) 7:684. doi:10.1364/AOP.7.000684
6. Hnatovsky C, Shvedov VG, Krolikowski W. The Role of Light-Induced Nanostructures in Femtosecond Laser Micromachining with Vector and Scalar Pulses. Opt Express (2013) 21:12651–6. doi:10.1364/OE.21.012651
7. Dai Y, Patel A, Song J, Beresna M, Kazansky PG. Void-nanograting Transition by Ultrashort Laser Pulse Irradiation in Silica Glass. Opt Express (2016) 24:19344–53. doi:10.1364/OE.24.019344
8. Werr F, Veber A, Brehl M, Bergler M, Werner D, Eppelt U, et al. Surface Probing of Ultra‐Short‐Pulse Laser Filament Cut Window Glass and the Impact on the Separation Behavior. Adv Eng Mater (2020) 22:2000471. doi:10.1002/adem.202000471
9. Nieto D, Arines J, O’Connor GM, Flores-Arias MT. Single-pulse Laser Ablation Threshold of Borosilicate, Fused Silica, Sapphire, and Soda-Lime Glass for Pulse Widths of 500 Fs, 10 Ps, 20 Ns. Appl Opt (2015) 54:8596–601. doi:10.1364/AO.54.008596
10. Do BT, Kimmel M, Pack M, Schmitt R, Smith AV. The Damage Mechanism in Borosilicate Glass Generated by Nanosecond Pulsed Laser at 1.064 μm. In: Proc. SPIE 8530, Laser-Induced Damage in Optical Materials: 2012, 853008, December 4, 2012 (2012). p. 853008. Available at: https://www.spiedigitallibrary.org/conference-proceedings-of-spie/8530/1/The-damage-mechanism-in-borosilicate-glass-generated-by-nanosecond-pulsed/10.1117/12.979243.short. doi:10.1117/12.979243
11. Hendricks F, Matylitsky VV, Domke M, Huber HP. Time-resolved Study of Femtosecond Laser Induced Micro-modifications inside Transparent Brittle Materials. In: Proc. SPIE 9740, Frontiers in Ultrafast Optics: Biomedical, Scientific, and Industrial Applications XVI, March 9, 2016 (2016). 97401A. Available at: https://www.spiedigitallibrary.org/conference-proceedings-of-spie/9740/1/Time-resolved-study-of-femtosecond-laser-induced-micro-modifications-inside/10.1117/12.2214081.short. doi:10.1117/12.2214081
12. Aben H, Guillemet C. Photoelasticity of Glass. 9783642500718. Berlin, Heidelberg: Springer Berlin Heidelberg (1993).
13. Schneider J. Glasbau: Grundlagen, Berechnung, Konstruktion. 2nd ed. 9783540689270. Berlin, Heidelberg: Springer Berlin/Heidelberg (2016).
14. Delobelle B, Courvoisier F, Delobelle P. Morphology Study of Femtosecond Laser Nano-Structured Borosilicate Glass Using Atomic Force Microscopy and Scanning Electron Microscopy. Opt Lasers Eng (2010) 48:616–25. doi:10.1016/j.optlaseng.2009.09.013
15. Couairon A, Mysyrowicz A. Self-focusing and Filamentation of Femtosecond Pulses in Air and Condensed Matter: Simulations and Experiments. In: Boyd RW, editor. Self-focusing: Past and Present ; Fundamentals and Prospects. 978-0-387-32147-9. New York, NY: Springer (2009). p. 297–322.
16. Cheng W, Pieterse J-W, Liang R. Damage inside Borosilicate Glass by a Single Picosecond Laser Pulse. Micromachines (2021) 12:553. doi:10.3390/mi12050553
17. Sun M, Eppelt U, Russ S, Hartmann C, Siebert C, Zhu J, et al. Numerical Analysis of Laser Ablation and Damage in Glass with Multiple Picosecond Laser Pulses. Opt Express (2013) 21:7858–67. doi:10.1364/OE.21.007858
18. Bergé L, Skupin S, Nuter R, Kasparian J, Wolf J-P. Ultrashort Filaments of Light in Weakly Ionized, Optically Transparent media. Rep Prog Phys (2007) 70:1633–713. doi:10.1088/0034-4885/70/10/R03
19. Clerici M, Faccio D, Rubino E, Lotti A, Couairon A, Di Trapani P. Space-time Focusing of Bessel-like Pulses. Opt Lett (2010) 35:3267–9. doi:10.1364/OL.35.003267
20. Dubietis A, Couairon A, Kučinskas E, Tamošauskas G, Gaižauskas E, Faccio D, et al. Measurement and Calculation of Nonlinear Absorption Associated with Femtosecond Filaments in Water. Appl Phys B (2006) 84:439–46. doi:10.1007/s00340-006-2249-3
21. Durand M, Jarnac A, Houard A, Liu Y, Grabielle S, Forget N, et al. Self-guided Propagation of Ultrashort Laser Pulses in the Anomalous Dispersion Region of Transparent Solids: a New Regime of Filamentation. Phys Rev Lett (2013) 110:115003. doi:10.1103/PhysRevLett.110.115003
22. Faccio D, Rubino E, Lotti A, Couairon A, Dubietis A, Tamošauskas G, et al. Nonlinear Light-Matter Interaction with Femtosecond High-Angle Bessel Beams. Phys Rev A (2012) 85. doi:10.1103/PhysRevA.85.033829
23. Faccio D, Lotti A, Matijosius A, Bragheri F, Degiorgio V, Couairon A, et al. Experimental Energy-Density Flux Characterization of Ultrashort Laser Pulse Filaments. Opt Express (2009) 17:8193–200. doi:10.1364/oe.17.008193
24. Gamaly EG, Juodkazis S, Nishimura K, Misawa H, Luther-Davies B, Hallo L, et al. Laser-matter Interaction in the Bulk of a Transparent Solid: Confined Microexplosion and Void Formation. Phys Rev B (2006) 73. doi:10.1103/PhysRevB.73.214101
25. Mishchik K, Beuton R, Dematteo Caulier O, Skupin S, Chimier B, Duchateau G, et al. Improved Laser Glass Cutting by Spatio-Temporal Control of Energy Deposition Using Bursts of Femtosecond Pulses. Opt Express (2017) 25:33271. doi:10.1364/OE.25.033271
26. Dudutis J, GeČys P, RaČiukaitis G. Non-ideal Axicon-Generated Bessel Beam Application for Intra-volume Glass Modification. Opt Express (2016) 24:28433–43. doi:10.1364/OE.24.028433
27. Faccio D, Tamošauskas G, Rubino E, Darginavičius J, Papazoglou DG, Tzortzakis S, et al. Cavitation Dynamics and Directional Microbubble Ejection Induced by Intense Femtosecond Laser Pulses in Liquids. Phys Rev E (2012) 86:36304. doi:10.1103/PhysRevE.86.036304
28. Gamaly EG, Rode AV, Rapp L, Giust R, Furfaro L, Lacourt PA, et al. Interaction of the Ultra-short Bessel Beam with Transparent Dielectrics: Evidence of High-Energy Concentration and Multi-TPa Pressure (2017). Available at: http://arxiv.org/pdf/1708.08163v2. (Accessed December 28, 2021).
29. Ito Y, Shinomoto R, Otsu A, Nagato K, Sugita N. Dynamics of Pressure Waves during Femtosecond Laser Processing of Glass. Opt Express (2019) 27:29158–67. doi:10.1364/OE.27.029158
30. Miyamoto I. Local Melting of Glass Material and its Application to Direct Fusion Welding by Ps-Laser Pulses. JLMN (2007) 2:7–14. doi:10.2961/jlmn.2007.01.0002
31. Corbari C, Champion A, Gecevičius M, Beresna M, Bellouard Y, Kazansky PG. Femtosecond versus Picosecond Laser Machining of Nano-Gratings and Micro-channels in Silica Glass. Opt Express (2013) 21:3946–58. doi:10.1364/OE.21.003946
32. Courvoisier F. Ultrafast Laser Micro-nano Structuring of Transparent Materials with High Aspect Ratio. In: K Sugioka, editor. Handbook of Laser Micro- and Nano-Engineering, 1–37. 978-3-319-69537-2. Cham: Springer International Publishing (2020). Available at: https://link.springer.com/referencework/10.1007%2F978-3-319-69537-2. doi:10.1007/978-3-319-69537-2_33-1
33. Dematteo Caulier O, Mishchik K, Chimier B, Skupin S, Bourgeade A, Javaux Léger C, et al. Femtosecond Laser Pulse Train Interaction with Dielectric Materials. Appl Phys Lett (2015) 107:181110. doi:10.1063/1.4935119
34. Polesana P, Franco M, Couairon A, Faccio D, Di Trapani P. Filamentation in Kerr media from Pulsed Bessel Beams. Phys Rev A (2008) 77. doi:10.1103/PhysRevA.77.043814
35. Do BT, Phillips MC, Miller PA, Kimmel MW, Britsch J, Cho S-H. Properties of Optical Breakdown in BK7 Glass Induced by an Extended-Cavity Femtosecond Laser Oscillator. Opt Express (2009) 17:2739–55. doi:10.1364/oe.17.002739
36. Boling N, Glass A, Owyoung A. Empirical Relationships for Predicting Nonlinear Refractive index Changes in Optical Solids. IEEE J Quan Electron. (1978) 14:601–8. doi:10.1109/JQE.1978.1069847
Keywords: laser cutting, micro machining, float glass, filament cleaving, surface analysis, stress optic
Citation: Werr F, Eppelt U, Müllers L and Ligny Dd (2022) Ultra-Short-Pulse Laser Filaments for Float Glass Cutting: Influence of Laser Parameters on Micro Cracks Formation. Front. Phys. 10:862419. doi: 10.3389/fphy.2022.862419
Received: 25 January 2022; Accepted: 24 February 2022;
Published: 24 March 2022.
Edited by:
Matthieu Lancry, Université Paris-Saclay, FranceReviewed by:
Daniel Schondelmaier, West Saxon University of Applied Sciences of Zwickau, GermanyPaulius Gečys, Center For Physical Sciences And Technology (CPST), Lithuania
Copyright © 2022 Werr, Eppelt, Müllers and Ligny. This is an open-access article distributed under the terms of the Creative Commons Attribution License (CC BY). The use, distribution or reproduction in other forums is permitted, provided the original author(s) and the copyright owner(s) are credited and that the original publication in this journal is cited, in accordance with accepted academic practice. No use, distribution or reproduction is permitted which does not comply with these terms.
*Correspondence: Ferdinand Werr, ZmVyZGluYW5kLndlcnJAZmF1LmRl; Dominique de Ligny, ZG9taW5pcXVlLmRlLmxpZ255QGZhdS5kZQ==
 Ferdinand Werr
 Urs Eppelt2
 Dominique de Ligny