 Ning Zhang1
 Tianxue Ou1Meng Wang2Zhanjian Lin1Chao Lv1Yuzhi Qin1
 Jiaming Li1*Huan Yang2*Nan Zhao1Qingmao Zhang1
- 1Guangdong Provincial Key Laboratory of Nanophotonic Functional Materials and Devices, School of Information and Optoelectronic Science and Engineering, South China Normal University, Guangzhou, China
- 2Sino-German College of Intelligent Manufacturing, Shenzhen Technology University, Shenzhen, China
The calibration-free laser-induced breakdown spectroscopy (CF-LIBS) technique requires no reference samples of the same matrix to establish the calibration curve, not affected by the matrix effect. In recent years, the CF-LIBS technology has greatly progressed, and the accuracy of quantitative analysis has gradually improved. The purpose of this review was to introduce the CF-LIBS fundamental and modified algorithms. The Boltzmann plot method, Saha–Boltzmann plot method, and column density Saha–Boltzmann plot (CD-SB) method were discussed. Moreover, as a critical factor in CF-LIBS, the self-absorption effect and its influence on CF-LIBS were also introduced. CF-LIBS has been applied in a variety of fields, such as environmental protection, explorations of space, cultural heritage preservation, and geological survey, which were also described in this review.
1 Introduction
The types and compositions of elements in materials have an impact on their properties, either directly or indirectly. It is crucial to make elemental analyses evaluate material performance. Conventional methods include atomic absorption spectrometry (AAS), inductively coupled plasma mass spectrometry (ICP-MS), inductively coupled plasma emission spectrometry (ICP-AES), X-ray fluorescence spectrometry (XRF), tunable diode laser absorption spectroscopy, quartz-enhanced photoacoustic spectroscopy, quartz-tuning-fork enhanced photothermal spectroscopy (QEPTS), and dual-comb absorption spectroscopy [1–3]. Due to their complicated operation and time-consuming process, these methods are usually used in laboratories. In recent years, scientists have been looking for and have developed new analytical assays with rapid response, easy operation, and high reliability.
Laser-induced breakdown spectroscopy (LIBS) is a new promising atomic spectrometry, more versatile than traditional methods [4]. LIBS is also often referred to as laser-induced plasma spectroscopy (LIPS) or laser spark spectroscopy. As the excitation source in LIBS, a pulsed laser beam is focused onto the sample surface by using a focusing lens. Through multiphoton ionization, atoms, ions, and molecules in the laser focus focal area absorb the laser energy and generate initial free electrons. With the inverse bremsstrahlung effect, the free electrons are accelerated by the electromagnetic field of the laser beam and then collide with particles in the ambient gas and sample materials to produce more free electrons. The newly created free electrons are also accelerated by the electric field, resulting in an electron avalanche ionization (EAI) process throughout the laser pulse duration [5]. During a breakdown phenomenon, plasma is generated on the sample surface. The surface species can be quantitatively deduced by analyzing the plasma emission spectrum [6]. LIBS has become an attractive and popular technique in the field of chemical analysis due to its unique advantages, such as its application to liquids [7, 8], gases [9, 10], and solids [11, 12], no sample pretreatment, simultaneous detection of multiple elements, and noncontact remote detection in many fields, including laser cleaning [13, 14], environmental protection [15, 16], space exploration [17, 18], and cultural heritage preservation [19, 20].
Generally, a series of certified samples of similar matrices are required for the quantitative analysis to establish the calibration curves in LIBS, called the referenced calibration method (RCM). However, it is extremely difficult or even impossible to obtain similar referenced samples in many cases, such as soil, mining, and biological tissues, where the matrix effect is hardly avoided [21, 22]. Furthermore, the RCM requires consistency in the experimental conditions, such as laser power density, temperature, and humidity. The limitations to the reference sample have hindered the development of LIBS.
Ciucci was the first to propose a determination method without referenced samples: the calibration-free laser-induced breakdown spectroscopy (CF-LIBS) [23]. The elemental concentration information is determined by describing the physical states of the laser-induced plasmas through mathematical models. There is no need for referenced samples or calibration curves, and matrix effects can be effectively avoided. CF-LIBS has piqued researchers’ interest since its introduction in 1999, although analytical accuracy is less satisfactory than the RCM.
In the past few decades, experimental modification and physical algorithmic improvements in CF-LIBS have been made by scholars all around the world. Analytical accuracy keeps increasing. To overview the development and the state-of-the-art CF-LIBS, this review included three parts: the essential assumptions and the basic mathematical model, a modified model combined with the Saha-Eggert equation, and the self-absorption and its effect on CF-LIBS. The purpose of this review was to give LIBS researchers some inspiration to promote the exploration.
2 Fundamental Algorithm
The basic assumptions of CF-LIBS include (1) chemometric ablation, in which elemental composition and content in plasmas are the same as in samples [23, 24]; (2) local thermal equilibrium (LTE), ensuring the particles are in the excited energy level, following the Boltzmann distribution [25]; (3) optical thinness, meaning that the self-absorption in the selected spectral line can be ignored for calculation; and (4) elemental information wholeness, observed spectra including all the species of elements [26]. Based on the aforementioned assumptions, the spectral intensity at wavelength
Equation 2 can be rewritten in a linear form:
A relationship of
The partition function
The value of
Then, the concentration of each element in the sample can be determined as
Ideally, an accurate elemental determination requires two conditions [27–29]: (1) the fitting linear curve of the same species has high linearity (
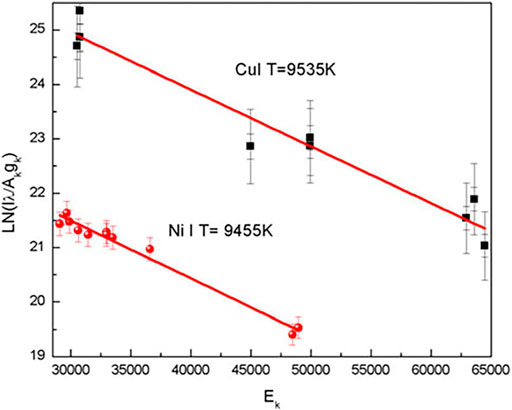
FIGURE 1. Typical Boltzmann plots for estimating the plasma temperature. Emission lines from singly ionized Cu and Ni are used for obtaining the temperature. Reproduced with permission from [30], ©2016 Cambridge core.
The laser-induced plasma is transient and inhomogeneous. It only approximately meets the conditions for LTE within the appropriate temporal and spatial window [19]. Deviation from LTE conditions will badly influence the analytical accuracy. The McWhirter criterion is the most commonly used criterion for verifying LTE, especially because in plasma with the presence of high-density particles, the collisional transitions dominate the radiative transitions between all states. It is a necessary but not sufficient condition for LTE because it only applies to homogeneous and static plasmas [32]. The McWhirter criterion can be used as
where
The obtained spectral intensity is proportional to the relative efficiency: the light emitted by the plasma is coupled to the spectrometer, where the detector converts the optical signal into an electrical signal. Because the transmission and conversion efficiency of the optical system and the spectrometer are wavelength-dependent, the spectral intensity obtained directly must be corrected:
where
The Boltzmann plot was applied by researchers in various fields. Fahad et al. quantified the composition of the limestone, as shown in Figure 2; the results of the CF-LIBS technique compared to scanning electron microscopy combined with energy-dispersive X-ray spectroscopy and electron probe microanalysis are in good agreement [35]. Pandhiji et al. used the CF-LIBS method to quantify the elements in the coral skeleton, except for Sn(Certified data: 10 ppm and CF-LIBS data: 6 ppm); all of the values were in general agreement with the verified values. The results were somewhat different compared to ICP-MS, and the reason for this disagreement may be that the CF-LIBS data were related to the surface of the coral, while the ICP-MS data were related to its overall mass [36]. In the following year, they determined toxic heavy metals (Cd, Co, Pb, Zn, Cr, etc.) in soil samples from four industrial areas by the calibration curves, CF-LIBS, and ICP-OES methods. The results showed that the limits of detection (LOD) for Cd and Zn in soil were 0.2 and 1.0 ppm, respectively, and the ICP-OES method was in good agreement with the CF-LIBS method [37]. Similarly, Kumar et al. created a Boltzmann plot for different elements (Ca, Fe, and Pb) in the sludge to determine the concentrations of toxic elements Cr and Pb [38]. Agrawal et al. used CF-LIBS as a quality control tool to monitor the composition of various mineral elements in food additives. The quantitative analysis results were consistent with those on the additive label. The presence of new (not on the label) elements and non-detected elements may be related to errors in the food additive and was not reported by the manufacturer due to low concentrations [39]. Yang et al. used CF-LIBS to quantify the H/D concentration ratio in titanium alloys, and the relative error of the H/D concentration ratio was only 1.33% when a Boltzmann plot was used to calculate the plasma temperature (choosing the spectral line of titanium) due to the scarcity of H and D elemental spectral lines, as well as their susceptibility to interference from titanium spectral lines [40].The quantitative analysis of the composition of elements in different karats of gold by Ahmed et al. showed that the Au content increases from 75.9% to 92.7%, with increasing gold purity (18–22 K), and the corresponding Cu content decreases from 17% to 5.7% [41]. Hamad et al. analyzed the composition of pressed cement samples, and the calculated elemental concentrations agreed with the XRF results with a maximum relative percentage error of 5% [42].
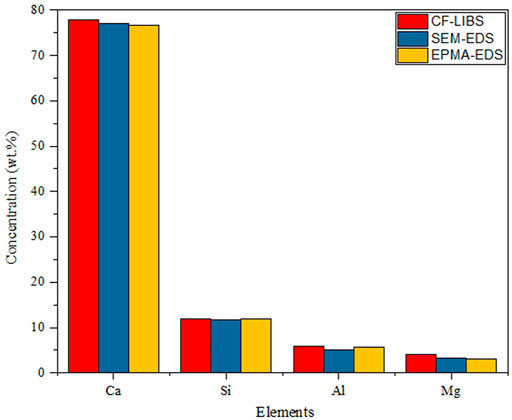
FIGURE 2. Relative elemental abundance of the limestone sample at the fundamental harmonic (1064 nm) of the Nd:YAG laser. Reproduced with permission from [35], ©2018 Institute Of Physics.
Under optimized experimental conditions, CF-LIBS allows more accurate elemental content analysis, with results comparable to those of XRF, ICP-MS, ICP-OES, AAS, and RCM in LIBS. Moreover, a series of standard samples are not required, making it more cost-effective and less time-consuming. When referenced samples are unavailable for establishing calibration curves, CF-LIBS is the only choice for the quantitative analysis using LIBS.
3 Modified Algorithm
3.1 Saha–Boltzmann Plot
Species in the same ionized state generally do not have enough spectral lines for representing the whole energy level and poor calculation accuracy of the plasma electron temperature. Yalcin et al. proposed a method of introducing the Saha–Eggert equation with the Boltzmann plot (Saha–Boltzmann plot method) in 1999 [43] and studied the effects of environmental conditions and laser energy on the plasma temperature. This method indeed improved the accuracy and reliability of temperature measurements.
The Saha–Boltzmann plot method must satisfy the condition of LTE, as well as the Boltzmann plot method. The Saha–Eggert equation describes the totality of neutral and singly ionic states of the same elements under the LTE condition:
where
Combining Equations 13, 14, the intensity of the ionic line can be rewritten as
Rearranging the aforementioned equation and taking the logarithm of both sides, we obtained the following equation:
where
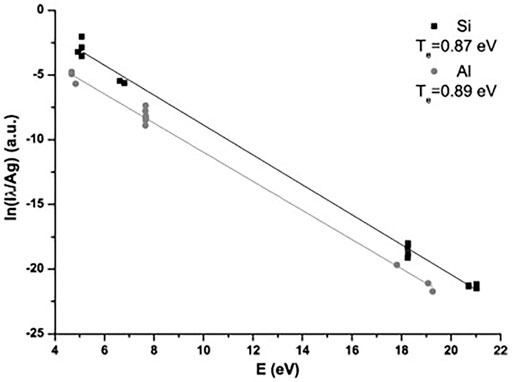
FIGURE 3. Saha–Boltzmann plot for silicon and aluminum. Reprinted from [44], Copyright (2013), with permission from Elsevier.
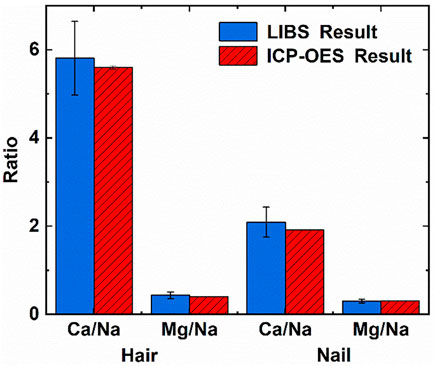
FIGURE 4. Comparison of ICP-OES and LIBS results in hair and nails. Reprinted from [45], Copyright (2021), with permission from Elsevier.
3.2 Columnar Density Saha–Boltzmann Plot
The methods based on the Boltzmann plot and the Saha–Boltzmann plot both have significant limitations: (I) optical thinness is needed; (II) the plasma electron temperature cannot be accurately deduced by the slope of the Boltzmann or Saha–Boltzmann plot when only a small number of spectral lines for elements in the same ionization state can be observed.
The column density Saha–Boltzmann (CD-SB) method can effectively overcome the aforementioned limitations [51], where the column density of the ground state can be directly calculated. Furthermore, the presence of self-absorption in the resonance lines ensures long-term atomic evolution [52]. This method proposed by Cristoforetti and Tognoni opened up a new avenue for accurate plasma temperature calculation (the columnar density Saha–Boltzmann plot, shown in Figure 5 [51]).
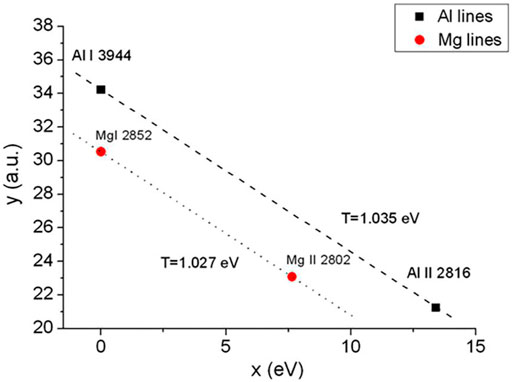
FIGURE 5. Modified Saha–Boltzmann plot built by using the columnar density of self-absorbed lines from Al and Mg species. Reprinted from [51], Copyright (2013), with permission from Elsevier.
Similar to the conventional CF-LIBS method, the plasma is assumed to be spatially homogeneous over the measured time interval in the CD-SB plot method. Equation 13 can be rewritten according to [51]:
This equation describes the equilibrium population of different ionization stages in terms of the number density of the lower level of an ionic transition (
where
Similarly, the Boltzmann Equation can be rewritten as
where
Combining Equations 17, 19, the column density Saha–Boltzmann equation can take the following format:
where
Since its introduction in 2013, this method has piqued the interest of many researchers because there is no need to search for optically thin spectral lines, calibrate the detection system, or correct self-absorption (instead, using self-absorbed lines to establish the CD-SB plot directly). Safi et al. determined the electron temperature of plasmas in aluminum alloys, which shows that the CD-SB plot is more suitable for plasma temperature determination, especially in the later stages of plasma evolution [52]. Hu et al. utilized the CD-SB plot in conjunction with the standard reference line method to determine the elemental composition of aluminum-bronze and aluminum alloy samples, demonstrating that this method outperformed the traditional CF-LIBS method in terms of precision and accuracy [53]. As shown in Figure 6, the CD-SB method combined with the standard reference line improves the results of quantitative elemental analysis compared to the traditional CF-LIBS method. Overall, this method not only improves accuracy compared to the traditional CF-LIBS method but also eliminates the need for complex self-absorption correction procedures.
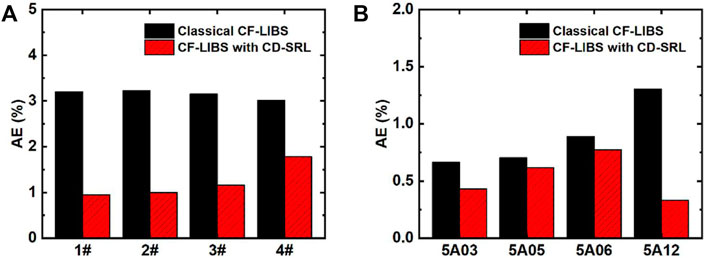
FIGURE 6. AEs of aluminum-bronze alloy (A) and aluminum alloy (B) were calculated by classical CF-LIBS and CF-LIBS with CD-SRL. Reprinted from [53], Copyright (2021), with permission from Elsevier.
4 Self-Absorption Correction
4.1 Effect of Self-Absorption on CF-LIBS
The plasma is optically thin under ideal LIBS conditions, where the light emitted from the plasma is free from self-absorption. The intensities of spectral lines and elemental concentrations have a linear relationship. However, according to the classical radiation theory of spontaneous radiation and stimulated absorption, self-absorption is bound to exist, especially at higher elemental contents, corresponding to optically thick plasmas. The light emitted from the plasma center would be absorbed by atoms and ions at the plasma periphery. The self-absorption effect of the emission spectral lines increases the full width at half-maximum (FWHM), reduces the intensity, and even produces severe self-reversal phenomena. As a result, the optical information emitted from the plasma is distorted, far away from the original relationship with elemental contents. The complexity of laser-matter interactions, the inhomogeneity of the plasma, and the transient nature of plasma evolution make self-absorption a very complex phenomenon. The principle of the self-absorption process in plasma, including self-absorption and self-reversal, is shown in Figure 7 [54, 55]), influenced by laser energy [56, 57], delay time [56–58], ambient gas [57, 59, 60], gas pressure [60], geometrical optical configuration [61, 62], and other methods [55, 63–65].
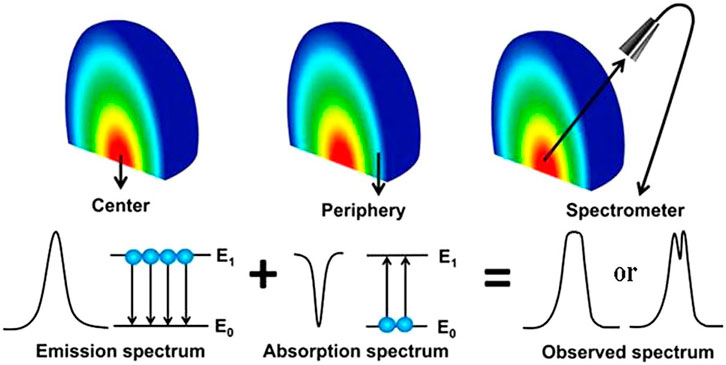
FIGURE 7. Self-absorption process in the plasma (Refs. [54, 55]). Reproduced with permission from [54], ©2019 Institute Of Physics; Reproduced with permission from [55], ©2015 Optical Society of America.
CF-LIBS was based on optically thin plasmas, without self-absorption. The electron temperature of the plasma was evaluated using the Boltzmann or Saha–Boltzmann plot, and the content of the elements in the sample was determined. Actually, inevitable self-absorption reduces the spectral intensity, resulting in an unrealistic higher value of the calculated plasma electron temperature, while the calculated intercept is lower.
4.2 Self-Absorbing Correction Improves the Accuracy of CF-LIBS
4.2.1 Curve of Growth
The curve of growth is a self-absorption correction model that can be applied to CF-LIBS to calculate plasma-related parameters in an iterative form based on the corrected experimental intensities. Gornushkin et al. first used the COG method for elemental analysis in stainless steel [66], establishing a Boltzmann plot for the iron ion lines with different laser energies, and the results showed that the higher the temperature, the higher was the excitation of the higher energy states. Bulajic applied the COG model to CF-LIBS and used it to correct for self-absorption, elucidating the effect of self-absorption on the line profile [67]. The self-absorption was corrected by the plasma electron temperature, electron number density, Gaussian broadening, Lorentzian broadening, and optical path length using the COG method. Three different steel and ternary alloy samples were used to validate the COG model. The precious alloy Au917 was used to create a Boltzmann plot without self-absorption correction and with the COG method after self-absorption correction, as shown in Figures 8, 9. It illustrates the findings of its quantitative analysis. The results demonstrated that the COG model could be applied with CF-LIBS, and the quantitative analysis results after self-absorption correction are very close to the certified values. Based on Bulajic’s method, Praher et al. investigated the relationship between line broadening and self-absorption and proposed a simplified model [68]. Alfarraj et al. used the COG model, number density N, and absorption path length l to calculate the optical depth and self-absorption of strontium and aluminum lines under various conditions of different laser energies, gate delay time, and gate width time [69]. The COG method has been demonstrated to effectively correct self-absorption to improve the LIBS analysis performance. Nevertheless, this method and its variants have high algorithmic complexity, limiting practical applications.
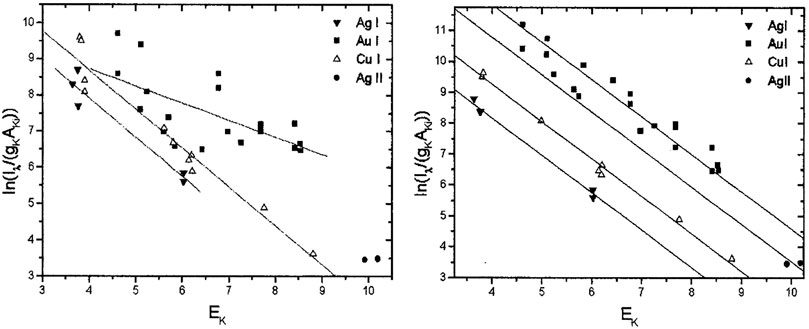
FIGURE 8. Boltzmann plot for precious alloy Au917 (without self-absorption corrections) and the Boltzmann plot for precious alloy Au917 (with self-absorption corrections). Reprinted from [67], Copyright (2002), with permission from Elsevier.
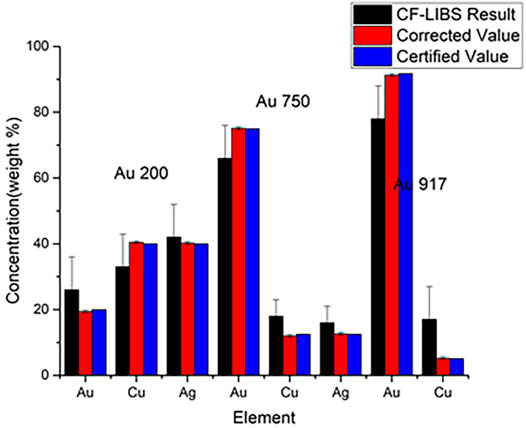
FIGURE 9. Quantitative analysis for precious alloys. Reprinted from [67], Copyright (2002), with permission from Elsevier.
4.2.2 Self-Absorption Coefficient
The so-called self-absorption coefficient method is to select an optically thin line (or
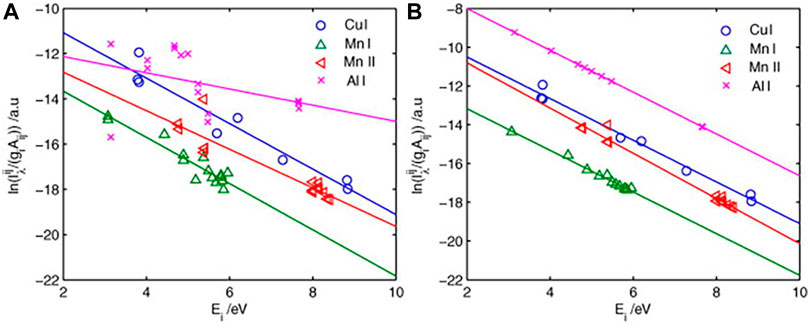
FIGURE 10. (A) Initial Boltzmann plot derived from the raw line intensity of the aluminum alloy sample. (B) Boltzmann plot corrected by the IRSAC for the aluminum alloy sample. Reprinted from [27], Copyright (2019), with permission from Elsevier.
The self-absorption coefficient can be also expressed as [77]
where
where
4.2.3 Microwave-Assisted Excitation and Geometrical optical Configuration
The mechanism of microwave-assisted excitation is similar to the LIBS method of stimulated absorption, where the ground-state atoms in the plasma absorb microwave energy coupled to near-field radiation and transition to a higher energy level state. By adjusting the position of the sample relative to the microwave radiator, sharper peaks and better profiles were observed [84], and the schematic diagram of the device is shown in Figure 11. Over a wide spectral range, the microwave-assisted approach can reduce multiple elemental self-absorption in LIBS. In addition, some exceptional geometries of optical systems can reduce the effects of self-absorption to a certain extent. In unusual parallel laser irradiation, the sample is ablated by a shockwave generated from the air breakdown plasma formed near the sample surface [61]; a dual pulse system with an orthogonal configuration of pre-ablation (the first pulse laser used to generate air breakdown plasma; the second laser is propagated perpendicular to the sample for sample ablation) and reheating models (the first laser is focused perpendicularly to the sample surface for sample plasma generation; the second laser propagated parallel to the sample for plasma heating) [85, 86]; the dual pulse system in collinear configuration [87, 88].
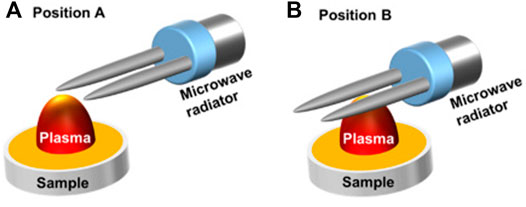
FIGURE 11. Schematic presentation of two different microwave radiator locations related to the laser plasma and the sample in measurements: the two needles of a microwave radiator located about 2 mm above the sample surface and (A) 0.5 mm horizontally away from the ablation spot; (B) a 5-mm horizontal pass away from the ablation spot. Reprinted with permission from [84], ©The Optical Society.
Although few people have studied the microwave-assisted and geometrical optical configuration in CF-LIBS, it gives us some inspiration to utilize the aforementioned methods in CF-LIBS.
5 Conclusion
Taking the matrix as part of the analysis interest, CF-LIBS can effectively avoid the matrix effect. It is based on basic assumptions of chemometric ablation, local thermal equilibrium, and optical thinness to describe the spectral intensity by mathematical models. The plasma electron temperature and elemental ratio are obtained by the slope and intercept of the Boltzmann plot. After normalization, the concentration of each element can be obtained. Generally speaking, the higher the linearity of the fitted lines for individual elements (same ionized state) and the more parallel the fitted lines for different elements, the higher will be the accuracy of the calculated results. The accuracy of the plasma electron temperature calculated by the Boltzmann plot method is low when only a small number of spectral lines of species in the same ionized state can be observed, or the corresponding energy level distribution range is small. The method of the Saha–Boltzmann plot was a modified method for solving this problem. CD-SB is another modified method, which can directly use atomic and ionic lines in the ground state. According to classical radiation theory, self-absorption exists. The self-absorption will inevitably affect the calculation of the plasma temperature and CF-LIBS accuracy. The methods for mitigating self-absorption are required, including the COG method, the self-absorption coefficient method, and the microwave-assisted and geometrical optical configuration methods. In recent years, CF-LIBS attracts increasing attention in a variety of fields, such as environmental protection, explorations of space, cultural heritage preservation, and geological survey.
Author Contributions
NZ completed the manuscript, TO acquired the right to the pictures, and MW, ZL, CL, and YQ completed the collection of manuscripts. JL and HY revised the manuscript and provided funding support. NZ and QZ provided supervision and funding support. All the authors discussed the structure of the manuscript and commented on the manuscript.
Funding
This work was supported by the Key-Area Research and Development Program of Guangdong Province (2020B090922006), the National Natural Science Foundation of China (62005081 and 62105105), the Guangdong Basic and Applied Basic Research Foundation (2021A1515011932, 2020A1515110985, and 2019A1515111120), the Science and Technology Program of Guangzhou (202002030165), the Featured Innovation Project of Guangdong Education Department (2019KTSCX034), the Young Scholar Foundation of South China Normal University (19KJ13), and the Special Funds for the Cultivation of Guangdong College Students’ Scientific and Technological Innovation (“Climbing Program” Special Funds) (pdjh2020b0153). Key R & D plan of Guangdong Province (2020B090924001), Natural Science Foundation of Top Talent of SZTU (2020103).
Conflict of Interest
The authors declare that the research was conducted in the absence of any commercial or financial relationships that could be construed as a potential conflict of interest.
Publisher’s Note
All claims expressed in this article are solely those of the authors and do not necessarily represent those of their affiliated organizations, or those of the publisher, the editors, and the reviewers. Any product that may be evaluated in this article, or claim that may be made by its manufacturer, is not guaranteed or endorsed by the publisher.
References
1. Ma Y, He Y, Tong Y, Yu X, Tittel FK. Quartz-tuning-fork Enhanced Photothermal Spectroscopy for Ultra-high Sensitive Trace Gas Detection. Opt Express (2018) 26:32103–10. doi:10.1364/oe.26.032103
2. Lang Z, Qiao S, Ma Y. Acoustic Microresonator Based In-Plane Quartz-Enhanced Photoacoustic Spectroscopy Sensor with a Line Interaction Mode. Opt Lett (2022) 47:1295–8. doi:10.1364/ol.452085
3. Yang K, Li H, Gong H, Shen X, Hao Q, Yan M, et al. Temperature Measurement Based on Adaptive Dual-Comb Absorption Spectral Detection. Chinese. Optic. Letter. (2020) 18:051401. doi:10.3788/col202018.051401
4.AW Miziolek, V Palleschi, and I Schechter, editors. Laser Induced Breakdown Spectroscopy. Cambridge University Press (2006).
5. Wu Y, Sawyer JC, Su L, Zhang Z. Quantitative Measurement of Electron Number in Nanosecond and Picosecond Laser-Induced Air Breakdown. J Appl Phys (2016) 119:173303. doi:10.1063/1.4948431
6. Yan C, Liang J, Zhao M, Zhang X, Zhang T, Li H. A Novel Hybrid Feature Selection Strategy in Quantitative Analysis of Laser-Induced Breakdown Spectroscopy. Analytica Chim Acta (2019) 1080:35–42. doi:10.1016/j.aca.2019.07.012
7. Samek O, Beddows D, Kaiser J, Kukhlevsky S, Liska M, Telle H, et al. Application of Laser-Induced Breakdown Spectroscopy to In Situ Analysis of Liquid Samples. Opt Eng (2000) 39.
8. Cahoon EM, Almirall JR. Quantitative Analysis of Liquids from Aerosols and Microdrops Using Laser Induced Breakdown Spectroscopy. Anal Chem (2012) 84:2239–44. doi:10.1021/ac202834j
9. Hanafi M, Omar MM, Gamal YEE-D. Study of Laser-Induced Breakdown Spectroscopy of Gases. Radiat Phys Chem (2000) 57:11–20. doi:10.1016/s0969-806x(99)00344-8
10. Sturm V, Noll R. Laser-induced Breakdown Spectroscopy of Gas Mixtures of Air, CO2, N2, and C3H8 for Simultaneous CHO, and N Measurement. Appl Opt (2003) 42:6221–5. doi:10.1364/ao.42.006221
11. Sabsabi M, Cielo P. Quantitative Analysis of Aluminum Alloys by Laser-Induced Breakdown Spectroscopy and Plasma Characterization. Appl Spectrosc (1995) 49:499–507. doi:10.1366/0003702953964408
12. Sattmann R, Sturm V, Noll R. Laser-induced Breakdown Spectroscopy of Steel Samples Using Multiple Q-Switch Nd:YAG Laser Pulses. J Phys D: Appl Phys (1995) 28:2181–7. doi:10.1088/0022-3727/28/10/030
13. Maravelaki PV, Zafiropulos V, Kilikoglou V, Kalaitzaki M, Fotakis C. Laser-induced Breakdown Spectroscopy as a Diagnostic Technique for the Laser Cleaning of marble. Spectrochimica Acta B: At Spectrosc (1997) 52:41–53. doi:10.1016/s0584-8547(96)01573-x
14. Klein S, Stratoudaki T, Zafiropulos V, Hildenhagen J, Dickmann K, Lehmkuhl T. Laser-induced Breakdown Spectroscopy for On-Line Control of Laser Cleaning of sandstone and Stained Glass. Appl Phys A: Mater Sci Process (1999) 69:441–4. doi:10.1007/s003390051029
15. Zhang Y, Zhang T, Li H. Application of Laser-Induced Breakdown Spectroscopy (LIBS) in Environmental Monitoring. Spectrochimica Acta Part B: At Spectrosc (2021) 181:106218. doi:10.1016/j.sab.2021.106218
16. Zhao NJ, Meng DS, Jia Y, Ma MJ, Fang L, Liu JG, et al. On-line Quantitative Analysis of Heavy Metals in Water Based on Laser-Induced Breakdown Spectroscopy. Opt Express (2019) 27:A495–A506. doi:10.1364/oe.27.00a495
17. Dell’Aglio M, De Giacomo A, Gaudiuso R, Pascale OD, Senesi GS, Longo S. Laser Induced Breakdown Spectroscopy Applications to Meteorites: Chemical Analysis and Composition Profiles. Geochimica et Cosmochimica Acta (2010) 74:7329. doi:10.1016/j.gca.2010.09.018
18. David G, Meslin P-Y, Dehouck E, Gasnault O, Cousin A, Forni O, et al. Laser-Induced Breakdown Spectroscopy (LIBS) Characterization of Granular Soils: Implications for ChemCam Analyses at Gale Crater, Mars. Icarus (2021) 365:114481. doi:10.1016/j.icarus.2021.114481
19. Gaudiuso R, Dell’Aglio M, De Pascale O, Loperfido S, Mangone A, De Giacomo A. Laser-induced Breakdown Spectroscopy of Archaeological Findings with Calibration-free Inverse Method: Comparison with Classical Laser-Induced Breakdown Spectroscopy and Conventional Techniques. Analytica Chim Acta (2014) 813:15–24. doi:10.1016/j.aca.2014.01.020
20. Gaudiuso R, Dell'Aglio M, De Pascale O, Santagata A, De Giacomo A. Laser-induced Plasma Analysis of Copper Alloys Based on Local Thermodynamic Equilibrium: An Alternative Approach to Plasma Temperature Determination and Archeometric Applications. Spectrochimica Acta Part B: At Spectrosc (2012) 74-75:38–45. doi:10.1016/j.sab.2012.06.034
21. Mohamed WTY. Study of the Matrix Effect on the Plasma Characterization of Six Elements in Aluminum Alloys Using LIBS with a Portable Echelle Spectrometer. Prog Phys (2007) 2:42–48.
22. Xu W, Sun C, Tan Y, Gao L, Zhang Y, Yue Z, et al. Total Alkali Silica Classification of Rocks with LIBS: Influences of the Chemical and Physical Matrix Effects. J Anal Spectrom (2020) 35:1641–53. doi:10.1039/d0ja00157k
23. Ciucci A, Corsi M, Palleschi V, Rastelli S, Salvetti A, Tognoni E. New Procedure for Quantitative Elemental Analysis by Laser-Induced Plasma Spectroscopy. Appl Spectrosc (1999) 53:960–4. doi:10.1366/0003702991947612
24. Kaiser J, Novotný K, Martin MZ, Hrdlička A, Malina R, Hartl M, et al. Trace Elemental Analysis by Laser-Induced Breakdown Spectroscopy-Biological Applications. Surf Sci Rep (2012) 67:233–43. doi:10.1016/j.surfrep.2012.09.001
25. Loureiro J, Amorim J. Kinetics and Spectroscopy of Low Temperature Plasmas. Berlin: Springer (2016).
26. Tognoni E, Cristoforetti G, Legnaioli S, Palleschi V. Calibration-Free Laser-Induced Breakdown Spectroscopy: State of the Art. Spectrochimica Acta Part B: At Spectrosc (2010) 65:1–14. doi:10.1016/j.sab.2009.11.006
27. Sun L, Yu H. Correction of Self-Absorption Effect in Calibration-free Laser-Induced Breakdown Spectroscopy by an Internal Reference Method. Talanta (2009) 79:388–95. doi:10.1016/j.talanta.2009.03.066
28. Wang Y, Chen Y, Li R, Kang J, Gao J. Quantitative Elemental Analysis of Aluminum Alloys with One-point Calibration High Repetition Rate Laser-Ablation Spark-Induced Breakdown Spectroscopy. J Anal Spectrom (2021) 36:314–21. doi:10.1039/d0ja00398k
29. De Giacomo A, Gaudiuso R, Dell'Aglio M, Santagata A. The Role of Continuum Radiation in Laser Induced Plasma Spectroscopy. Spectrochimica Acta Part B: At Spectrosc (2010) 65:385–94. doi:10.1016/j.sab.2010.03.016
30. Ahmed N, Ahmed R, Rafiqe M, Baig MA. A Comparative Study of Cu-Ni Alloy Using LIBS, LA-TOF, EDX, and XRF. Laser Part Beams (2016) 35:1–9. doi:10.1017/s0263034616000732
31. Fu H, Ni Z, Wang H, Jia J, Dong F. Accuracy Improvement of Calibration-free Laser-Induced Breakdown Spectroscopy. Plasma Sci Technol (2018) 21:034001. doi:10.1088/2058-6272/aaead6
33. Khadr MH, Elgala H. Augmented Communications: Spectral Efficiency and Security Enhanced Visible Light Communications by Design. Chinese. Optic.Letter. (2020) 18:090601. doi:10.3788/col202018.090601
34. Taschuk MT, Godwal Y, Tsui YY, Fedosejevs R, Tripathi M, Kearton B. Absolute Characterization of Laser-Induced Breakdown Spectroscopy Detection Systems. Spectrochimica Acta Part B: At Spectrosc (2008) 63:525–35. doi:10.1016/j.sab.2008.01.004
35. Fahad M, Farooq Z, Abrar M, Shah KH, Iqbal T, Saeed S. Elemental Analysis of limestone by Laser-Induced Breakdown Spectroscopy, Scanning Electron Microscopy Coupled with Energy Dispersive X-ray Spectroscopy and Electron Probe Microanalysis. Laser Phys (2018) 28:125701. doi:10.1088/1555-6611/aae49d
36. Pandhija S, Rai AK. In Situ multielemental Monitoring in Coral Skeleton by CF-LIBS. Appl Phys B (2009) 94:545–52. doi:10.1007/s00340-008-3343-5
37. Pandhija S, Rai NK, Rai AK, Thakur SN. Contaminant Concentration in Environmental Samples Using LIBS and CF-LIBS. Appl Phys B (2010) 98:231–41. doi:10.1007/s00340-009-3763-x
38. Kumar R, Rai AK, Alamelu D, Aggarwal SK. Monitoring of Toxic Elements Present in Sludge of Industrial Waste Using CF-LIBS. Environ Monit Assess (2013) 185:171–80. doi:10.1007/s10661-012-2541-0
39. Agrawal R, Kumar R, Rai S, Pathak AK, Rai AK, Rai GK. LIBS: A Quality Control Tool for Food Supplements. Food Biophys (2011) 6:527–33. doi:10.1007/s11483-011-9235-y
40. Du Y, Wang Q, Yang R, Cui X. Quantitative Determination of Hydrogen Isotope in Titanium Using LIBS. SPIE (2019).
41. Ahmed N, Ahmed R, Baig MA. Analytical Analysis of Different Karats of Gold Using Laser Induced Breakdown Spectroscopy (LIBS) and Laser Ablation Time of Flight Mass Spectrometer (LA-TOF-MS). Plasma Chem Plasma Process (2018) 38:207–22. doi:10.1007/s11090-017-9862-2
42. Hamad TK, et al. Calibration Free Laser Induced Breakdown Spectroscopy (CF-LIBS) as a Tool for Quantitative Elemental Analysis of Iraqi Cement. Anjs (2018) 1:60–8. doi:10.22401/sic.i.08
43. Springer-Verlag , Yalcin S, Crosley D, Smith G, Faris G. Influence of Ambient Conditions on the Laser Air Spark. Appl Phys B (1999) 68:121. doi:10.1007/s003400050596
44. Horňáčková M, Horňáček M, Rakovský J, Hudec P, Veis P. Determination of Si/Al Molar Ratios in Microporous Zeolites Using Calibration-free Laser Induced Breakdown Spectroscopy. Spectrochimica Acta Part B: At Spectrosc (2013) 88:69. doi:10.1016/j.sab.2013.03.006
45. Zhang S, Hu Z, Zhao Z, Chen F, Tang Y, Sheng Z, et al. Quantitative Analysis of mineral Elements in Hair and Nails Using Calibration-free Laser-Induced Breakdown Spectroscopy. Optik (2021) 242:167067. doi:10.1016/j.ijleo.2021.167067
46. Veis P, Marín-Roldán A, Dwivedi V, Karhunen J, Paris P, Jõgi I, et al. Quantification of H/D Content in Be/W Mixtures Coatings by CF-LIBS. Phys Scr (2020) 2020:014073. doi:10.1088/1402-4896/ab7ebd
47. Pribula M, Krištof J, Suchoňová M, Horňáčková M, Plavčan J, Hakola A, et al. Use of the Near Vacuum UV Spectral Range for the Analysis of W-Based Materials for Fusion Applications Using LIBS. Phys Scr (2016) T167:014045. doi:10.1088/0031-8949/t167/1/014045
48. Marín Roldán A, Pisarčík M, Veis M, Držík M, Veis P. Calibration-free Analysis of a Tungsten-Based Target for Diagnostics of Relevant Fusion Materials Comparing Picosecond and Nanosecond LIBS. Spectrochimica Acta Part B: At Spectrosc (2021) 177:106055. doi:10.1016/j.sab.2020.106055
49. Horňáčková M, Veis P. Analysis of Acid Pitchstone (Iceland) Using Laser Induced Breakdown Spectroscopy. LIBS (2013) 18:1–8.
50. Wang Y, Su M, Sun D, Wu C, Zhang X, Lu Q, et al. Comparative Study of Magnesium and Calcium in Codonopsis Pilosula Samples Detected by CF-LIBS and LCGD-AES. Microchemical J (2018) 137:318–23. doi:10.1016/j.microc.2017.11.011
51. Cristoforetti G, Tognoni E. Calculation of Elemental Columnar Density from Self-Absorbed Lines in Laser-Induced Breakdown Spectroscopy: A Resource for Quantitative Analysis. Spectrochimica Acta Part B: At Spectrosc (2013) 79-80:63–71. doi:10.1016/j.sab.2012.11.010
52. Safi A, Tavassoli SH, Cristoforetti G, Legnaioli S, Palleschi V, Rezaei F, et al. Determination of Excitation Temperature in Laser-Induced Plasmas Using Columnar Density Saha-Boltzmann Plot. J Adv Res (2019) 18:1–7. doi:10.1016/j.jare.2019.01.008
53. Hu Z, Chen F, Zhang D, Chu Y, Wang W, Tang Y, et al. A Method for Improving the Accuracy of Calibration-free Laser-Induced Breakdown Spectroscopy by Exploiting Self-Absorption. Analytica Chim Acta (2021) 1183:339008. doi:10.1016/j.aca.2021.339008
54. Hou J, Zhang L, Zhao Y, Wang Z, Zhang Y, Ma W, et al. Mechanisms and Efficient Elimination Approaches of Self-Absorption in LIBS. Plasma Sci Technol (2019) 21:034016. doi:10.1088/2058-6272/aaf875
55. Li J-M, Guo L-B, Li C-M, Zhao N, Yang X-Y, Hao Z-Q, et al. Self-absorption Reduction in Laser-Induced Breakdown Spectroscopy Using Laser-Stimulated Absorption. Opt Lett (2015) 40:5224–6. doi:10.1364/ol.40.005224
56. Yi R, Guo L, Li C, Yang X, Li J, Li X, et al. Investigation of the Self-Absorption Effect Using Spatially Resolved Laser-Induced Breakdown Spectroscopy. J Anal Spectrom (2016) 31:961–7. doi:10.1039/c5ja00500k
57. Rezaei F, Karimi P, Tavassoli SH. Estimation of Self-Absorption Effect on Aluminum Emission in the Presence of Different noble Gases: Comparison between Thin and Thick Plasma Emission. Appl Opt (2013) 52:5088–96. doi:10.1364/ao.52.005088
58. Hou J, Zhang L, Yin W, Yao S, Zhao Y, Ma W, et al. Development and Performance Evaluation of Self-absorption-free Laser-Induced Breakdown Spectroscopy for Directly Capturing Optically Thin Spectral Line and Realizing Accurate Chemical Composition Measurements. Opt Express (2017) 25:23024–34. doi:10.1364/oe.25.023024
59. Ibano K, Nishijima D, Ueda Y, Doerner RP. LIBS Measurement of Trace Tantalum and Rhenium in Tungsten for In-Situ Diagnostic of Nuclear Transmutation. J Nucl Mater (2019) 522:324–8. doi:10.1016/j.jnucmat.2019.05.030
60. Effenberger A, Scott J. Effect of Atmospheric Conditions on LIBS Spectra. Sensors (2010) 10:4907–25. doi:10.3390/s100504907
61. Pardede M, Karnadi I, Lie ZS, Jobiliong E, Tanra I, Hedwig R, et al. Unusual Parallel Laser Irradiation for Suppressing Self-Absorption in Single Pulse Laser-Induced Breakdown Spectroscopy. Opt Express (2021) 29:22593–602. doi:10.1364/oe.431784
62. Karnadi I, Pardede M, Tanra I, Hedwig R, Marpaung AM, Lie ZS, et al. Suppression of Self-Absorption in Laser-Induced Breakdown Spectroscopy Using a Double Pulse Orthogonal Configuration to Create Vacuum-like Conditions in Atmospheric Air Pressure. Sci Rep (2020) 10:13278. doi:10.1038/s41598-020-70151-6
63. Tang Y, Ma S, Yuan R, Ma Y, Sheng W, Zhan S, et al. Spectral Interference Elimination and Self-Absorption Reduction in Laser-Induced Breakdown Spectroscopy Assisted with Laser-Stimulated Absorption. Opt Lasers Eng (2020) 134:106254. doi:10.1016/j.optlaseng.2020.106254
64. Viljanen J, Sun Z, Alwahabi ZT. Microwave Assisted Laser-Induced Breakdown Spectroscopy at Ambient Conditions. Spectrochimica Acta Part B: At Spectrosc (2016) 118:29–36. doi:10.1016/j.sab.2016.02.002
65. Viljanen J, Zhao H, Zhang Z, Toivonen J, Alwahabi ZT. Real-time Release of Na, K and Ca during thermal Conversion of Biomass Using Quantitative Microwave-Assisted Laser-Induced Breakdown Spectroscopy. Spectrochimica Acta Part B: At Spectrosc (2018) 149:76–83. doi:10.1016/j.sab.2018.07.022
66. Gornushkin IB, Anzano JM, King LA, Smith BW, Omenetto N, Winefordner JD. Curve of Growth Methodology Applied to Laser-Induced Plasma Emission Spectroscopy. Spectrochimica Acta Part B: At Spectrosc (1999) 54:491–503. doi:10.1016/s0584-8547(99)00004-x
67. Bulajic D, Corsi M, Cristoforetti G, Legnaioli S, Palleschi V, Salvetti A, et al. A Procedure for Correcting Self-Absorption in Calibration Free-Laser Induced Breakdown Spectroscopy. Spectrochimica Acta Part B: At Spectrosc (2002) 57:339–53. doi:10.1016/s0584-8547(01)00398-6
68. Praher B, Palleschi V, Viskup R, Heitz J, Pedarnig JD. Calibration Free Laser-Induced Breakdown Spectroscopy of Oxide Materials. Spectrochimica Acta Part B: At Spectrosc (2010) 65:671–9. doi:10.1016/j.sab.2010.03.010
69. Alfarraj BA, Bhatt CR, Yueh FY, Singh JP. Evaluation of Optical Depths and Self-Absorption of Strontium and Aluminum Emission Lines in Laser-Induced Breakdown Spectroscopy (LIBS). Appl Spectrosc (2017) 71:640–50. doi:10.1177/0003702817693231
70. Shakeel H, Haq SU, Aisha G, Nadeem A. Quantitative Analysis of Al-Si alloy Using Calibration Free Laser Induced Breakdown Spectroscopy (CF-LIBS). Phys Plasmas (2017) 24:063516. doi:10.1063/1.4985327
71. Unnikrishnan VK, Mridul K, Nayak R, Alti K, Kartha VB, Santhosh C, et al. Calibration-free Laser-Induced Breakdown Spectroscopy for Quantitative Elemental Analysis of Materials. Pramana - J Phys (2012) 79:299–310. doi:10.1007/s12043-012-0298-1
72. Hou JJ, Zhang L, Zhao Y, Ma WG, Dong L, Yin WB, et al. Rapid Selection of Analytical Lines for SAF-LIBS Based on the Doublet Intensity Ratios at the Initial and Final Stages of Plasma. Opt Express (2019) 27:32184–92. doi:10.1364/oe.27.032184
73. Ahmed N, Abdullah M, Ahmed R, Piracha NK, Baig MA. Quantitative Analysis of a Brass alloy Using CF-LIBS and a Laser Ablation Time-Of-Flight Mass Spectrometer. Laser Phys (2017) 28:016002. doi:10.1088/1555-6611/aa962b
74. Dong J, Liang L, Wei J, Tang H, Zhang T, Yang X, et al. A Method for Improving the Accuracy of Calibration-free Laser-Induced Breakdown Spectroscopy (CF-LIBS) Using Determined Plasma Temperature by Genetic Algorithm (GA). J Anal Spectrom (2015) 30:1336–44. doi:10.1039/c4ja00470a
75. Aydin Ü, Roth P, Gehlen CD, Noll R. Spectral Line Selection for Time-Resolved Investigations of Laser-Induced Plasmas by an Iterative Boltzmann Plot Method. Spectrochimica Acta Part B: At Spectrosc (2008) 63:1060–5. doi:10.1016/j.sab.2008.08.003
76. Yang J, Li X, Xu J, Ma X. A Calibration-free Laser-Induced Breakdown Spectroscopy (CF-LIBS) Quantitative Analysis Method Based on the Auto-Selection of an Internal Reference Line and Optimized Estimation of Plasma Temperature. Appl Spectrosc (2018) 72:129–40. doi:10.1177/0003702817734293
77. El Sherbini AM, El Sherbini TM, Hegazy H, Cristoforetti G, Legnaioli S, Palleschi V, et al. Evaluation of Self-Absorption Coefficients of Aluminum Emission Lines in Laser-Induced Breakdown Spectroscopy Measurements. Spectrochimica Acta Part B: At Spectrosc (2005) 60:1573–9. doi:10.1016/j.sab.2005.10.011
78. Konjević N, Wiese WL. Experimental Stark Widths and Shifts for Spectral Lines of Neutral and Ionized Atoms. J Phys Chem Reference Data (1990) 19:1307
79. Stark-b . Available at: http://stark-b.obspm.fr/index.php/table. Accessed 1 March, 2022.
81. Mansour SAM. Self-Absorption Effects on Electron Temperature-Measurements Utilizing Laser Induced Breakdown Spectroscopy (LIBS)-Techniques. Opt Photon J (2015) 03:12. doi:10.4236/opj.2015.53007
82. Iqbal SMZ, Uddin Z, Umar ZA, Ahmed N, Ahmed R, Baig MA. Analysis of Lakhra Coal by Calibration Free Laser-Induced Breakdown Spectroscopy (CF-LIBS) and Comparison of Self-Absorption Correction Procedures. Anal Lett (2021) 1–13. doi:10.1080/00032719.2021.1910831
83. Yang Y, Hao X, Ren L. Correction of Self-Absorption Effect in Calibration-free Laser-Induced Breakdown spectroscopy(CF-LIBS) by Considering Plasma Temperature and Electron Density. Optik (2020) 208:163702. doi:10.1016/j.ijleo.2019.163702
84. Tang Y, Li J, Hao Z, Tang S, Zhu Z, Guo L, et al. Multielemental Self-Absorption Reduction in Laser-Induced Breakdown Spectroscopy by Using Microwave-Assisted Excitation. Opt Express (2018) 26:12121–30. doi:10.1364/oe.26.012121
85. Ma Y, Zhang W, Xiong Z, Cui H, Li Q, Zhou R, et al. Accurate Sulfur Determination of Coal Using Double-Pulse Laser-Induced Breakdown Spectroscopy. J Anal Spectrom (2020) 35:1458–63. doi:10.1039/c9ja00448c
86. Gautier C, Fichet P, Menut D, Lacour J-L, L'Hermite D, Dubessy J. Quantification of the Intensity Enhancements for the Double-Pulse Laser-Induced Breakdown Spectroscopy in the Orthogonal Beam Geometry. Spectrochimica Acta Part B: At Spectrosc (2005) 60:265–76. doi:10.1016/j.sab.2005.01.006
87. Maher WE, Hall RB. Experimental Study of Effects from Two Laser Pulses. J Appl Phys (1976) 47:2486–93. doi:10.1063/1.322963
Keywords: CF-LIBS, quantitative analysis, elemental analysis, self-absorption effect, applications
Citation: Zhang N, Ou T, Wang M, Lin Z, Lv C, Qin Y, Li J, Yang H, Zhao N and Zhang Q (2022) A Brief Review of Calibration-Free Laser-Induced Breakdown Spectroscopy. Front. Phys. 10:887171. doi: 10.3389/fphy.2022.887171
Received: 02 March 2022; Accepted: 27 April 2022;
Published: 01 June 2022.
Edited by:
Qun Hao, Beijing Institute of Technology, ChinaReviewed by:
Jayr Amorim, Instituto de Tecnologia da Aeronáutica (ITA), BrazilYingbin Xing, Huazhong University of Science and Technology, China
Copyright © 2022 Zhang, Ou, Wang, Lin, Lv, Qin, Li, Yang, Zhao and Zhang. This is an open-access article distributed under the terms of the Creative Commons Attribution License (CC BY). The use, distribution or reproduction in other forums is permitted, provided the original author(s) and the copyright owner(s) are credited and that the original publication in this journal is cited, in accordance with accepted academic practice. No use, distribution or reproduction is permitted which does not comply with these terms.
*Correspondence: Jiaming Li, am1saUBtLnNjbnUuZWR1LmNu; Huan Yang, eWFuZ2h1YW5Ac3p0dS5lZHUuY24=