- 1School of Electrical Engineering, Southeast University, Nanjing, China
- 2Key Laboratory of Smart Grid Technology and Equipment of Jiangsu Province, Nanjing, China
- 3College of Mathematics and Statistics, Xuzhou University of Technology, Xuzhou, China
The increase in global natural disasters, emergencies, and terrorist attacks brings great challenges to the flexible operation of power grids. The research on the flexibility of power grids becomes more and more important. At the same time, the rapid development of renewable energy and smart grids also provides new opportunities for research of flexible power grids. Based on the dynamic inoperability input–output model (DIIM), this study creatively uses the node transmission power to represent the relationship between nodes in the power grid and then studies the resilience measurement of the power grid. First, the significance of studying power grid resilience is discussed, and the absorption and recovery capacity of power grid resilience is described. Second, the power grid resilience measurement model based on the DIIM is established, and a theoretical analysis is carried out. Using the characteristics of inoperability, the power grid resilience is measured from the time aspect, and the characteristics of the model are analyzed at the same time. On the basis of theoretical analysis, this study also provides a control strategy to improve the grid resilience, which has good convenience and applicability. Finally, the theoretical analysis method is applied to a power grid example, and the correctness and effectiveness are verified. The measurement model can intuitively display the resilience characteristics of power grids and provide theoretical support for management and emergency response.
1 Introduction
In recent years, unpredictable events such as large-scale grid connection of renewable energy, disorderly charging of electric vehicles, and severe disastrous weather have had an increasingly serious impact on the traditional power grid [1], which will undoubtedly aggravate the vulnerability of power grid operation [2]. This requires the power grid to have enough regulation ability to deal with this uncertainty and imbalance. Therefore, the concepts of “flexibility” and “resilience” of the power grid have been put forward one after another and have attracted the attention of researchers and engineering circles [3, 4]. The “flexibility” and “resilience” of the power grid are not the same concept. Flexibility mainly refers to the flexible and adjustable ability of the power grid, and resilience mainly refers to the ability of the power grid to resist extreme events [5, 6]. This study will mainly study the resilience measurement of the power grid.
In this study, the power grid resilience is defined as follows: when the power grid deals with faults or unexpected events, it can recover the inoperability through self-healing ability or network reconstruction so that the network system can recover to a new operating state. Among them, inoperability represents the decline degree of system functions. It is a continuous variable that varies from 0 to 1. Inoperability can be used to evaluate a variety of performances of the system. The main cause of power grid vulnerability caused by equipment short circuit and disconnection lies in the interconnection and coupling relationship between system nodes. Because of the interconnection between nodes, the impact on any node may transfer the disadvantage to other nodes along the power grid, resulting in a chain reaction. For power grid resilience measurement, understanding the transitivity between nodes and how the transitivity affects other nodes and then the whole network has become an important content of power grid resilience measurement. The research on the resilience measurement of the power grid requires the numerical calculation and solution of the system mathematical model, which involves the analysis and establishment of complex mathematical equations. Researchers have also proposed many analysis methods of complex mathematical equations [7–13], but these methods are not fully applicable to the resilience measurement analysis of the power grid. Therefore, this study proposes a new method to measure the resilience of the power grid based on the DIIM.
At present, the research on network resilience mainly focuses on complex systems and complex networks [14]. It is generally believed that the ability of performance recovery after system failure represents the anti-interference ability and recovery ability of the system. In [15], the DIIM was used to measure the resilience of the supply network in enterprise operation and analyzed from the aspects of time, space, and cost. In [16], the input–output model was used to estimate the internal operability of large-scale systems, and the IIM was also used to calculate the high-order impact from attack to vulnerability. Facing the increasingly frequent disaster events, in [17], the solution to restore the resilience of the distribution network by using multiple microcontrollers was studied and a model was given to express the research on the resilience of the distribution network. In [18], the resilience of the distribution network to extreme disasters under severe disturbance was studied. The kernel density estimation method is used in the analysis, but the corresponding control measures to improve the resilience were not given. To improve the operation security of the power grid, in [19], the concept of transmission network operation elastic space was provided and two modeling methods to optimize the economic dispatching of the elastic space were also provided. To evaluate the impact of storm disaster on the distribution network, in [20], the resilience index of the distribution network was given and the resilience of important components was evaluated but a mechanistic explanation was not given. The aforementioned research studies described the resilience of the network. There was still no clear system method to measure the resilience. In the time domain, there was no strategy to measure the resilience of the power grid, and the quantitative analysis of resilience was still not well-solved. To study and improve the resilience of the power grid, we must first make a quantitative analysis of resilience so as to provide an organic solution and provide guidance for power grid operators. Therefore, we should combine the actual characteristics of the power grid and provide a method to measure the resilience, which is the basis of this research.
To reduce the large-scale power outage caused by extreme disasters and severe disturbances, it is necessary to take corresponding control measures to improve the resilience of the power grid. Some researchers have analyzed the control measures to improve the flexibility of the power grid from the perspective of power grid topology, but the convenience is not satisfactory. In [21, 22], measures such as strengthening lines, building double circuit lines, and improved fault repair speed to strengthen the toughness and resilience of the power grid are given. Using the three-stage optimization model, [23] gave the optimal location of reinforcement elements and reinforcement strategies to improve the resilience of the power grid. For extreme disturbance events that may occur in the power grid, the index system for evaluating the resilience of the distribution network is given in [24]. In [25], the ability of the power grid to deal with extreme disturbances was shown to be improved and the network resilience was enhanced through measures such as system grid optimization, optimal configuration of emergency power supply, and maintenance strategy of system lines. These studies analyzed the measures to improve the resilience of the power grid from the perspective of topology, without considering the problems of cost and convenience and lack of considering the more complex node relationship in the power grid. Therefore, on the basis of studying power grid resilience, fully considering the connection relationship of power grid nodes and seeking convenient and effective control strategies to improve the power grid resilience have become the key points of the research.
To solve these problems, based on the DIIM, this study provides a method to measure the connection relationship between the nodes, provides a method to measure the resilience of the power grid in the time-domain, and studies the strategy to improve the resilience. This study proposes that the coupling relationship between the nodes is measured by the transmission power between them, and then an analysis model based on the DIIM is established. In this study, the level of inoperability (defined as the level that does not realize its expected function) is used to characterize the operation level of the grid nodes. The meaning of inoperability indicates the degree of transmission power decline after the grid is disturbed.
The rest of the study is organized as follows: Section 2 describes the DIIM used to measure the resilience of the power grid. Based on this model, this study mines the resilience space of the power grid, gives the application method of the model, and uses the given method to measure the resilience level of the power grid. Sections 3 proposes a specific example to illustrate how to use the DIIM to measure power grid resilience and the corresponding control strategy is also given to improve power grid resilience and the operation level. In the simulation example, a variety of working conditions are considered to verify the effectiveness and robustness of the measurement method given, while Sections 4 concludes this study.
2 Application Analysis of the Dynamic Inoperability Input–Output Model
2.1 Input–Output Model
The resilience measurement of the power grid needs to consider the complex interdependence between nodes. The IIM is an effective tool for the loss and risk assessment of the grid with complex interdependence. The IIM mainly takes the fault of a node as the input and the operability of each node as the output [15] and then analyzes the chain reaction to the other nodes of the system under emergency so as to measure the resilience of the whole system under the fault.
Leontief, the earliest Nobel Laureate in economics, proposed the input–output model [26], which is used to analyze the correlation between different connection points of the complex network system, as shown in the following formula:
where h represents the vector of the inoperability level at which the system performance is degraded by disturbance, b* is the disturbance vector of the final demand, and M* is the incidence matrix derived from input–output data.
This model belongs to the static inoperable input–output model, which is not enough to describe the characteristics of the network system over time. Therefore, Lian and Haimes extended the demand-driven static inoperable input–output model to the demand-driven dynamic model [27, 28] and conducted a dynamic analysis on the closely related system network after a major attack. There is a complex coupling relationship between the power system network nodes. After being disturbed by different types of disturbances, the system network changes become more complex with time, and the characteristics that change with time need to be studied. Therefore, based on this research, this study presents a DIIM to analyze the resilience measurement of the power grid.
2.2 Resilience Description of the Power Grid
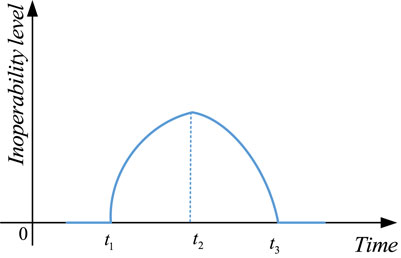
Based on the inoperability model, this study presents the representation method of power grid resilience, in which non-operability represents the degree of system function decline and the inoperability value changes from 0 to 1. If the value is 0, the network system is in good condition and can transmit power normally; if the value is 1, the power grid system crashes, as shown in Figure 1.
In Figure 1, the time period 0∼t1 is called the network response delay time, which reflects the tolerance of the power grid to accidents. Time t1∼t2 indicates the time when the network is spread by the accident. The longer the width, the longer will be the time to reach the maximum operability and the stronger the ability of the network will be to resist damage. t2∼t3 represents the recovery time of the power grid. The smaller the width, the shorter the time will be for the network to recover its operability. The shorter the time period, the stronger will be the recovery ability of the power grid. In the actual power system, the recovery ability of the power grid comprises the recovery ability of the nodes themselves and the associated recovery ability between the nodes. The curve height of the ordinate reflects the inoperability level of the network caused by accidents. The lower the height, the smaller the inoperability will be.
The aforementioned description of network resilience based on inoperability expresses the time-response characteristics of the network after being disturbed and shows the recovery ability, anti-interference ability, and response ability of the power grid after being disturbed. Combined with the corresponding analysis model [29], it can effectively measure and analyze the power grid resilience.
2.3 Dynamic Inoperability Input–Output Model of the Power Grid
The IIM describes the interdependence between nodes in the network. The traditional static IIM does not consider the time factor, which is not enough to describe the change in power grid resilience with time. The power grid resilience needs to be considered from the perspective of time to comprehensively analyze the time-varying resilience of the power grid under different disturbances. Therefore, based on the IIM, considering the time factor, this part gives the power grid resilience measurement analysis method of the DIIM.
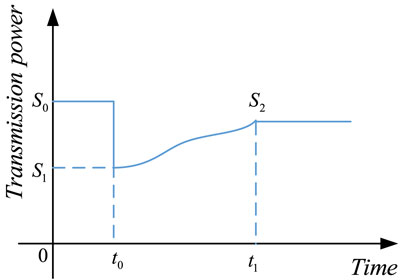
In the power grid, the nodes are connected with each other, and the power is transmitted through the connection between the nodes, so the coupling relationship of the network is established. Based on the DIIM, the interdependence between nodes in the system is expressed by the transmission power between the nodes, and the correlation matrix between the nodes is established to establish a model suitable for the measurement of network resilience of the power system. As shown in Figure 2, the original normal power transmission capacity of the network system is S0. When the power grid is subject to severe disturbance at time t0, the transmission power is reduced from S0 to S1. After appropriate measures are taken, the new transmission power level S2 is reached at time t1. The resilience of the power grid is shown in the change process from time t0 to t1.
Let the energy flow matrix of power be Y = (yij)nⅹn, where yij represents the power transmitted from the ith node to the jth node. The interdependence matrix M = (mij) = ( yij/yj), where mij is a continuous variable called the correlation coefficient of system nodes, mij∈ [0, 1]; yj represents the total power of node j; and mij represents the interdependence between the nodes. If mij = 0, it means that the nodes do not have power exchange between nodes i and j, that is, the nodes are not directly connected. If mij = 1, it means that nodes i and j are closely connected. The collapse of node j after being disturbed by emergencies will inevitably lead to the collapse of node i. Thus, the correlation matrix M* describing the system network topology can be obtained, which is expressed as follows:
where
Before and after the disturbance, the transmission power level between nodes i and j is expressed as follows:
where Sij represents the transmission power from the ith node to the jth node before the disturbance.
Therefore, h and b* in Formula (1) can be further expressed as follows:
where
The pre-disturbance level
where Sii represents the output power of node i before disturbance;
Based on the analysis model [16], the general expression describing the DIIM of the power grid is obtained as follows:
where ki is the resilience coefficient and K is the resilience coefficient matrix.
In the quantitative analysis of resilience measurement, Eq. 7 is a first-order differential equation, and the general solution can be expressed as follows:
The solution of the equation is based on the DIIM, which reflects the ability of the power grid resilience to deal with disturbances. In the time-domain, it also reflects the physical process through which the power grid is disturbed and changes to the equilibrium state through the restoration ability.
2.4 Resilience Measurement and Recovery Control of the Power Grid
In this section, the resilience measurement and recovery control strategy of the power grid using the DIIM will be explained. Let the initial disturbance H (0) > 0 and the disturbance b* = 0 caused by the node itself, an equation is obtained from Formula (8) as follows:
Assuming that after the disturbance occurs, the initial disturbance Hi(0) > 0 of node i and no disturbance of other relevant nodes, that is, Hj (0) = 0,j≠i. The recovery trajectory of node i after disturbance is given by Eq. 9 as follows:
where ki represents the association recovery rate of node i.
Let node i recover its initial inoperability level from Hi(0) during a disturbance to Hi(ti) after time ti, and then the correlation resilience coefficient ki of each node of the power grid can be obtained. After the network system is disturbed, there is certain recovery ability between the nodes themselves. ki shows the adaptive ability of the node in the power grid. The expression is shown as follows:
Among them, ri that can represent the power grid recovery capability is expressed as follows:
The larger the ri, the faster the recovery will be.
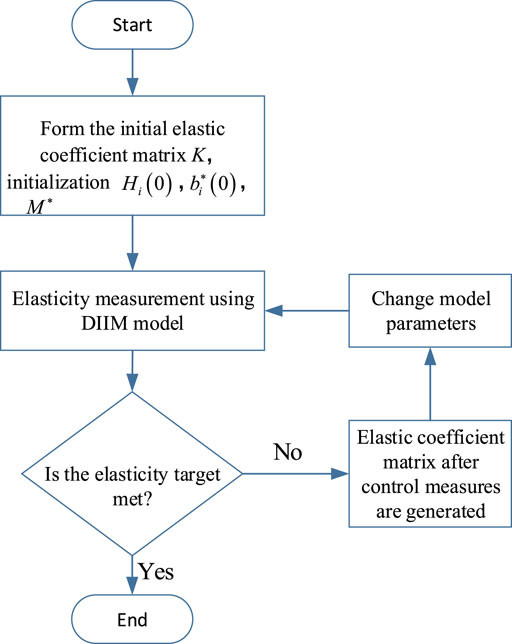
According to the aforementioned DIIM theory and application analysis, the analysis steps of resilience measurement in the power grid are as follows:
1) Assuming that the initial state of the power grid is not disturbed, the network power flow matrix Y and the correlation matrix M* are determined.
2) According to the power transmission capacity of each node in the network, the initial elastic coefficient ki0 of each node is determined.
3) After the network is disturbed, the initial inoperability level Hi(0) of any node i and its own initial disturbance
4) According to the given DIIM of the power grid, the resilience of the power grid is measured.
5) After adopting the corresponding control measures, the elastic coefficient ki and correlation matrix M*are changed.
6) The new parameters are substituted into the DIIM again to measure the resilience, which can verify the effectiveness of the measures taken.
The flow chart is shown in Figure 3.
3 Numerical Studies
The experimental running environment is the Windows 10 (64 bit) operating system. The hardware configuration of the experimental workstation is Intel i5-4210 1.7GHz, dual-core CPU, and 8 GB memory. The algorithm is written in MATLAB. In the simulation calculation, this study adopts a variety of working conditions and compares the calculation results so as to fully show the correctness and robustness of the analysis method proposed in this study.
This study takes the IEEE-30 node distribution network as an example, as shown in Figure 4.
1) K is the node resilience coefficient matrix, and the initial resilience coefficient is set to 0.1.
2) M is the interdependence matrix, and its mij value changes with the change in connection line structure and transmission power between nodes.
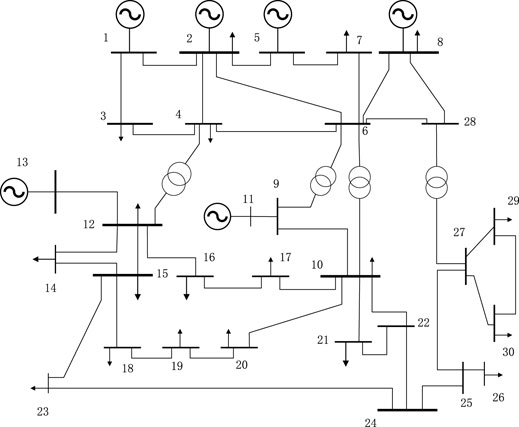
FIGURE 4. IEEE-30 node power grid system diagram. In the initial stage, the following assumptions are made.
Since the main research purpose of this study is to analyze and evaluate the resilience of the power grid, the power grid is often affected by different external disturbances in the actual operation. When the system is subject to different disturbances, the simulation calculation will be carried out.
3.1 Case 1
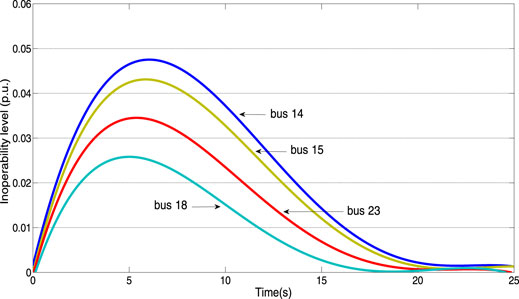
Fault setting: in this case, load nodes 14 and 15 suddenly increase the load by 50%. The change of node inoperability with time is shown in Figure 5.
The calculation results in Figure 5 show that nodes 14 and 15 fluctuate most obviously. Because of the large load change, nodes 23 and 18 also fluctuate to a certain extent because there is a close relationship between power transmission and nodes 14 and 15. The node load increases suddenly, and the system network is affected by a certain disturbance. Under the condition that the initial inoperability is 0, the inoperability increases in the initial stage. Because the power grid has good resilience, there is a network interconnection between the internal nodes, interdependence between nodes, self-regulation ability in the network system, and the inoperability increases first and then decreases gradually with time. After a period of time, the power grid gradually recovers under the internal self-regulation, and the small disturbance of the increased load has no adverse impact on the operation of the power grid. It reflected that the IEEE-30 bus system had good network resilience to small disturbances that increased the load power.
3.2 Case 2
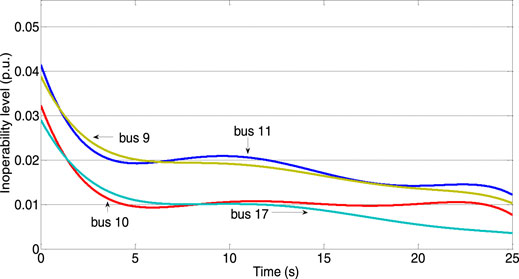
Fault setting: in this case, generator 11 fails and falls out of operation, and the output power of node 11 becomes 0. The node inoperability changes with time are shown in Figure 6.
The calculation results in Figure 6 show that the system network was affected by large disturbances and the inoperability of some nodes increase significantly, especially that of node 11. Because the generator at the node stops running and finally remains near 0.043 after a period of time, it shows that after the system network is affected by a large disturbance, the inoperability level decreased gradually with the increase in the output of each generator. Network nodes were greatly affected, and the inoperability increased first and then decreased. Because a generator node in the power grid was out of operation, its network resilience was greatly disturbed and cannot be restored to the initial state, and the network resilience was damaged to some extent. The magnitude of the change in the inoperability in Figure 6 was larger than that in Figure 5, and Figure 6 cannot return to the initial state, indicating that the impact of large disturbance on the power grid was significantly greater than that of smaller ones.
3.3 Case 3
Based on the method proposed in this study, the effectiveness of the resilience promotion strategy is verified after considering the corresponding resilience promotion strategy. According to the theoretical analysis part, it reduces the interdependence between the faulty nodes. According to Formula (8), after the system is subjected to the large disturbance of generator 11 which is out of operation, the corresponding control strategy is adopted to significantly reduce the level of inoperability so as to restore the network resilience of the system. The specific measures adopted are described as follows.
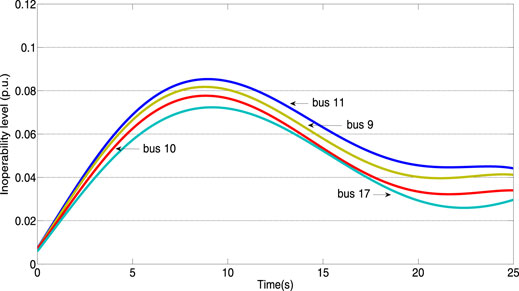
Specific measures: on the basis of case 2, the output of other generators is increased and the dependence of each load node on the original generator node 11 is reduced. In this way, the resilience coefficient matrix is changed. The node inoperability changes with time, as shown in Figure 7.
It can be seen from the calculation results in Figure 7 that due to the increase of the output of each generator in the network, the dependence of each load node on node 11 was reduced and the inoperability of nodes 9, 10, 11, and 17 gradually recovered from the initial value under the action of network resilience. If the generator is out of operation in the power network, increasing the output of other generators will enhance the operation stability of the power network, which is consistent with the actual operating conditions of the power network, which also verifies the effectiveness of the control strategy proposed in this study.
4 Conclusion
The effects of natural disasters on the power grid and the continuous access to large-scale new energy have a great impact on the safe and stable operation of the power grid. A power grid with good resilience can not only withstand various disturbances but also have shorter disturbance recovery ability. The study of the resilience of the power grid is an important topic, and the resilience measurement analysis is the key to the study of resilience.
Based on the DIIM, this study analyzed the power grid resilience; established the power grid resilience measurement model; creatively used the transmission power to measure the degree of interdependence between nodes; used the inoperability to measure the power grid resilience from the three aspects of network absorption capacity, adaptability, and recovery capacity; and measured the power grid resilience from the perspective of time. The relative value obtained by the measurement method was between 0 and 1, which was convenient for comparison of different system networks and can provide guidance for power grid planning. The resilience measurement method based on the DIIM described the whole process of the power grid from disturbance to rebalancing. This process also reflected the ability of power grid resilience to deal with disturbances, which had a clear physical significance.
The simulation analysis verified the rationality and correctness of the analysis method proposed in this study and can also intuitively show the recovery process of the resilience of the power grid after different disturbances, which provided a favorable basis for improving the resilience of the power grid. When the system is faced with serious disturbances or bad weather, the dispatcher can adjust the power distribution of the power grid according to the interdependence matrix and resilience coefficient matrix to enhance the resilience of the whole power grid so as to reduce the possible loss.
In the follow-up research, the author will consider further research on the optimal control of improving the power grid resilience around the links of power generation, transmission, and distribution; tap the potential of power grid resilience; and improve the security margin and the ability to resist external disturbances.
Data Availability Statement
The original contributions presented in the study are included in the article/Supplementary Material; further inquiries can be directed to the corresponding author.
Author Contributions
YW: Conception and design of study, analysis of data, and drafting the manuscript; SG: Acquisition of data and revising the manuscript critically for important intellectual content; FW: Analysis of data.
Conflict of Interest
The authors declare that the research was conducted in the absence of any commercial or financial relationships that could be construed as a potential conflict of interest.
Publisher’s Note
All claims expressed in this article are solely those of the authors and do not necessarily represent those of their affiliated organizations, or those of the publisher, the editors, and the reviewers. Any product that may be evaluated in this article, or claim that may be made by its manufacturer, is not guaranteed or endorsed by the publisher.
References
1. Ma Z, Chen H, Chai Y. Analysis of Voltage Stability Uncertainty Using Stochastic Response Surface Method Related to Wind Farm Correlation[J]. Prot Control Mod Power Syst(2017), 2 (1): 1 – 9. doi:10.1186/s41601-017-0051-3
2. Cihad Gulcu T, Chatziafratis V, Zhang Y, Yagan O. Attack Vulnerability of Power Systems under an Equal Load Redistribution Model[J]. IEEE Trans Netw (2018), 3(26): 1306–19. doi:10.1109/TNET.2018.2823325
3. Wang Y, Chen C, Wang J, Baldick R. Research on Resilience of Power Systems under Natural Disasters-A Review. IEEE Trans. Power Syst. (2016) 31(2):1604–13. doi:10.1109/tpwrs.2015.2429656
4. Panteli M, Trakas DN, Mancarella P, Hatziargyriou ND. Boosting the Power Grid Resilience to Extreme Weather Events Using Defensive Islanding. IEEE Trans. Smart Grid (2016) 7(6):2913–22. doi:10.1109/tsg.2016.2535228
5. Iver Bakken S, Kjolle Gerd H, Oddbjorn G. A Comprehensive Framework for Vulnerability Analysis of Extraordinary Events in Power Systems[J]. Reliab Eng Syst Saf, 2020, 196(C): 1–11. doi:10.1016/j.ress.2019.106788
6. Chen P, Tao S, Xiao X, Li L, Wang X. Analysis Method of Voltage Distribution Network with Uncertain Horizontal Elastic Network[J]. Proc CSEE, 2017, 37(16): 4650–61.
7. Khater MMA. On the Dynamics of Strong Langmuir Turbulence through the Five Recent Numerical Schemes in the Plasma Physics[J]. Numer Methods Partial Differ Equations, 2022, 38(3) 719–28. doi:10.1002/num.22681
8. Khater MMA, Mohamed MS, Attia RAM. On Semi Analytical and Numerical Simulations for a Mathematical Biological Model; the Time-Fractional Nonlinear Kolmogorov-Petrovskii-Piskunov (KPP) Equation[J]. Chaos, Solit Fractals, 2021, 144: 1–10. doi:10.1016/j.chaos.2021.110676
9. Khater MMA, Elagan SK, El-Shorbagy MA, Alfalqi S, Alzaidy JF, Alshehri NA. Folded Novel Accurate Analytical and Semi-analytical Solutions of a Generalized Calogero–Bogoyavlenskii–Schiff Equation[J]. Commun Theor Phys, 2021, 73: 1–11. doi:10.1088/1572-9494/ac049f
10. Khater MMA. Abundant Wave Solutions of the Perturbed Gerdjikov–Ivanov Equation in Telecommunication Industry[J]. Mod Phys Lett B, 2021, 35(26): 1–23. doi:10.1142/s021798492150456x
11. Khater MMA, Seadawy AR, Lu D. Elliptic and Solitary Wave Solutions for Bogoyavlenskii Equations System, Couple Boiti-Leon-Pempinelli Equations System and Time-Fractional Cahn-Allen Equation. Results Phys (2017) 7:2325–33. doi:10.1016/j.rinp.2017.06.049
12. Khater MMA, Mousa AA, El-Shorbagy MA, Attia RAM. Abundant Novel Wave Solutions of Nonlinear Klein–Gordon–Zakharov (KGZ) Model[J]. Eur Phys J Plus, 2021, 136(604): 1–28. doi:10.1140/epjp/s13360-021-01385-0
13. Wang F, Khan MN, Ahmad I, Ahmad H, Abu-Zinadah H, Chu YM. Numerical Solution of Traveling Waves in Chemical Kinetics: Time Fractional Fishers Equations[J]. Fractals-Complex Geometry Patterns Scaling Nat Soc, 2022, 30(2): 2240051. doi:10.1142/s0218348x22400515
14. Peng M, Zhang T, Wang L, Chen R, Lian S. Application of Improved Elastic Network Model in Deep Neural Network[J]. J Comput Appl, 2019, 39(10): 2809–14. doi:10.11772/j.issn.1001-9081.2019040624
15. Liang G, Xiao R. Resilience Measure of Supply Network Based on DIIM [J]. Comput Integr Manuf Syst, 2014, 20(5): 1211–9.
16. Crowther KG, Haimes YY. Application of the Inoperability Input-Output Model (IIM) for Systemic Risk Assessment and Management of Interdependent Infrastructures. Syst. Engin. (2005) 8(4):323–41. doi:10.1002/sys.20037
17. Ding T, Lin Y, Li G, Bie Z. A New Model for Resilient Distribution Systems by Microgrids Formation. IEEE Trans. Power Syst. (2017) 32(5):4145–7. doi:10.1109/tpwrs.2017.2650779
18. Zhou X, Ge S, Teng LI, Liu H. Assessing and Boosting Resilience of Distribution System under Extreme Weather[J]. Proc CSEE, 2018, 38(2): 505–13.
19. Liu L, Jin L, Xia Q, Yu J, Yang Z, Dai W. Modeling and Benefit of Flexible Space of Transmission Operation in Power System[J]. Automation Electr Power Syst, 2019, 43(5) 7–13.
20. Li G, Huang G, Bie Z, Lin Y, Huang Y. Component Importance Assessment of Power Systems for Improving Resilience under Wind Storms. J. Mod. Power Syst. Clean Energy (2019) 7(4):676–87. doi:10.1007/s40565-019-0563-0
21. Panteli M, Mancarella P. Modeling and Evaluating the Resilience of Critical Electrical Power Infrastructure to Extreme Weather Events[J]. IEEE Syst J,2015:11, 1–10. doi:10.1109/JSYST.2015.2389272
22. Panteli M, Mancarella P. Influence of Extreme Weather and Climate Change on the Resilience of Power Systems: Impacts and Possible Mitigation Strategies. Electr Power Syst Res (2015) 127:259–70. doi:10.1016/j.epsr.2015.06.012
23. Ma S, Chen B, Wang Z. Resilience Enhancement Strategy for Distribution Systems under Extreme Weather Events[J]. IEEE Trans Smart Grid (2018), 9(2): 1442–51. doi:10.1109/TSG.2016.2591885
24. Gu M, Sun W, Li P, Jin C, Zhou F, Wang D. Evaluation Index System for Urban Elastic Distribution Network in the Face of Extreme Disturbance Events[J]. Proc CSU-EP-SA,2018, 30(7): 103–9.
25. Lei S, Wang J, Chen C, Hou Y. Mobile Emergency Generator Pre-positioning and Real-Time Allocation for Resilient Response to Natural Disaster[J]. IEEE Trans Smart Grid 2018;9(3). 2030–41. doi:10.1109/TSG.2016.2605692
26. Leontief WW. Input-Output Economics. Sci Am (1951) 185:15–21. doi:10.1038/scientificamerican1051-15
27. Lian C, Haimes YY. Managing the Risk of Terrorism to Interdependent Infrastructure Systems through the Dynamic Inoperability Input-Output Model. Syst. Engin. (2006) 9(3):241–58. doi:10.1002/sys.20051
28. Haimes YY, Horowitz BM, Lambert JH, Santos JR, Lian C, Crowther KG. Inoperability Input-Output Model for Interdependent Infrastructure Sectors. I: Theory and Methodology. J. Infrastruct. Syst. (2005) 11(2):67–79. doi:10.1061/(asce)1076-0342(2005)11:2(67)
Keywords: resilient power network, measurement, resilience quantification, disaster, dynamic inoperability input–output model
Citation: Wang Y, Gao S and Wang F (2022) Measurement of Power Grid Resilience Based on a Dynamic Inoperability Input–Output Model. Front. Phys. 10:895267. doi: 10.3389/fphy.2022.895267
Received: 13 March 2022; Accepted: 19 April 2022;
Published: 16 June 2022.
Edited by:
Víctor M. Eguíluz, Spanish National Research Council (CSIC), SpainReviewed by:
Mostafa M. A. Khater, Jiangsu University, ChinaHussein A. Z. AL-bonsrulah, Iran University of Science and Technology, Iran
Aamir Farooq, Abbottabad University of Science & Technology, Pakistan
Copyright © 2022 Wang, Gao and Wang. This is an open-access article distributed under the terms of the Creative Commons Attribution License (CC BY). The use, distribution or reproduction in other forums is permitted, provided the original author(s) and the copyright owner(s) are credited and that the original publication in this journal is cited, in accordance with accepted academic practice. No use, distribution or reproduction is permitted which does not comply with these terms.
*Correspondence: Yan Wang, d3lkZHNldUAxNjMuY29t
 Yan Wang
 Shan Gao1,2
 Fuzhang Wang