 Eugenia Naselli1*
 Domenico Santonocito1
 Simone Amaducci1
 Luigi Celona1
 Alessio Galatà2
 Alain Goasduff2
 Giorgio Sebastiano Mauro1
 Maria Mazzaglia1
 Bharat Mishra1Daniel R. Napoli2
 Angelo Pidatella1
 Giuseppe Torrisi1
 David Mascali1
- 1Laboratori Nazionali Del Sud, Istituto Nazionale di Fisica Nucleare, Catania, Italy
- 2Laboratori Nazionali di Legnaro, Istituto Nazionale di Fisica Nucleare, Legnaro, Italy
In the frame of the PANDORA project, a new experimental approach aims at measuring in-plasma β-decay rate as a function of thermodynamical conditions of the environment, namely a laboratory magnetized plasma able to mimic some stellar-like conditions. The decay rates (expected to change dramatically as a function of the ionization state) will be measured as a function of the charge state distribution of the in-plasma ions. The new experimental approach aims at correlating the plasma environment and the decay rate. This can be performed by simultaneously identifying and discriminating—through an innovative multi-diagnostic system working synergically with a γ-ray detection system —the photons emitted by the plasma and γ-rays emitted after the isotope β-decay. In this study, the numerical simulations supporting the design of the γ-ray detector array, including a statistical significance study to check the feasibility of measuring the in-plasma decay rates, are presented. Geant4 simulations focused on the design of the array of γ-ray detectors and the evaluation of total efficiency depending on the detector type and the optimal displacement of detectors around the trap (including collimation systems and shielding). The simulation results showed that, due to technical limitations in the number of apertures that can be created in the magnetic trap, the best compromise is to use 14 HPGe (70% of relative efficiency) detectors surrounding the magnetic trap. The HPGe detectors were chosen for their excellent energy resolution (0.2% @ 1 MeV), since the harsh environment (the background is represented by the intense plasma self-emission) strongly affects the signal-to-background ratio. Once determined the total photopeak efficiency (0.1–0.2%), the sensitivity of the PANDORA experiment was checked in a “virtual experimental run,” by exploring the measurability of isotope decay rates for the first three physical cases of PANDORA: 176Lu, 134Cs and 94Nb. The preliminary results demonstrated the feasibility of the measurement in terms of the signal-to-background ratio and significance that it is possible to reach. The results indicated that experimental run durations could take from several days to 3 months, depending on the isotope under investigation, thus shedding new light on the role of weak interactions in stellar nucleosynthesis.
1 Introduction
The main aim of the PANDORA (Plasmas for Astrophysics, Nuclear Decay Observation and Radiation for Archaeometry) project [1, 2] is the in-plasma measurement of β-decay lifetime of selected radioisotopes which, due to the plasma environment, is expected to undergo a significant variation relative to the value measured in neutral atoms [3–5]. The driving mechanism which can lead to such a change in the β-decay lifetime is represented by the opening of a new decay channel, the bound state β-decay [6]. Such a decay becomes effective due to the high degree of ionization of the atoms in the plasma which allows the electron emitted in the β-decay to be captured into a bound electron state of the daughter nucleus. The astrophysical relevance and implications of bound state β-decay, in particular for the s-process, have been widely discussed by several authors. Its observation in plasma whose conditions can mimic the hot stellar environment is expected to have a major impact on the study of nuclear-astrophysics processes [7–9] and cosmology. In particular, the experimental results could support the possibility of using specific long-lived isotopes as cosmological tools (chronometers), since the current uncertainties in their lifetime do not allow to be confident in estimating the age of a given astrophysical object by just looking at the relative abundances of certain isotopes (i.e., measuring the “father–son” abundances ratio).
To reach this goal, we will make use of a compact and flexible plasma trap equipped with a multi-diagnostic setup [10, 11] to monitor the density and temperature of the plasma and the charge state distribution (CSD) of the ions. The plasma working conditions will be characterized by electron density values ne ∼ 1011–1013 cm−3 and a range of temperatures kBTe ∼ 0.1–30 keV. In this environment, ions remain cold with kBTion ≤ 20 eV.
The decay of the radioactive ions will be measured through the detection of the γ-rays emitted by the β-decay daughter nuclei. This task will be accomplished by an array of several HPGe detectors placed around the trap, in specific positions where holes were made in the cryostat structure to directly look into the plasma through thin aluminum windows. The design of the detection array proposed for the project is the result of Geant4 simulations [12] performed to evaluate the main features of the γ-ray detection setup and its efficiency in the decay tagging.
In the following study, we will discuss the numerical simulations focused on the design of the γ-ray detector array and the technical solutions (in terms of type, number, position of the γ-ray detectors, collimation and shielding system) foreseen to achieve the goals of PANDORA. Furthermore, a statistical significance study will be presented, including simulations supporting the feasibility of the measurement of the decay rate in plasma, for the first three physical cases selected for the phase-1 of PANDORA. The preliminary results demonstrated the feasibility of the measurement in terms of 3σ significance that it is possible to reach, determining the expected duration of experimental runs (which varies from a several days to 3 months, depending on the isotope under investigation) thus shedding new light on the role of weak interactions in stellar nucleosynthesis.
2 The plasma trap design
In order to investigate the variations in β-decay lifetime due to a high degree of ionization of the ions in a plasma environment, the PANDORA project will make use of a dedicated trap [13] where the plasma is confined by a three-dimensional magnetic well. The trap will be realized by means of a fully superconducting magnetic system, similar to the one used in ECR (electron cyclotron resonance) ion sources, consisting of three coils for axial confinement and a nested hexapole for radial confinement which will be tuned in order to create the so-called minimum-B magnetic-field configuration, mandatory to match magnetohydrodynamical (MHD) equilibrium and the stability of the plasma. The magnetic system will be surrounded by an ARMCO® iron yoke, placed at a radial distance of about 20 cm from the coils’ outer radius, having a thickness of about 2.5 cm used to confine the magnetic field. The cryostat includes a central warm bore which allows the insertion of the plasma chamber made of aluminum.
The magnetic system will be able to operate at any value in the range of about 1.7–3 T allowing for a proper tuning of the plasma parameters and ensuring plasma stability. It will surround a cylindrical plasma chamber of outer radius of about 15 cm and length of about 70 cm. The size has been optimized to increase the confinement time, one of the parameters governing the production of high charge states (the other is the plasma density), to increase the microwave to plasma coupling efficiency and to have enough space for non-invasive diagnostic tools and the array of γ-ray detectors. Since the plasma density scales with the square of the frequency
The trap design included a set of radial lines of sight, in order to access the plasma to detect the γ-rays emitted in the decay of daughter nuclei populated in the β-decay process and for a proper positioning of specific diagnostic tools whose use is fundamental to measure the plasma parameters. These lines of sight are placed radially between the warm bore radius and the external iron yoke through the cryostat and the inner cold mass so that the different materials used to build the magnetic system and the yoke would shield both the γ-rays and plasma radiation. For this reason, the apertures in the cryostat have been placed in the interspaces of each coil of the hexapole. Such a choice has the advantage of using the hexapole itself as a collimator and shield for the photon flux emitted from the plasma chamber walls, therefore, improving the signal-to-background ratio.
The results of simulations performed using Geant4 suggested that the best compromise, considering the mechanical problems in the creation of the lines of sight, the possible modification of the magnetic field shape and the necessary γ-ray detection efficiency, can be obtained by creating three conical apertures in each hexapole element allowing for the placement of 12 HPGe detectors and six plasma diagnostic tools. All their axes point to the center of the plasma chamber so that opposite apertures are collinear. The position of the apertures used for the γ-ray detectors has been chosen in order to avoid the so-called magnetic branches (i.e., the region of the magnetic trap where the B-field lines are more intense) for which the background due to intense bremsstrahlung X-ray emission (due to axial and radial losses impinging on the plasma chamber walls) is expected to be more intense.
The HPGe detectors will be placed around the trap, at a radial distance of a few centimeters from the yoke using a dedicated mechanics. At such a distance the stray field, according to the technical specifications, will be of the order of 100 G, and therefore, no effects due to the magnetic field are expected on the charge collection efficiency which could lead to a worsening of the detector resolution. Two further HPGe detectors (and eight further plasma diagnostic tools) will be placed axially looking into the plasma through aluminum windows present in the walls of the plasma chamber.
A sketch of the PANDORA setup, including the superconducting magnetic system (in red) inside its cryostat (in blue) and iron yoke (in gray) is shown in Figure 1. The figure also includes the HPGe detector array and some of the non-invasive diagnostic tools comprising the advanced multi-diagnostic system (i.e., optical, X-ray, interfero-polarimetry, RF probe and pin-hole camera) that will surround the plasma trap.
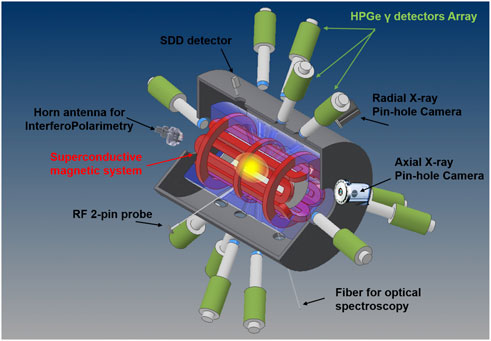
FIGURE 1. Rendering of the PANDORA setup, including the superconducting magnetic system (in red) inside its cryostat and iron yoke; the array of HPGe detectors; the main diagnostics (optical, X-ray and interfero-polarimetry); the mass spectrometer and the RF system.
3 The experimental approach
The experimental method is based on the possibility of maintaining a dynamical equilibrium between the quantity of atoms injected into the trap and the losses due to the intrinsically imperfect magnetic confinement, in order to keep stable density and temperature (thus, the concentration of decaying nuclei in the trap) for a long period of time, extending up to months. The experimental procedure includes the following five steps:
1. A buffer plasma is created from He, O, or Ar up to a density of 1013 cm−3.
2. The isotope is flushed directly (if gaseous) or vaporized by proper ovens [13] (if metallic) and then fluxed into the chamber to be transformed into a plasma state. Relative abundances of buffer versus isotope densities reach a ratio up to 100:1 (if the isotope is in metal state) or 3:1 (in the case of gaseous elements).
3. The plasma is maintained in MHD equilibrium by equalizing the input fluxes of particles to the losses.
4. While the isotopes decay, the plasma-confined daughter nuclei emit γ-rays of hundreds of keV, which are detected by a HPGe detector array surrounding the magnetic trap.
5. Radioactivity measured in plasma can be directly correlated to plasma density and temperature, monitored by an innovative non-invasive multi-diagnostics setup.
The number of decays per unit time
where λ is the isotope activity, f(ϵ) is the electron energy distribution function, n is the electron density, ni is the plasma ion density of the isotope, and Vp is the plasma volume.
Since the ECR plasma confined in the magnetic minimum-B configuration will be kept in dynamical equilibrium [14, 17], the term λ(n, f(ϵ)) niVp is constant over time and Equation (1) can be easily integrated. Therefore, the total amount of decays detectable via γ-ray tagging can be determined according to the following formula:
where tmeas is the overall measurement time during which the γ-rays emitted in the decay of the excited states of the decay products are measured by the HPGe detector array.
Equation (3) implies that the number of expected decays scales linearly with respect to the measurement time tmeas. Since the plasma parameters can be kept constant over time, the proportionality is due to the nuclear decay constant only, which is, in turn, a function of the plasma density and energy distribution: λ(n, f(ϵ)). The core issue is, therefore, to univocally determine n and f(ϵ), inherently fixing the CSD, to be correlated with the γ counting rate. In fact, any physical condition (combination of density and temperature) in non-LTE (non-local thermal equilibrium) determines a certain CSD (charge state distribution) of the ions in plasma, similarly to what happens in the stars’ interiors (where, however, the plasma is in LTE equilibrium).
In particular, Equation (3) implies that the plasma density and volume must be known and monitored online all along the measurement to deconvolve λ (it is worth noting that n ≡ n (x, y, z)). Their spatial dependence can be determined from spectrally resolved X-ray imaging [18, 19] and through other non-invasive diagnostic tools, such as microwave diagnostics [20, 21]. More generally, it is possible to monitor and measure online all plasma parameters and thermodynamical properties by means of the multi-diagnostics system made of a tens of non-invasive diagnostic tools [10] in order to verify that the parameters are constant over the time within the typical sensitivity range of measurement [1].
Moreover, the monitoring of the isotope evaporation can be performed by means of numerous diagnostic systems [22], that is, the QCM (quartz crystal microbalance) which is able to measure the mass of isotope that has been deposited on the surface of a quartz crystal exposed to the vapors in the vacuum chamber, thermocouples that are used to measure the temperature at various points on the oven and keep it at the required temperature, and thermal camera which is an infrared-sensitive camera that allows an image of the temperature of the various parts of the oven. On the other hand, the monitoring of losses can be performed by means of advanced analysis methods and non-invasive multi-diagnostics tools, which allow unprecedented investigations of magnetoplasma properties [10]. The high resolution spatially resolved soft X-ray spectroscopy by means a X-ray pin-hole camera setup represents a very powerful method to perform plasma structure evaluation and valuable studies on the dynamics of losses [23]. It is, in fact, possible to perform energy filtering analysis and online monitoring of the losses versus the plasma emission, by distinguishing online fluorescence lines (produced by the electrons escaping the trap and impinging on the metal surfaces) of each material of the plasma chamber from the ones coming from the plasma (due to the fluorescence of confined ions).
The performances of the setup were evaluated through a set of realistic simulations performed using Geant4. This approach allowed us to estimate the array detection efficiency and the feasibility of the experiments on the three physics cases identified for the first PANDORA experimental campaign, which are reported as follows:
• 176Lu:
• 94Nb:
• 134Cs:
From a list of tens of radioisotopes of strong astrophysical interest, the choice of the three physical cases for the first series of PANDORA measurements was based on: 1) the scientific relevance, 2) the expected effects on the lifetime due to the ion CSD or ion temperature, 3) the type of element (gas, metal, rare isotope, commercial or not), and 4) selecting the isotopes whose daughter nuclei emit γ-rays, the identification of the decay products being based on the detection of γ-rays.
Only isotopes whose daughter nuclei emit γ-rays at energies higher than 200 keV have been selected; lower energy γ-rays would, in fact, be overwhelmed by the high-intensity background self-emitted by the plasma, which represents the main source of the background for the measurements, strongly affecting the signal-to-background ratio.
An example of the background spectrum, due to plasma self-emission at n = 1013 cm−3 having a Vp = 1500 cm3, is shown in Figure 2. It was evaluated starting from measurements on existing traps and rescaling them to higher densities and volumes according to an emissivity model [24].
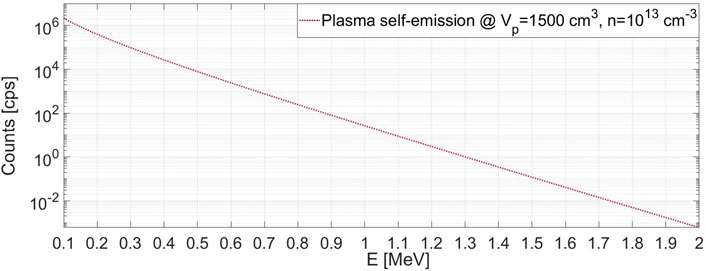
FIGURE 2. Example of the rate of plasma self-emission in the whole volume as a function of the energy of the radiation (the width of the bin in the x axis corresponds to 10 eV).
The spectrum shows the high emission rate of radiation emitted from the whole plasma volume. Due to this high intensity, each HPGe detector will undergo a rate of few tens of kHz and dedicated electronics are needed to work in such a harsh environment.
4 Geant4 simulations
Numerical simulations focused on the design of the γ-ray detector array were performed in Geant4 to study the best configuration achievable in terms of the total number, type of detectors, and their optimal distribution around the trap, including collimation systems and shielding.
In the following Sections 4.1 and 4.2, the setup design in Geant4 and the total efficiency estimation of the whole system are, respectively, shown. In addition, the sensitivity of the PANDORA experiment was also specifically checked by exploring the measurability of isotopes lifetimes in a virtual experiment for the physical cases mentioned earlier. Preliminary results demonstrating the feasibility of the experiment are shown in Section 5.
4.1 Design of the PANDORA setup
The trap geometrical design was implemented in Geant4 using the PANDORA magnetic design described in [13], with the same materials and dimensions of each component. The final design consists of:
• A stainless steel chamber with an external radius of 150 mm, a length of 700 mm, and a thickness of 10 mm. The chamber has 14 holes with a diameter of 40 mm, aligned with the cryostat line of sight for the detection of γ-rays. A total of 12 azimuthal holes placed along four rings, symmetrically placed at 6 and 12 cm with respect to the center of the chamber were simulated (Figure 3). Three holes at 120° were made for each ring, building a symmetrical geometric configuration with respect to the center of the chamber. Two axial holes (injection and extraction) with a diameter of 40 mm have been added to the entrance and exit endplate of the chamber. Each hole has an aluminum window with a thickness of 3 mm and a diameter of 40 mm.
• An overall magnetic system, shown in Figure 4A, is made of three NbTi superconducting coils (in yellow) and a NbTi superconducting hexapole (in red). The inner and outer radii of the coils (for the injection, the middle, the extraction coil) and of the hexapole superconductor are summarized in table 1.
• A single cryostat, containing the three coils and the hexapole magnet, was simulated as a cylindrical aluminum structure (shown as pink color in Figure 4B) surrounding the entire magnetic system and distant 30 mm from both ends of the hexapole (along the axis). Holes were created in the cryostat structure—along the interspaces of the conductor hexapole—in order to use it as a multi-collimator and to suppress as much as possible the photon flux coming from the walls and not directly from the plasma core, improving the signal-to-background ratio. A total of 14 holes were created in the cryostat structure: two tilted axial conical holes and 12 radial ones having a lower diameter of 40 mm, properly aligned with 14 holes created in the plasma chamber. Conical holes point to the center of the plasma chamber and pairs opposite to the center are collinear.
• The magnetic trap is surrounded by an ARMCO® iron yoke, distant 150 mm from the ends of the hexapole (along the axis), 200 mm distant from the outer radius of the injection and extraction axial coils, having a thickness of 25 mm. The iron yoke is shown as blue color in Figure 4C. The iron yoke exhibits the same number of holes (88 mm in diameter) along the cone of view of the 14 collimators. At the end of each collimator was placed a quartz window with a thickness of 3 mm and a diameter of 88 mm (yellow);
• An array of 14 γ-ray detectors (two placed axially and 12 radially). Each detector was placed collinearly at each collimator (Figure 5A). The HPGe detectors [25] have a length of 82 mm and a radius of 38 mm and are surrounded by a 1 mm thick layer of Al (Figure 5B). The Al cylinder is shown in transparent pink, while the active part of the detector is colored cyan inside of it.
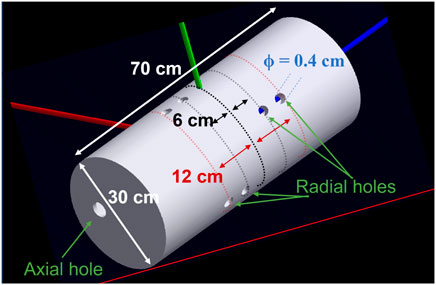
FIGURE 3. Sketch of the stainless steel plasma chamber including the 12 radial and two axial holes to be used for the detection of the γ-rays; quotations of hole displacement along the lateral chamber walls are shown.
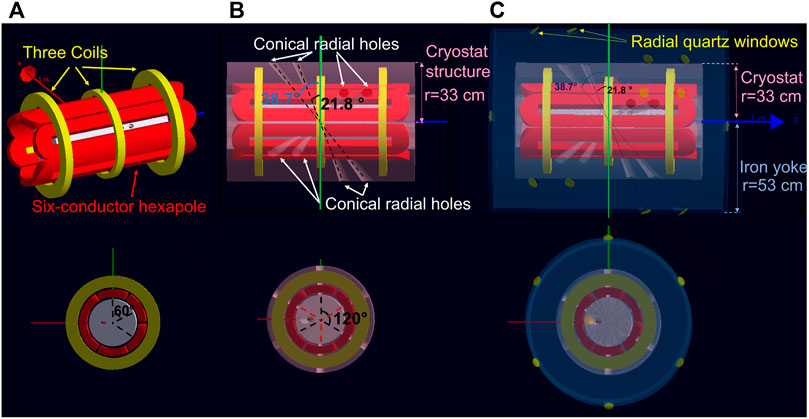
FIGURE 4. (A) Plasma chamber surrounded by superconducting coils (yellow) and hexapole (red); (B) magnetic system surrounded by the cryostat structure (pink) in which tapered holes used as lines of sight for gamma-ray detection are shown; (C) ARMCO® iron yoke (blue) surrounding the magnetic plasma trap.
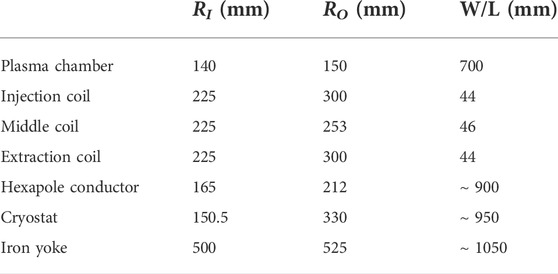
TABLE 1. Geometry of the PANDORA trap showing for each component: the inner radius (RI), the outer radius (RO), and the length or width (L/W).
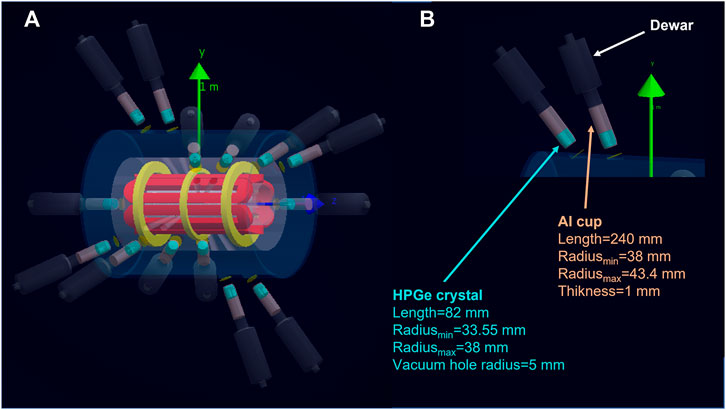
FIGURE 5. (A) Final design of the PANDORA trap with the magnetic system (coils, hexapole, cryostat, and iron yoke) and the array of detectors placed collinearly at each collimator as implemented in Geant4. (B) Details of the HPGe array show the dimensions of the detectors (crystal + Al cup) used in the simulations.
The position and orientation of the collimators and γ-ray detectors have been chosen so as to avoid, within the field of view, the magnetic branch regions where the background due to intense bremsstrahlung X-ray emission (caused by axial and radial losses impinging on the plasma chamber walls) is expected to be more intense. Figure 6 shows 3D views of the detector array surrounding the trap: each pair of HPGe has been placed outside the regions where the magnetic field lines are more intense and intercept the plasma chamber walls.
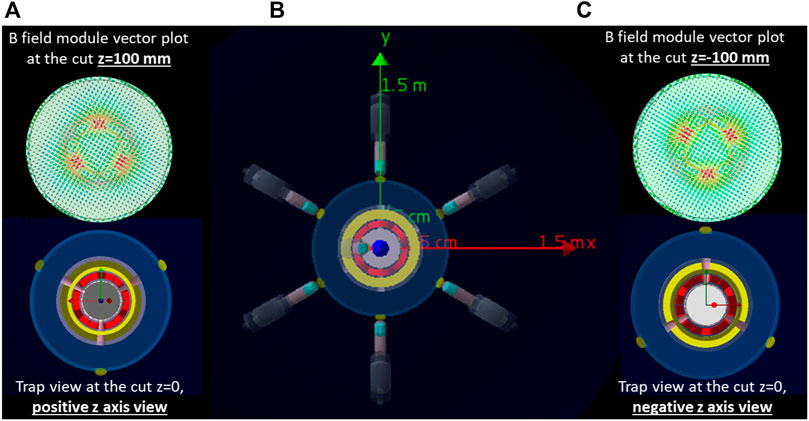
FIGURE 6. Sketch of the detector positions (B) compared to B field lines distribution. Two cut views are shown in (A) for z = 100 mm and in (C) for z = −100 mm. Each pair of HPGe (shown in the lower panels A and C) has been placed outside the regions where the magnetic field lines are more intense (shown on upper panels A and C).
4.2 Evaluation of the array efficiency
The first aim of the simulations was to estimate the total detection efficiency needed to evaluate the feasibility of the experiment using γ-rays and to choose the type of detector giving the best performances in terms of efficiency and energy resolution. Two different types of detectors were compared in the simulations: the hyper-pure germanium (HPGe) and the lanthanum bromide (LaBr3). Initial simulations were performed considering the emission from an isotropic point–like source; once the best detector type was determined, a complete characterization was performed in terms of the position of the detectors and of the collimation system (including the size and shape of the holes) assuming the emission from an isotropic ellipsoidal source whose size corresponds to the plasma volume in the PANDORA trap.
4.2.1 Array efficiency: HPGe vs LaBr3 detectors for a point-like source
As a first step, simulations were performed considering the emission from an isotropic point–like source placed in the center of the plasma chamber [26]. The detection efficiency of the array to γ-rays of different energies was simulated by changing the energy of the source in the range from 100 keV to 2 MeV. The results, which take into account geometrical and photopeak efficiency, are shown in Figure 7A for an array of 14 HPGe detectors (blue symbols) and for an array of 14 LaBr3 (red symbols), using the same detector sizes. Since for the purposes of the PANDORA project, the main goal is to detect only the characteristic γ-rays emitted by daughter nuclei following the β-decay process which populates the lowest excited states of the daughter nuclei, the expected experimental multiplicity is one and no coincidence analysis is needed. Thus, the plot was obtained with multiplicity one, one energy after the other. The efficiency for the two types of the detector is very similar and of the order of few per mille.
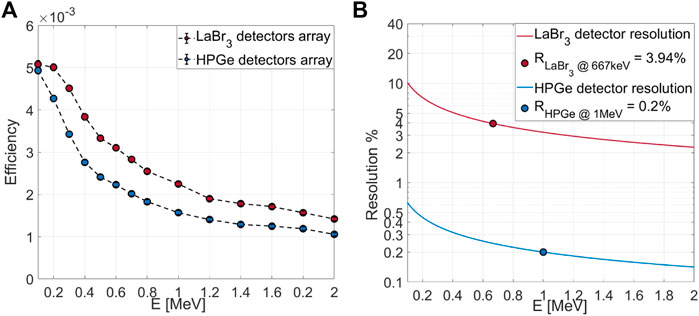
FIGURE 7. (A) Efficiency versus γ-ray incident energy for the HPGe detectors (blue symbols) and LaBr3 (red symbols) detectors. (B) Energy resolution versus γ-ray incident energy for HPGe (blue symbols) and LaBr3 (red symbols).
However, the main difference between the two types of detectors is the energy resolution. The typical resolution as a function of the energy of the incident γ-ray [27] is shown in Figure 7B for the HPGe (blue symbols) [28] and LaBr3 (red symbols) [29] detectors, respectively. They differ more than one order of the magnitude, and this strongly affects the signal-to-background ratio.
Starting from the typical background spectrum due to plasma self-emission shown in Figure 2, it has been possible, once the total efficiency of the system has been determined, to evaluate the background rate that would be measured by the PANDORA setup. Such a rate was compared to the rate of the γ-rays emitted from the daughter nuclei after the β-decay and detected in the array. A comparison of the performances between the HPGe detector array and the LaBr3 detector array was performed to evaluate the time needed to achieve a 3σ significance. We considered, as an example, a signal of 0.25 cps in plasma (counts per second) in the multi detector array at a given energy (which is a value of rate corresponding to a variation of the mean lifetime of 176Lu of about six orders of magnitude, as expected by the theoretical models according to the thermodynamic properties of the plasma that will be generated in PANDORA, section 5). The adopted procedure was to integrate the background spectrum in the energy window corresponding to the intrinsic detector resolution. The error over this background was taken as the square-root of counts in the energy resolution window, while the counts due to the real decays occurring in the plasma were summed up linearly with time. The procedure was repeated for different run durations spanning a time window up to 107 s.
Figure 8A shows the trend of the signal counts (in black) and of the three times the background level (in blue for HPGe, in red for LaBr3), in order to see where and when the cross-over point between the two curves occurs. The intersection of the two lines indicates the point where the signal exceeds the 3σ background level and the corresponding abscissa indicates the measurement time needed to have a 3σ significance. The comparison shows that after about several days it is possible to obtain a 3σ significance using the HPGe detector array (as shown in Figure 8A), while using a LaBr3 detector array the time needed is much longer, the measurement is very challenging or, eventually, not-feasible, depending on the physics case investigated.
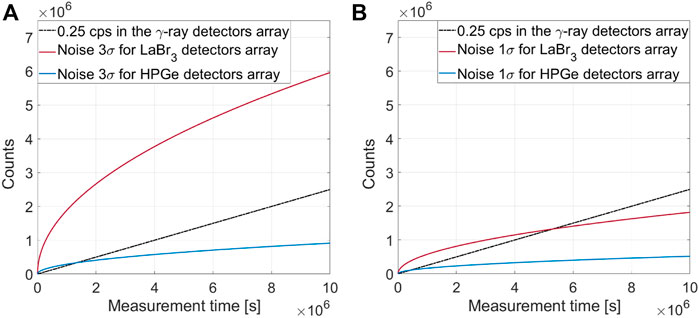
FIGURE 8. Trend of the counts of the expected signal (in black), considering a rate of 0.25 cps (counts per second) in the multi detector array, and of the 3σ background level (A) for LaBr3 and HPGe detectors (in red and blue, respectively). (B) Similar plot as in (A) for a rate of the 1σ background levels.
A similar plot (Figure 8B) was performed to evaluate the measurement time needed to have only a 1σ significance. In this case, the LaBr3 detector array could allow to reach this significance in about 2 months, drastically higher than what is required using the HPGe detector array.
Due to the strong difference observed in the performances of the arrays, we have decided to use the high performance HPGe detector array in PANDORA. Therefore, in the following sections, we will discuss the performances of an array based on HPGe detector.
4.2.2 Characterizations of collimator-hole position using an ellipsoidal source
As a following step, in order to realistically reproduce the experimental conditions, simulations were performed considering an isotropic ellipsoidal source placed around the center of the plasma chamber, having semi-axis lengths of 79 mm, 79 mm and 56 mm, respectively, for the x, y, and z axis (corresponding to the plasma volume and shape provided by the magnetic field profiles in the PANDORA plasma trap). Similarly to what was previously performed for the point-like source, the γ-ray energy range explored extends from 100 keV to 2 MeV. For the evaluation of the background due to plasma self-emission, we considered a density of n = 1013 cm−3, and a volume of 1,500 cm3. The trend of the array efficiency as a function of the incident γ-ray energy is shown in Figure 9A (in blue) assuming 14 HPGe detectors. The comparison between the results shown in Figure 7A indicates that the efficiency in the case of the ellipsoidal source is a factor of 2.5 lower than that of a point-like source for the lowest energies, while the difference reduces to about a factor of 1.5 for higher energies.
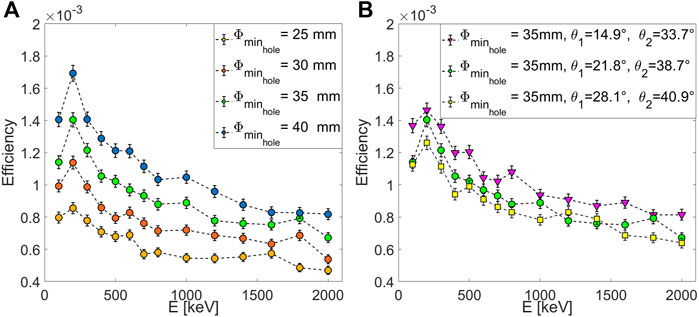
FIGURE 9. (A) Efficiency plots as a function of the incident γ-ray energy for HPGe detectors. An ellipsoidal source was used. The colors of the symbols correspond to simulations performed using different hole sizes for collimators. (B) Same as A but in this case the effect of different angles of inclination of the conical holes was investigated.
Further simulations were performed to investigate the effect due to the position and size of the collimator holes. The values shown in Section 4.1 are, in fact, the outcome of this study. In particular, the effects due to the reduction of conical holes and to the different choices of inclination angle (with respect to the y vertical axis) and position were investigated. The purpose of this characterization was also to define a tolerance range for each parameter, taking into account the technical limitations that can arise in the design study of the magnetic trap (e.g., mechanical constraints imposing a certain angle for the conically shaped holes). The simulated efficiency plots associated with four different diameters
The effect related to three different choices of the inclination angle of the collimators is instead shown in Figure 9B. It shows that the overall average change in efficiency at the three representative couple of angles chosen is less than 20%, somehow relaxing any requirement from this point of view.
The results of the simulations suggested that the best compromise between detection efficiency and mechanical constraints for the HPGe array is to build a collimation system with holes having a diameter of 40 mm and placed at a relative inclination corresponding to a first angle of θ1 = 21.8° (it corresponds to a distance of 60 mm from the y-axis, along the plasma chamber external surface) and a second angle of θ2 = 38.7° (corresponding to a distance of 120 mm from the y-axis, along the plasma chamber external surface), as shown in Figure 4C. This choice guarantees greater flexibility and tolerance for the realization of the plasma trap.
Moreover, numerical simulations finalized to investigate the distribution of the various electrons’ population, with special attention to the warm component on which depends the obtained ions’ CSD, allowed to benchmark the choice of the specific orientation of the 14 HPGe detectors. The recent results [30] demonstrated that the cones of view perfectly intercept the warm electrons spatial distribution. Thus, they will point exactly where most of the ionizations will take place, increasing the detection sensitivity to variations of the in-plasma charge state distribution.
5 Simulations of virtual experimental runs
Once the overall diagnostics tools, as well as the HPGe detector array, have been defined, the setup was tested in a simulated experiment to assess the feasibility and sensitivity of the method to be adopted for the different isotopes of interest. Different theoretical predictions about lifetime dependence on the temperature [31] were used to evaluate the feasibility of the measurements—estimating the run duration to get statistically meaningful results in terms of significance. It was also possible to demonstrate that future PANDORA measurements will have the adequate sensitivity to discriminate between different sets of theoretical predictions of the expected variation of the mean lifetime (i.e. [32]) and to eventually better fit the data of nucleosynthesis which disagrees with the current decay rate predictions (i.e., in [33] one needs to assume that the temperature dependence of the decay rate for 134Cs is less steep than that suggested by [31] by around a factor eight to level the production of 134Ba and 136Ba according to the model).
In order to estimate the measurement time needed to reach the 3σ significance taking into account different lifetimes, that is, different rates in the detector array, we made dedicated plots showing the total counts and the expected significance (starting from the decay rate (or the lifetime) of the radionuclide) as a function of the measurement time for the first three physics cases (section 3) selected for the PANDORA phase-1.
Figure 10 shows the simulation result for the physical case of 176Lu. The first (from the left) green vertical axis reports a decreasing lifetime expressed in years, starting from the lifetime of the neutral isotope (5.45⋅1010 years) to the values of lifetimes predicted by the theory and that are reachable in our plasma trap. The expected collapse of the lifetime as theoretically evaluated is about six order of magnitude for the case of 176Lu (at a plasma temperature of about 10 keV) [31].
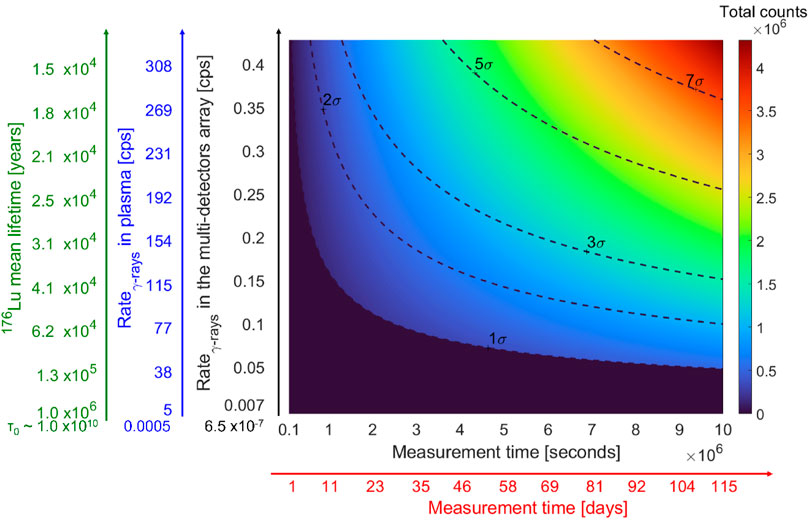
FIGURE 10. Total counts of gamma-rays emitted (pseudo-colors scale) and iso-significance contours (dashed lines) for different 176Lu isotope lifetimes (green vertical axis) as a function of the measurement lifetime. Blue and black vertical scales show the predicted decay rate in plasma and the counting rate measured in the array associated to the different isotope lifetime.
Considering these lifetimes, the effective activity in the plasma (expressed in cps)—assuming a plasma of 1,500 cm3 in volume with a relative concentration of 1% of Lu with respect to the buffer density (1013 ions/cm3)—can be estimated and is shown on the blue vertical axis. Finally, including the efficiency of the HPGe detector array estimated by the aforementioned Geant4 simulations, we evaluated the counting rate of the detector array shown in the third, black vertical axis. The x-axis indicates the measurement time. Pseudo-colors give the total number of counts at the peak of interest (i.e., the number of γ-rays emitted by Hf at Eγ = 306.78 keV). As performed in the data analysis shown in Figure 8, also in this case, the error on the background was estimated as the square-root of counts in the same energy window used to integrate the γ-peak of interest (306.78 keV), while the counts due to the real decays occurring in the plasma grow up linearly with time. The condition that the signal overcomes the 3σ background level defines the measurement time needed to have a 3σ significance. Black dashed lines shown in the plot in Figure 10 represent iso-significance contours at each given combination of expected activity and measurement time. In particular, several significances in the range 1σ-7σ are labeled in the plot and the black region is such that the significance is worse than 1σ.
The feasibility of the measurement, depending on the relevance of lifetime decrease, is deemed to last from a day (in the case of six orders of magnitude collapse) up to 3 months (as shown in Figure 10). Assuming, for example, a variation of the lifetime of six orders of magnitude (corresponding to a rate of γ-rays in the multi-detectors array of 0.4 cps), about 15 h are necessary to obtain the 3σ significance, while about 1 h is enough to reach the 1σ significance. For a smaller variation of the lifetime (e.g., of five orders of magnitude, rate
Similar plots for 134Cs and 94Nb were also performed. Due to their shorter lifetime, the needed quantities of these two nuclides are much smaller than the one for the 176Lu. For example, a density of 106 cm−3 of 134Cs ions should be sufficient to get 3σ significance already after 7–11 h, at the expected in-plasma lifetime. The significance plot for 134Cs is shown in Figure 11.
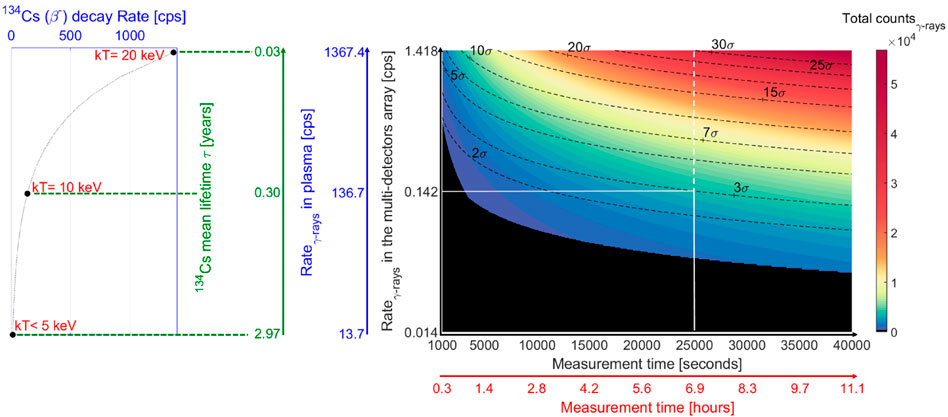
FIGURE 11. Total counts of gamma-rays emitted (pseudo-colors scale) and iso-significance contours (dashed lines) for different 134Cs isotope lifetimes (green vertical axis) as a function of the measurement lifetime. Blue and black vertical scales show the predicted decay rate in plasma and the counting rate measured in the array associated to the different isotope lifetime.
The green vertical axis reports on the lifetime expressed in years, starting from the mean lifetime of the neutral isotope (2.97 years) to the values of lifetimes predicted by the theory; the expected collapse of the lifetime as theoretically evaluated in [31] is about two orders of magnitude at around 20 keV, about one order of magnitude at around 10 keV while no variations are expected for values lower than 5 keV. Considering the trend of lifetime as a function of temperature as depicted in Figure 11, the effective activity in the plasma (expressed in cps)—assuming an ellipsoidal plasma of 1,500 cm3 in the volume with a relative concentration of 0.00001% of 134Cs with respect to the buffer density (1013 ions/cm3)—is shown in the blue vertical axis and, taking into account the efficiency estimated by Geant4 simulation, we obtained the counting rate expected in the γ detector array (black vertical axis).
Assuming, for example, a variation of the lifetime of an order of magnitude (counting rate of HPGe array of 0.14 cps), about 5 h are necessary to obtain the 3σ significance, while about 2 h are enough to reach the 2σ significance.
A similar plot for the 94Nb was performed (Figure 12). In this case, the expected collapse of the lifetime as theoretically evaluated in [31] is about five orders of magnitude (at around 10 keV). We assumed an ellipsoidal plasma of 1,500 cm3 in the volume with a concentration of 0.0001%. Also, in this case; several significance contours in the range 2σ–30σ are shown. Assuming a variation of the lifetime of four orders of magnitude (corresponding to a rate of γ-rays in the multi-detectors array of 0.18 cps) about 20 h is necessary to obtain the 3σ significance.
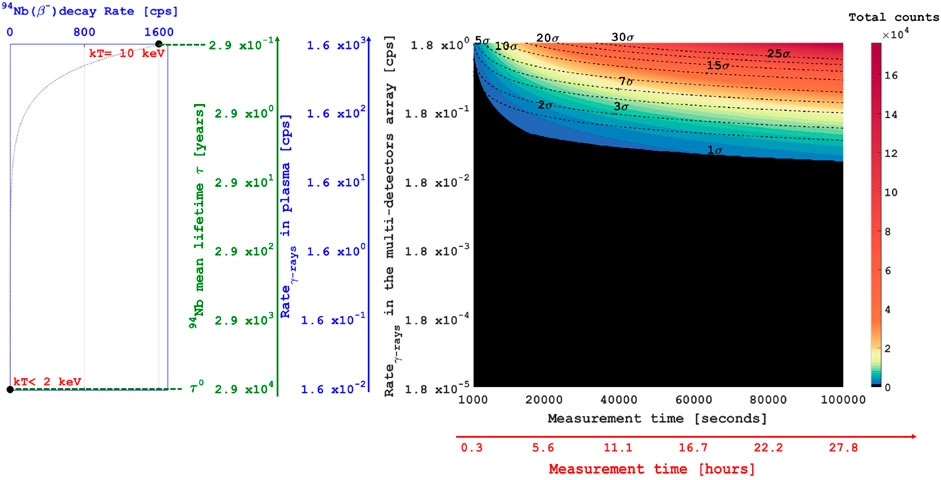
FIGURE 12. Total counts of gamma-rays emitted (pseudo-colors scale) and iso-significance contours (dashed lines) for different 94Nb isotope lifetimes (green vertical axis) as a function of the measurement lifetime. Blue and black vertical scales show the predicted decay rate in plasma and the counting rate measured in the array associated to the different isotope lifetime.
Finally, in the plots shown in Figure 13, the iso-significance curves at 3σ and 5σ were reported (in the log–log scale) for the 134Cs (Figure 13A) and 94Nb (Figure 13B) cases, respectively. The results suggested that for the 94Nb case, it will be possible to obtain the 3σ significance in a reasonable measurement time (within 3 months) only if the mean lifetime was at least three orders of magnitude shorter than the mean lifetime of the neutral isotope.
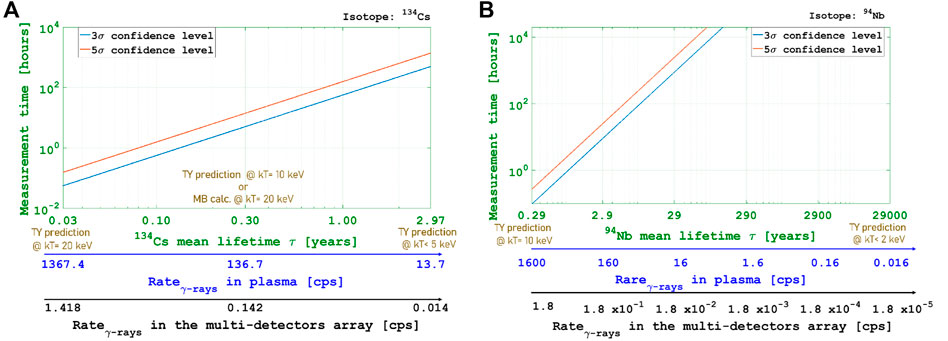
FIGURE 13. “Iso-significance” level at 3σ and 5σ reached after a given measurement time, reported on the y-axis, versus the decay rate (or the lifetime) of the 134Cs radionuclide (A) and of the 94Nb (B).
Regardless of the experimental result, it will put important constraints on theoretical model predictions. The possibility to discriminate among different models will depend on the uncertainties which will affect the lifetime measurement. The in-plasma λ can be, in fact, estimated by Equation (3) with an uncertainty of around 28% (considering error propagation). We have considered the following relative uncertainties for the parameters that will be measured:
6 Perspectives: The background suppression investigation
Investigations about the background suppression have been performed in order to increase the signal-to-background ratio, to reduce the very high rate due to the intense plasma self-emission, and to improve the working conditions of the HPGe detectors. For this purpose, we started to perform simulations in Geant4 considering the background contribution emitted from the plasma, in order to estimate the thickness of different kinds of absorbers to be used to shield detectors and the amount of Compton scattering due to absorber layers.
Preliminary simulations have been performed, assuming the emission from an isotropic point–like source placed in the center of the plasma chamber, with the an energy distribution as the typical background spectrum due to a plasma self-emission at n = 1013 cm−3 and with a volume of 1,500 cm3 (Figure 2).
Figure 14A shows the comparison of the spectra including only events depositing the entire energy in the detector (indicated as photopeak counts) and the spectrum of all detected events. The difference in the yield is of the order of 10% and supports the previous estimate of the background contribution to the detected γ-ray spectrum.
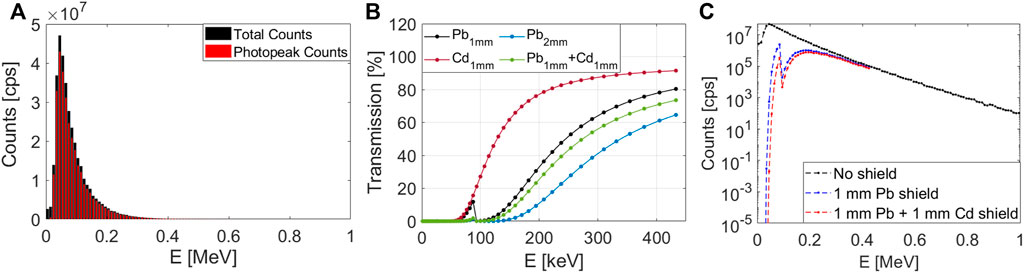
FIGURE 14. (A) Counting rate in HPGe detector array as a function of gamma-ray energy. Red area corresponds to photopeak events while the black one is associated to the total number of events hitting the array. (B) Transmission trend versus the γ-ray energy for different shield thicknesses and/or materials. (C) Shield effects on the background spectrum (log scale). The black dashed line corresponds to the rate in an unshielded array while blue and red ones show the suppression effect due to lead or lead and cadmium shields, respectively.
In order to reduce the intense rate in the detectors due to plasma emission up to 250 keV, but at the same time reach a good transmission at 306 keV, a specific shield will be used. Some preliminary considerations have been performed, comparing the transmission trends (NIST database [38]) of different thicknesses of lead with an additional shield of Cd or Cu, in order to fully suppress the contribution of plasma self-emission to the background up to 100 keV (also the radiation due to the lead K-edge). In Figure 14B, the transmission trends of different materials are shown as a function of the γ-ray energy. In our specific case, due to the background spectral shape, a shield made of 1 mm of Pb or 1 mm of Pb + 1 mm of Cd could be effective to significantly reduce the background. A preliminary evaluation of the two different shields on the background spectrum is shown in Figure 14C. The background below 200 keV decreases significantly when the shield is included. In perspective, simulations will be performed aimed at characterizing the system in order to have the best compromise between the increase in the signal-to-background ratio and the overall reduction of the background.
7 Advanced front-end electronics and acquisition system for operation at high background rate
The γ-ray hyper-pure Ge (HPGe) detector system of PANDORA has been developed to work under the particular conditions mentioned earlier as described in detail in [25, 39].
All the HPGe electronics chains are based on a custom R&D carried out in the framework of AGATA [40] and GALILEO [25] projects, to run HPGe detectors at high counting rates with the best γ-energy resolution.
Particular attention has been paid to the design of new pre-amplifiers which were modified and tested up to a rate of 60 kHz using different γ-ray sources, for simulating the typical low-energy background. The results already shown in [25, 39], indicate that HPGe detectors resolution did not show significative worsening at higher background rates, with a maximum γ-energy resolution value measured of about 3 keV.
To assure a high level of reliability and maintainability for running without interruptions over long-lasting measurements, the front and back-end electronics for PANDORA is now based on custom-made electronics, developed and adapted with the use of commercially high performance readout modules.
Finally, the HPGe detectors support infrastructure, including LV power supply, HV and the automatic HPGe cooling system has been designed to guarantee the best running conditions for the HPGe detectors and to maintain stable their performances (in terms of γ-energy resolution), during the long runs foreseen in PANDORA experiments. Of course, this system integrates the slow-control software to manage and monitor detector operation parameters, such as HV and temperature over time.
Furthermore, we want to explicitly mention that the numbers quoted in the study were currently obtained assuming negligible dead time, and further investigations are ongoing to evaluate its contribution mainly on the measurement time.
8 Conclusion
In this work, the numerical simulations performed in Geant4 focused on the design of the array of γ-ray detectors for the PANDORA project were presented. The best configuration in terms of the total number, type of detectors, and their optimal displacement around the trap, including collimation systems and shielding was investigated, modeling the response of the array and estimating the total efficiency for each configuration. The final detection system consists of an array of 14 HPGe detectors whose total photopeak efficiency is between 0.1 and 0.2%. The sensitivity of the PANDORA experiment was specifically checked in simulated experimental runs by exploring the feasibility of measuring the decay rates in terms of 3σ significance for the three physical cases of PANDORA. The run duration needed to get statistically meaningful results was determined. Expected measurement time, needed for at least 3σ significance, range from few hours (for 134Cs) to 70–80 days (for 176Lu, which is the most challenging case in PANDORA).
Data availability statement
The original contributions presented in the study are included in the article/Supplementary Material; further inquiries can be directed to the corresponding author.
Author Contributions
Conceptualization: EN, DS, SA, and DM. Numerical simulations: EN and SA. Formal analysis: EN, DS, SA, and DM. Funding acquisition: DS and DM. Methodology: EN, DS, SA, AGA, GM, AP, GT, and DM. Project administration: DS and DM. Software, EN, DS, SA, and DM. Supervision: DS and DM. Visualization: EN, DS, SA, LC, AGA, AGO, GM, MM, BM, DN, AP, GT, and DM. Writing–original draft: EN. Writing–sections of the manuscript: EN, DS, AGO, DN, and DM. Writing–review and editing: EN, DS, SA, LC, AGA, AGO, GM, MM, BM, DN, AP, GT, and DM. All authors have read and agreed to the published version of the manuscript.
Acknowledgments
The authors gratefully acknowledge the support of INFN by the Grants PANDORA_Gr3 (3rd Nat. Comm.).
Conflict of interest
The authors declare that the research was conducted in the absence of any commercial or financial relationships that could be construed as a potential conflict of interest.
Publisher’s note
All claims expressed in this article are solely those of the authors and do not necessarily represent those of their affiliated organizations, or those of the publisher, the editors, and the reviewers. Any product that may be evaluated in this article, or claim that may be made by its manufacturer, is not guaranteed or endorsed by the publisher.
References
1. Mascali D, Santonocito D, Amaducci S, Andò L, Antonuccio V, Biri S, et al. A novel approach to β-decay: PANDORA, a new experimental setup for future in-plasma measurements. Universe (2022) 8:80. doi:10.3390/universe8020080
2. Mascali D, Musumarra A, Leone F, Romano FP, Galatà A, Gammino S, et al. PANDORA, a new facility for interdisciplinary in-plasma physics. Eur Phys J A (2017) 53:145. doi:10.1140/epja/i2017-12335-1
3. Litvinov Y, Bosch F. Beta decay of highly charged ions. Rep Prog Phys (2011) 74:016301. doi:10.1088/0034-4885/74/1/016301
4. Bosch F, Faestermann T, Friese J, Heine F, Kienle P, Wefers E, et al. Observation of bound-state β−decay of fully ionized 187Re: 187Re-187Os cosmochronometry. Phys Rev Lett (1996) 77:5190–3. doi:10.1103/PhysRevLett.77.5190
5. Jung M, Bosch F, Beckert K, Eickhoff H, Folger H, Franzke B, et al. First observation of bound state β− decay. Phys Rev Lett (1992) 69:2164–7. doi:10.1103/PhysRevLett.69.2164
6. Bahcall JN. Theory of bound-state beta decay. Phys Rev (1961) 124:495–9. doi:10.1103/PhysRev.124.495
7. Klay N, Käppeler F, Beer H, Schatz G. Nuclear structure of 176Lu and its astrophysical consequences ii. 176Lu, a thermometer for stellar helium burning. Phys Rev C (1991) 44:2839–49. doi:10.1103/PhysRevC.44.2839
8. Cristallo S, Piersanti L, Straniero O, Gallino R, Dominguez I, Abia C, et al. Evolution, nucleosynthesis, and yields of low-mass asymptotic giant branch stars at different metallicities. ii. the FRUITY database. Astrophys J Suppl Ser (2011) 197:17. doi:10.1088/0067-0049/197/2/17
9. Busso M, Gallino R, Wasserburg GJ. Nucleosynthesis in asymptotic giant branch stars: Relevance for galactic enrichment and solar system formation. Annu Rev Astron Astrophys (1999) 37:239–309. doi:10.1146/annurev.astro.37.1.239
10. Naselli E, Mascali D, Biri S, Caliri C, Castro G, Celona L, et al. Multidiagnostics setups for magnetoplasmas devoted to astrophysics and nuclear astrophysics research in compact traps. J Instrum (2019) 14:10008. doi:10.1088/1748-0221/14/10/C10008
11. Mazzaglia M, Biri S, Emma G, Finocchiaro G, Galatà A, Mauro G, et al. A system for plasma parameters evaluation in compact magnetic traps aiming at in plasma β-decay investigation. Frontiers (2022). submitted in this special issue.
12. Agostinelli S, Allison J, Amako KA, Apostolakis J, Araujo H, Arce P, et al. GEANT4—a simulation toolkit. Nuclear Instruments and Methods in Physics Research Section A: Accelerators Spectrometers Detectors and Associated Equipment (2003) 506:250–303. doi:10.1016/S0168-9002(03)01368-8
13. Mauro G, Celona L, Torrisi G, Pidatella A, Naselli E, Russo F, et al. An innovative superconducting magnetic trap for probing β-decay in plasmas. Frontiers (2022). submitted in this special issue.
14. Geller R. Electron Cyclotron resonance ion sources and ECR plasmas. Bristol, UK: J W Arrowsmith Ltd (1996).
15. Skalyga V, Izotov I, Kalvas T, Koivisto H, Komppula J, Kronholm R, et al. Suppression of cyclotron instability in electron cyclotron resonance ion sources by two-frequency heating. Physics of Plasmas (2015) 22:083509. doi:10.1063/1.4928428
16. Naselli E, Mascali D, Mazzaglia M, Biri S, Rácz R, Pálinkás J, et al. Impact of two-close-frequency heating on ECR ion source plasma radio emission and stability. Plasma Sourc Sci Technol (2019) 28:085021. doi:10.1088/1361-6595/ab32f9
17. Ioffe M, Sobolev R. Confinement of a plasma in a trap formed by a combined magnetic field. J Nucl Energy Part C Plasma Phys (1965) 7:501–13. doi:10.1088/0368-3281/7/5/306
18. Naselli E, Ràcz R, Biri S, Mazzaglia M, Celona L, Gammino S, et al. Innovative analytical method for x-ray imaging and space-resolved spectroscopy of ECR plasmas. Condens Matter (2022) 7:5. doi:10.3390/condmat7010005
19. Biri S, Ràcz R, Perduk Z, Pàlinkàs J, Naselli E, Mazzaglia M, et al. Innovative experimental setup for X-ray imaging to study energetic magnetized plasmas. J Instrum (2021) 16:P03003. doi:10.1088/1748-0221/16/03/P03003
20. Mascali D, Naselli E, Torrisi G. Microwave techniques for electron cyclotron resonance plasma diagnostics. Review ofScientific Instruments (2022) 93:033302. doi:10.1063/5.0075496
21. Torrisi G, Naselli E, Mascali D, Donato LD, Sorbello G. mm-wave interferometer-polarimeter and profilometry design study for retrieving plasma density in the PANDORA experiment. Frontiers (2022). submitted in this special issue.
22. Rizzolo A, Barbisan M, Bizzotto L, Capobianco R, Muri MD, Fadone M, et al. Characterization of the SPIDER Cs oven prototype in the CAesium Test Stand for the ITER HNB negative ion sources. Fusion Engineering and Design (2019) 146:676–9. doi:10.1016/j.fusengdes.2019.01.053
23. Naselli E, Ràcz R, Biri S, Mazzaglia M, Galatà A, Celona L, et al. Quantitative analysis of an ECR Ar plasma structure by x-ray spectroscopy at high spatial resolution. J Instrum (2022) 17:C01009. doi:10.1088/1748-0221/17/01/C01009
24. Gumberidze A, Trassinelli M, Adrouche N, Szabo CI, Indelicato P, Haranger F, et al. Electronic temperatures, densities, and plasma X-ray emission of a 14.5 GHz electron-cyclotron resonance ion source. Rev Scientific Instr (2010) 81:033303. doi:10.1063/1.3316805
25. Goasduff A, Mengoni D, Recchia F, Valiente-Dobon JJ, Menegazzo R, Benzoni G, et al. The GALILEO γ-ray array at the legnaro national laboratories. Nuclear Instruments and Methods in Physics Research Section A: Accelerators Spectrometers Detectors and Associated Equipment (2021) 1015:165753. doi:10.1016/j.nima.2021.165753
26. Naselli E, Mascali D, Caliri C, Castro G, Celona L, Galatà A, et al. Nuclear β-decays in plasmas: How to correlate plasma density and temperature to the activity. EPJ Web Conf (2020) 227:02006. doi:10.1051/epjconf/202022702006
28. Goasduff A, Mengoni D, Recchia F, Valiente-Dobón J, Menegazzo R, GBenzoni , et al. The GALILEO γ-ray array at the legnaro national laboratories. Nuclear Inst. and Methods inPhysics Research A (2021) 1015.
29. van Loef E, Dorenbosa P, van Eijka C, Kramer K, Gudel H. Scintillation properties of LaBr3:Ce3+ crystals: Fast, efficient and high-energy-resolution scintillators. Nuclear Instruments and Methods in Physics Research Section A: Accelerators Spectrometers Detectors and Associated Equipment (2002) 486:254–8. doi:10.1016/s0168-9002(02)00712-x
30. Galata A, Mascali D, Mishra B, Naselli E, Pidatella A, Torrisi G. On the numerical determination of the density and energy spatial distributions relevant for in-plasma β-decay emission estimation. Frontiers (2022). submitted in this special issue.
31. Takahashi K, Yokoi K. Beta-decay rates of highly ionized heavy atoms in stellar interiors. Data Nucl Data Tables (1983) 36:375–409. doi:10.1016/0092-640X(87)90010-6
32. Taioli S, Vescovi D, Busso M, Palmerini S, Cristallo S, Mengoni A, et al. Theoretical estimate of the half-life for the radioactive 134Cs and 135Cs in astrophysical scenarios. arXiv:2109.14230 (2021).
33. Palmerini S, Busso M, Vescovi D, Naselli E, Pidatella A, Mucciola R, et al. Presolar grain isotopic ratios as constraints to nuclear and stellar parameters of asymptotic giant branch star nucleosynthesis. ApJ (2021) 921:7. doi:10.3847/1538-4357/ac1786
34. Mazzaglia M, Celona L, Gammino S, Naselli E, Reitano R, Torrisi G, et al. Optical emission spectroscopy measurements of hydrogen and argon plasmas at high resolution. IL NUOVO CIMENTO (2021) 44:58. doi:10.1393/ncc/i2021-21058-9
35. Giarrusso M, Avila G, Zanna GD, Landi E, Leone F, Munari M, et al. High resolution spectropolarimetry: From astrophysics to ECR plasmas. J Instrum (2018) 13:C11020. doi:10.1088/1748-0221/13/11/C11020
36. Mascali D, Castro G, Biri S, Rácz R, Pálinkás J, Caliri C, et al. Electron cyclotron resonance ion source plasma characterization by X-ray spectroscopy and X-ray imaging. Review of Scientific Instruments (2016) 87:02A510. doi:10.1063/1.4939201
37. Mishra B, Pidatella A, Biri S, Galatà A, Naselli E, Rácz R, et al. A novel numerical tool to study electron energy distribution functions of spatially anisotropic and non-homogeneous ECR plasmas. Phys Plasmas (2021) 28:102509. doi:10.1063/5.0061368
38.[Dataset] Technology of Standards NNI. X-ray form factor, attenuation and scattering tables (2020).
39. Goasduff A, Santonocito D, Menegazzo R, Capra S, Pullia A, Raniero W, et al. A high resolution γ-ray array for the PANDORA plasma trap. Frontiers (2022). submitted in this special issue.
Keywords: Geant4 simulations, magnetoplasma, gamma-ray detectors, beta decay, nucleosynthesis, plasma trap, plasma diagnostics
Citation: Naselli E, Santonocito D, Amaducci S, Celona L, Galatà A, Goasduff A, Mauro GS, Mazzaglia M, Mishra B, Napoli DR, Pidatella A, Torrisi G and Mascali D (2022) Design study of a HPGe detector array for β-decay investigation in laboratory ECR plasmas. Front. Phys. 10:935728. doi: 10.3389/fphy.2022.935728
Received: 04 May 2022; Accepted: 04 July 2022;
Published: 03 August 2022.
Edited by:
Giuseppe Verde, Ministry of Education, Universities and Research, ItalyReviewed by:
Mengoni Daniele, National Institute of Nuclear Physics of Padova, ItalyFederico Ferraro, University of Milan, Italy
Copyright © 2022 Naselli, Santonocito, Amaducci, Celona, Galatà, Goasduff, Mauro, Mazzaglia, Mishra, Napoli, Pidatella, Torrisi and Mascali. This is an open-access article distributed under the terms of the Creative Commons Attribution License (CC BY). The use, distribution or reproduction in other forums is permitted, provided the original author(s) and the copyright owner(s) are credited and that the original publication in this journal is cited, in accordance with accepted academic practice. No use, distribution or reproduction is permitted which does not comply with these terms.
*Correspondence: Eugenia Naselli, ZXVnZW5pYS5uYXNlbGxpQGxucy5pbmZuLml0