 Qianqian Gao
 Dayong Lv1
- 1School of Financial Technology, Shanghai Lixin University of Accounting and Finance, Shanghai, China
- 2School of International Economy and Trade, Shanghai Lixin University of Accounting and Finance, Shanghai, China
As the global economy continues to integrate, COVID-19 is affecting businesses around the world, causing the financial system to become more complicated. The complicated relationship between various agents in the financial system makes potential hazards more easily transmitted. Most studies of systemic risks have focused on single-layer networks, and macroeconomic fluctuations have not been quantified in multi-layer models of financial networks. In this paper, three different macroeconomic shock scenarios (showing upward, downward, and random trends) are constructed to affect the firm’s business activities, and a multi-layer financial network model is developed to simulate systemic risk under macroeconomic fluctuations. Firms with medium and high leverage and small asset sizes, as well as banks with smaller asset sizes and fewer bank-firm credit linkages, are found to be more likely to default. The study also found that average firm leverage exhibits two inflection points, causing banks’ default probabilities to “rise, then fall, and then rise,” with the inflection point value being the lowest under the upward trend of macroeconomics. In addition, the higher the ratio of firm loans to total bank assets, the more likely the bank is to default. Appropriate loan maturity extension has also helped to reduce systemic risk, especially in light of the macroeconomic downward trend. Furthermore, improving the capital adequacy ratio can reduce the bank’s default probability under macroeconomic fluctuations.
1 Introduction
The global financial crisis in 2008 raised the concern of scholars about the systemic risk of the financial system [1–3]. The growing interconnectedness of the global economy, the rapid expansion of Internet finance, and the impact of COVID-19 on the global economy have all increased financial risks in recent years. Furthermore, as a result of complex links among different agents such as banks, firms, and non-bank financial organizations, risks in the financial system could spread more likely. Banking is at the heart of the financial system, and previous research has focused on the interbank lending market, considering the impact of interbank lending linkages, interbank networks, and other factors. Conversely, studies on systemic risk related to credit linkages between banks and firms have received less attention [2]. Since firms are the primary recipients of bank loans, and their growth impacts the national economy and bank operations, this paper constructs a multi-layer financial network system based on interbank lending linkages and the bank-firm credit linkages, and conducts a systemic risk analysis.
Researchers have focused on the interbank lending market in the past [3–11]. Allen and Gale [4] developed a representative model of financial risk contagion based on direct interbank linkages. Iori et al. [5] examined the impact of the interbank lending market on heterogeneous and homogeneous banking systems. Georg [6] and Grilli et al. [7] both evaluated the impact of interbank linkages on systemic risk. On the other hand, some are from a perspective of the structure of the interbank lending network [3, 8–11].
In addition to the interbank market, a growing number of researchers are depicting another agent in the complex financial system that has an impact on bank operations: the firms, and investigating systemic risk under the bank-firm network. First, there are studies on systemic risk based on a single-layer bank-firm network [12–14]. Riccetti et al. [12] built an agent-based macroeconomic model to study the interaction of bank-firm credit markets at different economic cycle stages. Based on the simplified credit network in [14], Di Guilmi et al. [13] constructed a bank-firm bilateral credit network and used statistical physics to illustrate firm and bank behavior as well as the dynamic evolution of the bank-firm credit network. The results of this study indicate that when firm defaults and causes the failure of the bank, it has a systemic impact and affects the degree distribution of the credit network. Later, other researchers further deconstructed the bank-firm network to investigate systemic risk in a multi-layer bank-firm network [15–17]. Using actual data from Spanish banks and firms in 2007, Luu and Lux [15] separated the original bank-firm bilateral network into layers representing different industrial sectors, focusing on the overlap and correlation of multi-layer Spanish bank-firm credit networks. Li et al. [16] and Ma et al. [17] both developed multi-layered bank-firm networks based on loan maturity, which included short-term and long-term lending networks. Li et al. [16] empirically examined the contribution of banks and firms to systemic risk by using DebtRank. In addition to credit linkages between banks and firms, they also refined the interbank and interfirm co-financing linkages. DebtRank is shown to be higher in banks with large assets, and firms are the main contributors to systemic risk. Ma et al. [17] used a four-layer bank-firm network model to analyze the impact of network structure and bank and firm behavior on systemic risk. Specifically, the relationship between banks and firms with different loan maturities and common assets between banks and firms with different investment cycles was studied. The study found that the joint shock of a multi-layer network has a far greater impact on systemic risk than the joint effect of any two-layer network.
Several researchers have joined the interbank network to analyze systemic risk based on the bank-firm network [18–21]. Lux [18] built a random model of the bilateral bank-firm credit network, embedded it into the interbank network model, and examined the systemic risk in this multi-layer network system using a large number of simulations. The bank-firm credit channel has been found more likely to trigger contagion than interbank lending. Using actual data from Brazilian banks and firms, Silva et al. [19] extensively examined the systemic risk produced by external shocks to the net equity of banks and firms, using a multi-layer financial network model including interbank lending linkages and bank-firm credit linkages [20]. In addition to state-owned banks being most vulnerable to firm shocks, network structure matters a lot. Multi-layer networks and full consideration of relationships between economic agents are suggested for examining systemic risk. Grilli et al. [21] modeled the dynamic evolution of a bank-firm credit network and an interbank lending network in terms of endogenous learning mechanisms, simulated the effects of agents’ behavior, and recommended paying attention to the credit market structure and avoiding network overconcentration. Unlike other researchers, based on bank-firm credit linkages, Sui et al. [22] built a bank-firm multi-financial association network model, and found that firms in this network had power-law tails.
Systemic risk research has yielded useful results, but there are still some problems: 1) Most systemic risk research is based on the interbank lending market, but less is done on bank-firm credit networks, and much of it is based on single-layer bank-firm credit networks. 2) A few have studied the systemic risk of a multi-layer financial network system based on bank-firm credit and interbank lending ([18, 19, 21]). When developing the multi-layer financial network system model, previous research failed to consider the external macroeconomic impact on business activities, and failed to conduct quantitative analyses of systemic risk within that system under macroeconomic fluctuations. In this paper, we develop three macroeconomic shock scenarios (upward, downward, and random trends). Based on the behavior of banks and firms, the bank-firm credit network, and the interbank lending network, a multi-layer financial network system model with dynamic evolution under macroeconomic fluctuations is constructed, and some recommendations for banks are proposed.
2 The model
In this paper, banks and firms are considered major agents in the multilayer financial network system. Interbank networks are established based on interbank lending linkages, and bank-firm networks are established based on credit linkages. Simultaneously, the impact of macroeconomic fluctuations on firm operations is considered. Lastly, this paper constructs a dynamically evolving multi-layer financial network model, based on the interbank lending network and the bank-firm credit network.
2.1 The behavior of agents
The profits of firms are generated by firms engaged in production and operation activities. A firm’s output is proportional to the capital invested in production activities. According to Grilli et al. [7], the output of firm
Where
Firms generate revenue by selling their products. A firm’s operating profit is its revenue after deducting the principal and interest of its loan. The operating profit of firm
Where
where
Based on the above description, the net worth of firm
When the firm’s net worth is satisfied
Where
The balance sheet of bank
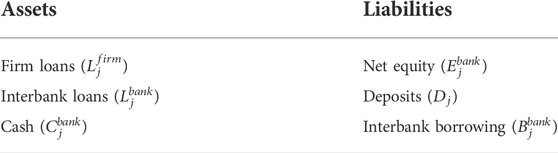
TABLE 1. The balance sheet of bank
The total assets of bank
The third term on the right side of Eq. 7 represents, in turn, the bank’s net equity, deposits, and interbank borrowing. Set the ratio of firm loans (
Under Basel III regulatory requirements, the capital adequacy ratio
The bank’s income is derived from the interest margin, which is expressed as
It includes the bank’s income from firm loans, its loan income from interbank loans, its borrowing expenses from interbank loans, its deposits interest expenses.
Where
2.2 Bank-firm network and interbank network
According to De Masi and Gallegati [24], in the Italian bank-firm credit network, the degree of banks is much larger than that of firms, small banks have fewer creditors, and hubs between banks with a large number of borrowers exist. Following Lux’s [18] bank-firm credit network model, this study assumes that each bank’s asset size follows the Pareto distribution, and that the distribution of the bank’s total assets
In the bank-firm network,
Where
As mentioned above, the degree of banks (number of debtor firms) is related to the size of their assets. Similarly, the degree of firms (number of creditor banks) is related to the size of their debt. Thus, the connectivity degree of each firm and bank in the bank-firm credit network can be expressed as:
To establish bank-firm credit linkages, we initialize the number of available connections of the nodes as the degree of the node, randomly select the bank and firm nodes and establish credit links for them (the higher the degree, the greater the probability of selecting the node), while decreasing the number of available connections of the corresponding node, and continue this process until the number of available connections in the system has been exhausted. When the bank-firm credit linkage is established, the bank-firm loans to firms are allocated based on their loan sizes, and eventually the bank-firm credit network is complete.
As a direct channel for spreading systemic risk, interbank lending has been extensively studied. In this paper, we use the interbank market model proposed by Lux [18] and Montagna and Lux [25], in which interbank lending linkages are generated using a probability function related to bank asset size, and the probability of interbank lending linkage between bank
Where
Since the initial size of interbank loans of bank
Based on the above description, an example diagram of the multi-layer financial network in this paper is shown in Figure 1.
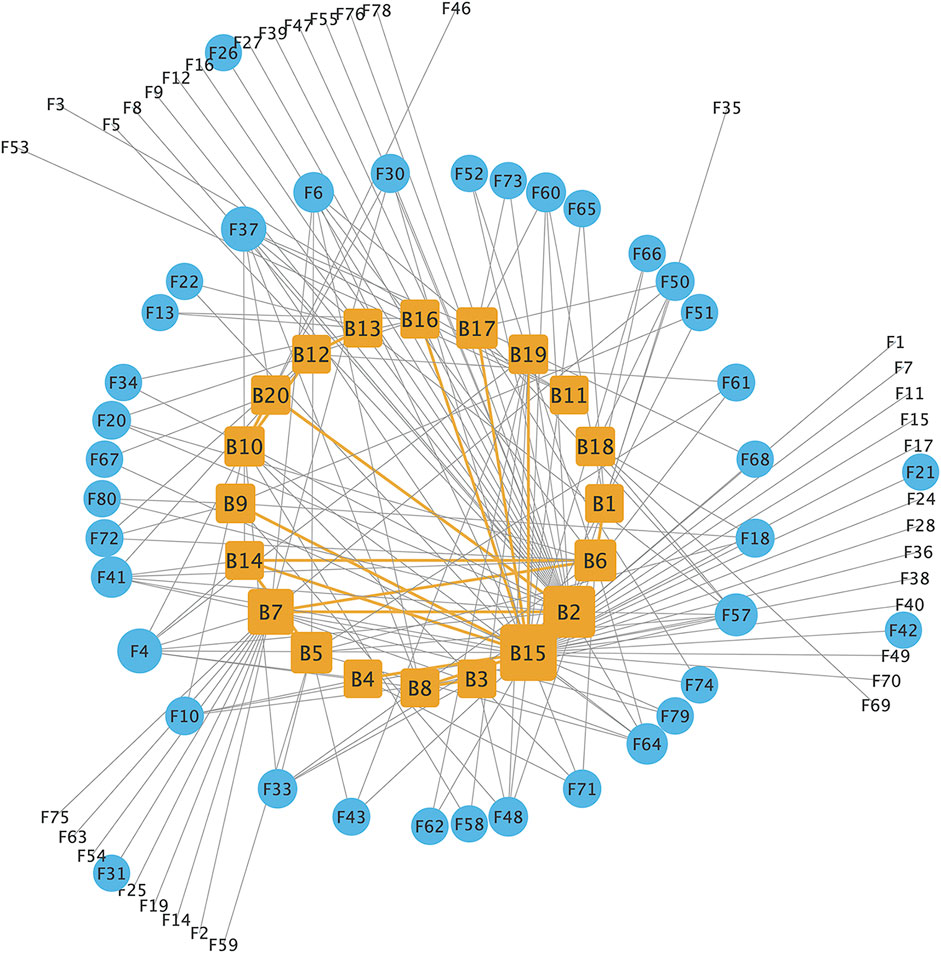
FIGURE 1. An example diagram of the multi-layer financial network (The figure contains 20 banks and 80 firms. The orange rectangular nodes represent the banks, and the blue circular nodes represent the firms in the system; The orange lines represent interbank lending linkages, and grey lines represent bank-firm credit linkages).
As can be seen from Figure 1, the multi-layer financial network includes the interbank lending network and the bank-firm credit network. In the network, there are clearly several clusters of firm nodes with credit linkages to the same banks, and therefore individual banks (such as bank nodes B2, B15, B7, etc.) have more credit linkages; these banks have larger asset sizes and more interbank links, making them core nodes.
2.3 The dynamic evolution of multi-layer financial network system
In the multi-layer financial network system proposed in this paper, macroeconomic fluctuations affect the business activities of firms. To continue their business, firms seek loans from banks. In order to establish credit linkages between banks and firms, banks evaluate their leverage and own assets; if their own assets are insufficient, they seek interbank lending. If macroeconomic shocks cause firms to fail and go into liquidation in the course of their operations, their creditor banks will suffer losses (Eq. 5), resulting in lower borrowing opportunities and higher lending rates for other firms (Eqs 17 and 18). When creditor banks suffer large losses and fail, they will directly affect the banks and firms with which they have credit links. In consequence, macroeconomic fluctuations would directly affect firms, but indirectly affect banks via credit linkages between banks and firms, potentially causing systemic risks. Figure 2 shows the dynamic evolution of the multi-layer financial network system.
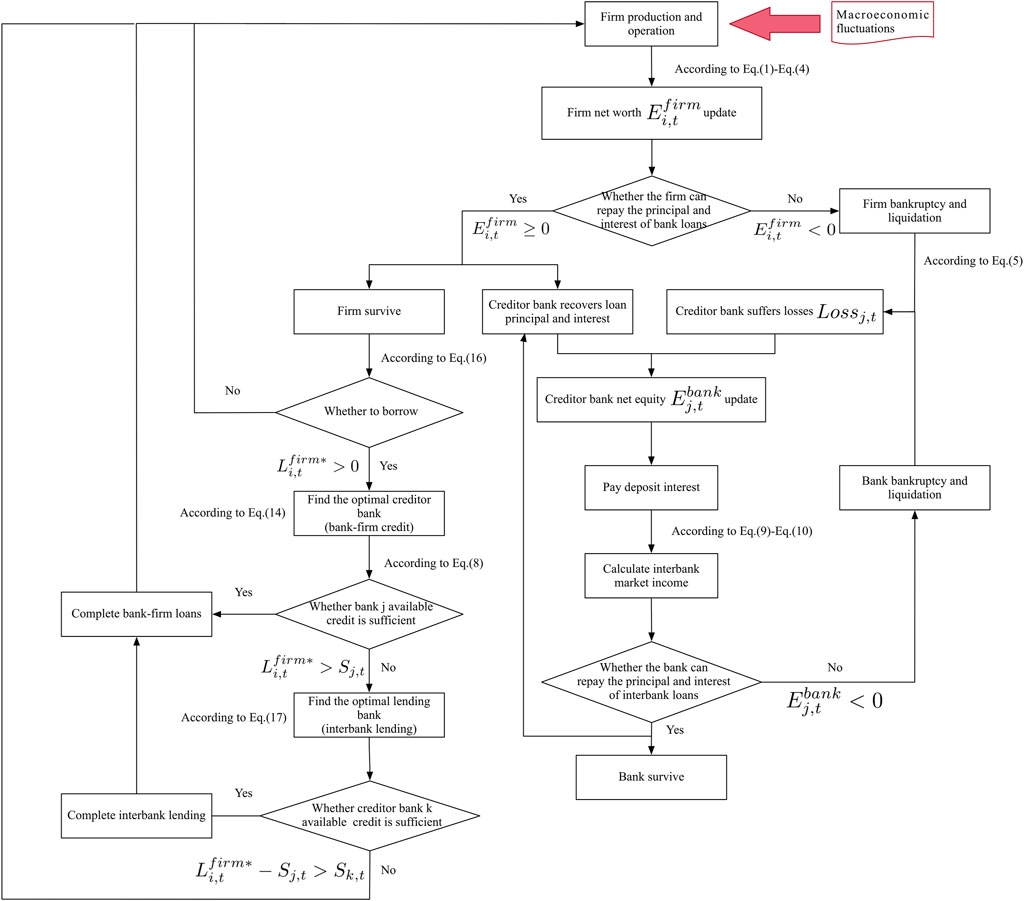
FIGURE 2. The dynamic evolution process of the multi-layer financial network system.
This paper explores a multi-layer financial network system, in which firms modify their business plans and dynamically change their business inputs in response to macroeconomic fluctuations. In our model, the firm’s leverage is
Depending on their risk assessment, banks lend or not to firms. A bank’s risk aversion is represented by
where
The interest rate on a bank’s loan to a firm depends on the bank’s net equity and the firm’s leverage. Usually, the higher the bank’s net equity, the lower the loan rate; likewise, the higher the firm’s leverage, the higher the rate. According to Gatti et al. [14], Eq. 18 shows the loan rate between banks and firms.
where
As described in this paper, the dynamic evolution algorithm for the multi-layer financial network system follows.
Step 1: Under various macroeconomic shock scenarios, the firm produces and conducts business and generates operating profits
Step 2: The firm repays the current principal and interest due, and recalculates its net equity
Step 3: If
Step 4: The bank recovers the due interbank lending and receives interest income on interbank lending; at the same time, it repays the due interbank borrowings and pays interest on those borrowings to the creditor bank;
Step 5: The bank pays interest on deposits and recalculates its net equity
Step 6: If
Step 7: The surviving firm calculates its new credit demand
Step 8: The evolution of the system stops when there are no surviving banks or firms, or when the maximum time step is reached.
When a firm’s credit demand is not met, it will continue to produce and operate with its own finances, but its production size will shrink, reducing revenues, which may result in the firm being unable to repay existing debts in the later stages of our evolution.
In general, this study is based on complex network theory, which regards banks and firms as different types of nodes, and builds interbank and bank-firm credit networks through interbank lending linkages and credit linkage between banks and firms. Based on these two networks, a multi-layer financial network system model is constructed, where exogenous shocks are transmitted between agents, and the dynamics of the model exacerbate contagion and risk accumulation.
3 Simulation and analysis
Based on the dynamic multi-layer financial network model, this paper simulates and evaluates systemic risk under various macroeconomic scenarios.
As existing similar research sets the number of banks to the number of firms differently [7, 12, 13, 18, 24], we chose a moderate ratio (1:40), setting the number of banks to be
The time steps in this model represent the firm’s production and the bank-firm credit cycle, with each time step performing the firm’s production, bank-firm credit, and interbank lending. In this study, all banks fail or the overall system stabilizes after around 500 steps, with no further failures. Thus, the total time steps in macroeconomic shock scenarios are
3.1 Results of the benchmark model
In Figure 3, we explore the leverage and asset size of default firms as the multi-layer financial network system evolves. As a result of the study, firms with medium and high leverage (leverage >0.3) and small asset size (asset size <10) are more likely to default under various macroeconomic shock scenarios. Furthermore, under the upward trend of the macroeconomic, some firms with small asset sizes (asset size <5) and low leverage (leverage <0.3) show a certain risk of default, and the lower the leverage, the longer the survival duration of such firms. When the macroeconomic trend is downward, firms with small asset sizes and low leverage fail less early in the evolution of the system, and some of these firms may fail as the system evolves over a longer period (450–500 steps). When the macroeconomic trend is random, the bankruptcy of small asset size and low leverage firms is relatively rare, making them the most stable.
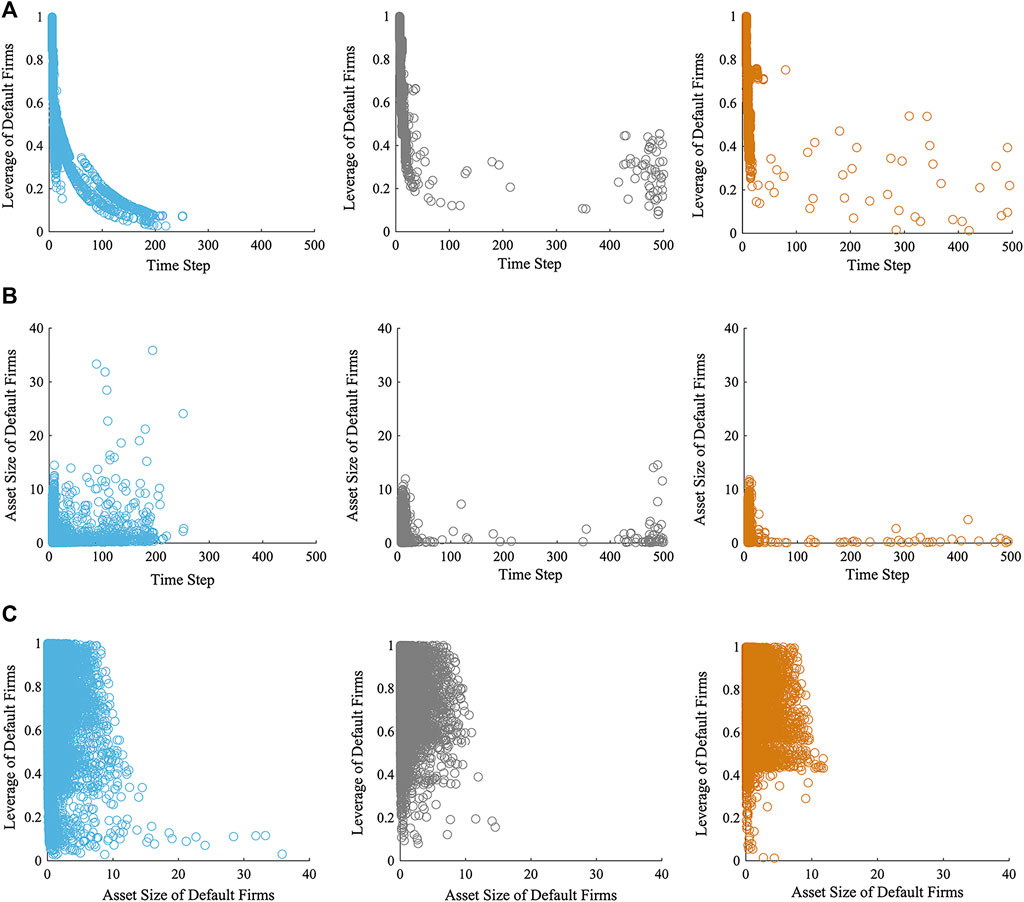
FIGURE 3. (A)The leverage of each default firm and the time step of its default; (B) The asset size of each default firm and the time step of its default; (C) Scatter plot between the asset size and its leverage of each default firm. Blue, gray and orange represent macroeconomic fluctuations in upward, downward and random trends, respectively.
Under macroeconomic shocks, medium and high leveraged firms (leverage >0.3) are faced with higher repayment pressure, their operating profits are insufficient to repay the principal and interest of the loan. During the dynamic evolution of the multi-layer financial system, these firms’ net worth continues to decrease, their assets are relatively small, and these firms go bankrupt in a short time. When the macroeconomic trend is upward, net asset losses for firms with small asset sizes (asset size <10) and low leverage (leverage <0.3) are eased as their profits increase; however, such relief is limited (Figure 4A), and they continue to go bankrupt. In the case of a downward macroeconomic trend, low-leverage firms develop a certain amount of net assets when their profit rates are quite high. In light of the restrictions on firm leverage, firms with relatively small assets (asset size <5) are limited in their ability to accumulate assets. Therefore, such firms still went bankrupt in the late stages of the macroeconomic downturn (Figure 4B). When the macroeconomic trend is random (Figure 4C), the profit rate of firms is very variable, and the system as a whole is generally stable despite the failures of high-leverage firms.
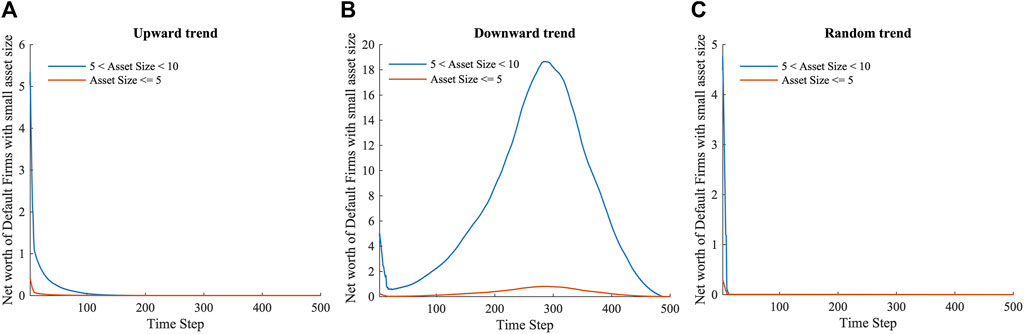
FIGURE 4. The net worth of default firms with small asset size and low leverage when the macroeconomic fluctuations in upward (A), downward (B) and random (C) trends, respectively.
The paper also analyzes the performance of banks and obtains Figure 5. The study shows that banks with a larger asset size (asset size >60) and more bank-firm credit linkages (credit linkages >300) are less likely to default during the evolution of the multi-layer financial network system, as well as exhibiting better risk resistance under various macroeconomic scenarios. While banks with relatively smaller asset sizes (asset size <60) and fewer bank-firm credit linkages (credit linkages <300) are more likely to default. When the macroeconomic trend is upward, banks in the multi-layer financial network system default on a large scale at first, then the number of bank failures gradually decreases, and then the system stabilizes. In cases of downward and random macroeconomic trends, the number of bank failures grows continuously, then declines, and the system eventually stabilizes.
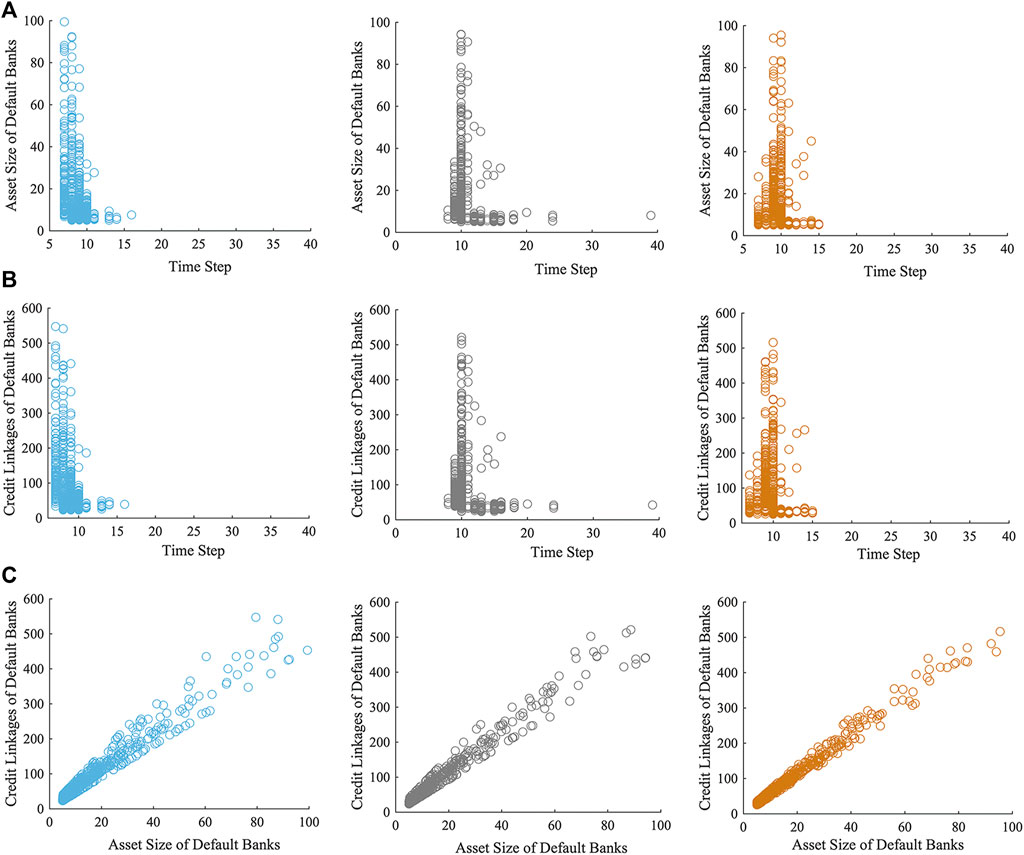
FIGURE 5. (A) The asset size of each default bank and the time step of its default; (B) The credit linkages of each default bank and the time step of its default; (C) Scatter plot between the asset size and its credit linkages of each default bank. Blue, gray and orange represent macroeconomic fluctuations in upward, downward and random trends, respectively.
In our model, banks with more bank-firm credit linkages also tend to be larger banks (Eq. 13), which have larger credit exposures, but also more diversified credit risks. Due to its own capital and better risk resistance to macroeconomic shocks, when a firm defaults, the shock to the bank is relatively dispersed, decreasing its failure chances. Figures 6, 7 are created to better explain and clarify the results of Figure 5. As Figure 5 is combined with Figure 6, which shows the relationship between failed banks’ asset size and bank-firm credit linkages, the analysis reveals that large banks that have failed are debtor banks in the lending market. Under macroeconomic shocks, this part of the bank faces both the risk of default of its lending firms, as well as its own interbank lending repayment pressures, so that the risk of default is higher. In contrast, small and medium-sized banks are relatively weaker and have fewer bank-firm credit linkages, so the impact when firms default is more concentrated on them. There is a greater risk of failure for these banks, whether they are creditors or debtors in the interbank loan market.
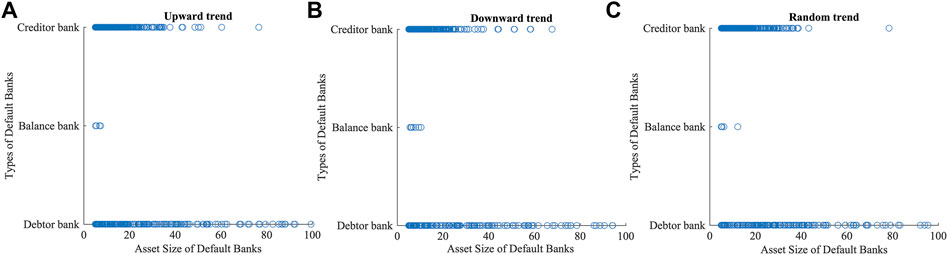
FIGURE 6. Asset size and the types of interbank lending of default banks when the macroeconomic fluctuations in upward (A), downward (B) and random (C) trends, respectively.
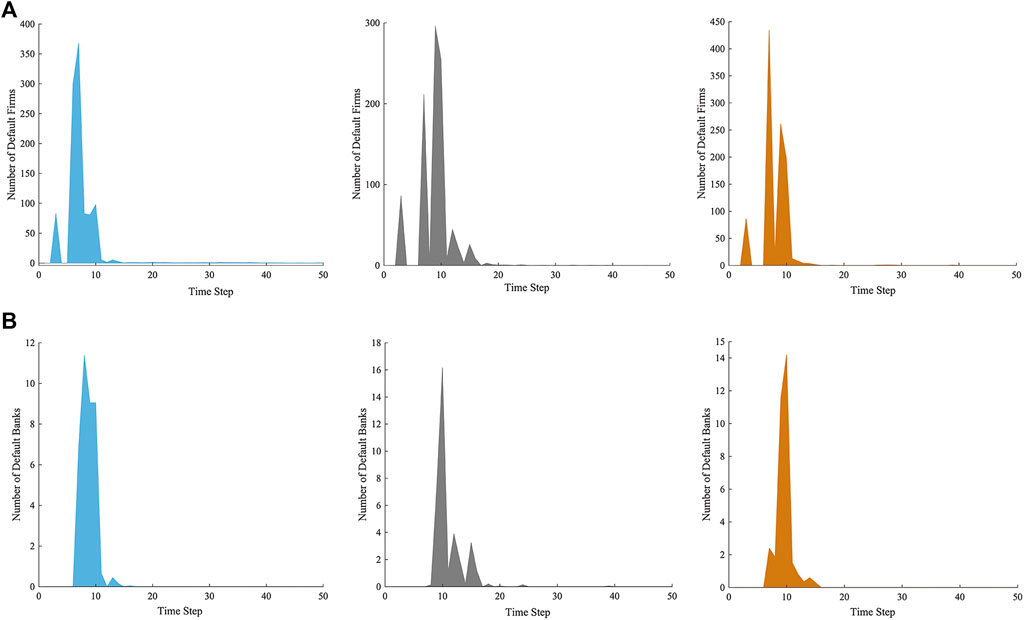
FIGURE 7. (A) The number of default firms and the time step of their default; (B) The number of default banks and the time step of their default. Blue, gray, and orange represent macroeconomic fluctuations in upward, downward and random trends, respectively.
Based on bank and firm defaults, we examined the propagation of systemic risk in the multi-layer financial network system, as shown in Figure 7.
It is argued that during the early stages of the macroeconomy’s upward trend, a large number of small and medium-sized banks failed because of massive firm failures (more than 360). As the macroeconomy improves, the losses of surviving firms decrease, default risk decreases, and the impact on banks weakens, and the number of failed banks gradually decreases. Only part of firms suffer serious losses and fail at first (less than 90 firms), and the banking system is less affected by the downward trend. As the macroeconomy continues to deteriorate, firms continue to accumulate losses and fail in increasing numbers, while their impact on banks with small and medium assets and fewer bank-firm credit links increases, resulting in more failed banks. As all the firms with serious losses closed down, the system gradually stabilized, and bank failures decreased. When the macroeconomic trend is random, the profit rate of firms is highly volatile, but as the system gradually stabilizes, the number of failed banks rises and then declines.
3.2 Effect of firm average leverage, the ratio of firm loans to total bank assets, and loan maturity on systemic risk
This paper also explores the systemic risk associated with various firm average leverage (
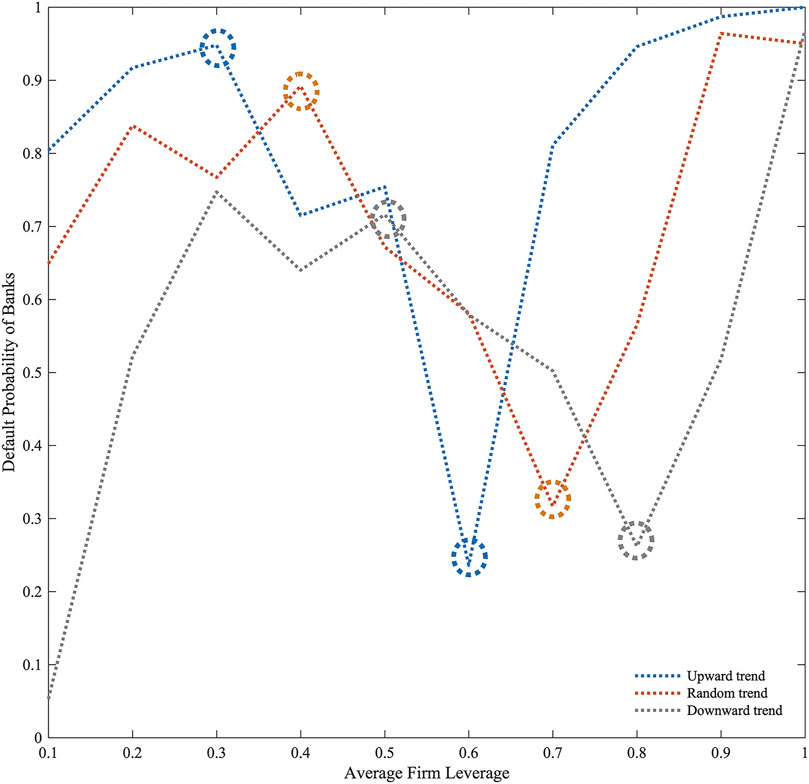
FIGURE 8. The default probability of banks with different average firm leverage.
Based on Figure 8, banks’ default probability increases as firms’ leverage increases, with a trend of first rising, then falling, and then rising again during the three macroeconomic scenarios. In general, higher leverage means more credit for firms and greater risk and return for banks. The model used in this paper assumes a constant amount of credit between banks and firms, higher leverage implies higher repayment pressure on firms, and poorer risk resilience. A low leverage firm has a low repayment pressure, low default probability, and low credit income for its creditor banks. As leverage increases (before the first inflection point, i.e., when leverage is not large enough), the repayment pressure increases for the firm, and the default probability increases. Considering the bank’s own funding costs (interbank lending and savings), and the bank’s credit income currently low, the default probability of the bank has also increased. As leverage increases (beyond the first inflection point), the interest rate on bank-firm credit increases, and the firm’s default probability increases but is still relatively low, so credit income for the bank exceeds credit losses, risk is reduced, and thus default probability decreases. Firm leverage increases more (beyond the second inflection point), and its repayment pressure rises sharply, and its default probability increases significantly. As a result, the banks’ credit income cannot mitigate their credit losses, and overall banks’ risk is increased.
Moreover, we find that firms’ average leverage has the smallest inflection point in the uptrend and the largest in the downtrend. The analysis indicates that firms’ profit rates have been rising from a lower level under the upward trend of the macroeconomic, which points to the large-scale failure of firms at an earlier stage. They are also more sensitive to rising leverage, indicating that the inflection point appears earlier. In contrast, firm profit rates have been falling since a higher level, so the inflection point appears later under macroeconomic downturns. Under random macroeconomic trends, firm profit rates are volatile, and the inflection point occurs between uptrends and downtrends. This study suggests banks must consider firm leverage in its entirety, and can appropriately relax loan approval restrictions when firm leverage is low, but must strictly control loan approval when firm leverage is high. As macroeconomic conditions change, banks should maintain appropriate control over firm leverage.
In Figure 9, the default probability of banks increases as the ratio of firm loans to total bank assets rises under the downward trend of the macroeconomic. With macroeconomic fluctuations in upward and random trends, bank default probability increases with firm loans to bank assets; however, when the ratio is too high, it decreases marginally. The higher the ratio of firm loans to total bank assets, the greater the reliance of banks on bank-firm credit income, and the greater the impact of macroeconomic fluctuations. Accordingly, as firm loans to total bank assets increase, so does default probability. Under the downward trend of the macroeconomic, firm profit rates continue to decline, increasing the pressure on firms to repay their loans. When the macroeconomic trend is upward, with firm profit rates increasing, sufficient loan supplies enable surviving firms to accumulate capital, and the default risk is continually lowered. Banks also obtain higher income through bank-firm loans, and the default probability will be reduced. Under the random trend of the macroeconomy, due to the uncertainty of firm income, when the ratio of firm loans to total bank assets is too large, the default probability of banks also shows a certain downward trend, but not as obvious as the upward trend. As a result of the varied firm loan ratios to total bank assets, it suggests that banks should limit the quantity of bank-firm loans to strike a balance between risks and profits.
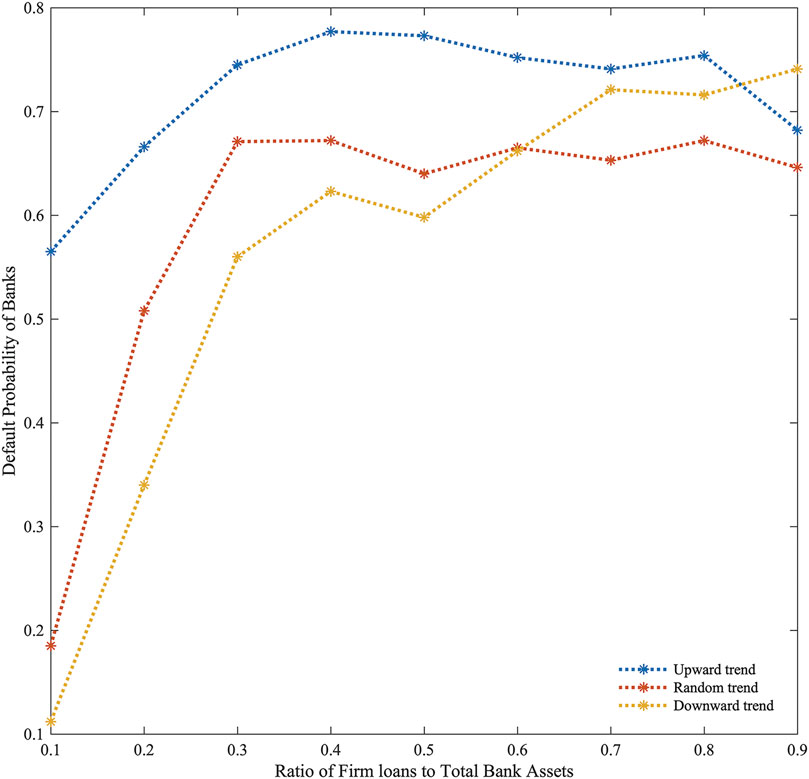
FIGURE 9. The default probability of banks with different ratios of firm loans to total bank assets.
As shown in Figure 10, extending bank loan maturity results in different systemic risks. Under the upward trend of the macroeconomic, the default probability of banks decreases and then increases, while under the downward trend of the macroeconomic, the default probability increases slightly, then gradually decreases, and finally increases slightly again. Under the random trend of the macroeconomic, the default probability of banks displays a trend of rising first, then falling, and then rebounding.
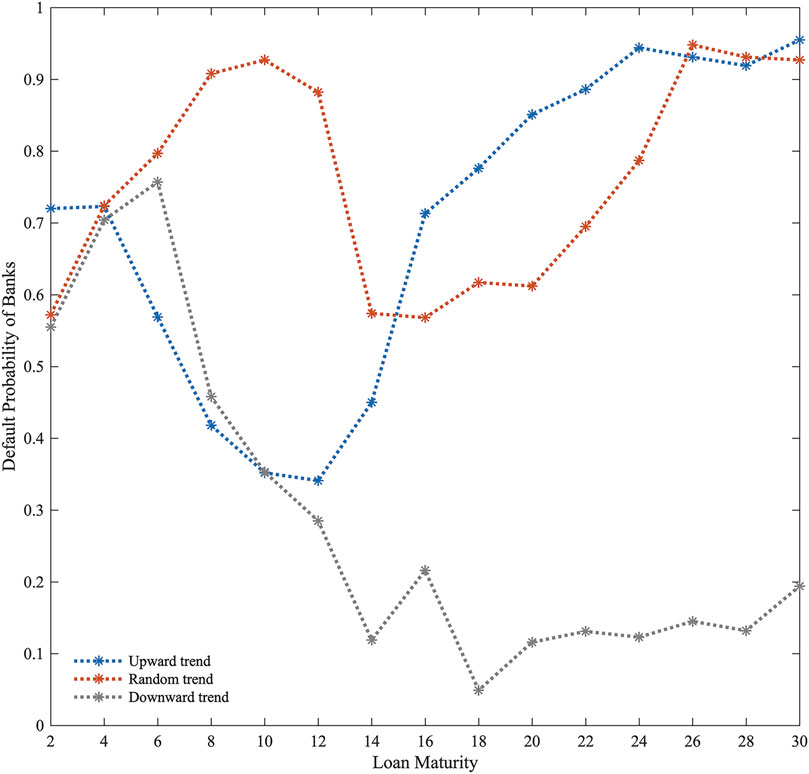
FIGURE 10. The default probability of banks with different loan maturity.
Based on our study, macroeconomic conditions are improving under an upward trend, and extending bank loan maturities helps firms expand production, generate more profits, reduce firm default risk, and reduce bank default risk. However, an overly long loan maturity (more than 12) will put an excessive amount of capital pressure on the bank (mostly from depositor interest payments in our model), increasing default probabilities. Under the downward trend of the macroeconomic, expanding the bank loan maturity to a certain level (less than 6) has limited effect on relieving firm payback pressure, and is also unfavorable to reducing production inputs in time, reducing losses, and avoiding defaults. Thus, banks’ default probability has increased. In contrast, extending the bank loan maturity to a substantial amount (6–18) might allow firms to keep continuous production without defaulting due to overwhelming payback pressure, therefore reducing bank default risk. As in the uptrend, if the bank loan maturity is too long (more than 18), the bank’s own capital is overstressed, and the default probability rises again, but it is not as obvious as in the uptrend.
Under the random macroeconomic trend, firms’ profit rate is unstable. Shorter loan maturities (less than 10) will result in significant losses due to the firms’ blind investment in production, and default probabilities will increase for both firms and banks. Firms’ default probabilities decrease as payback pressure drops, and banks’ default probabilities decrease as loan maturities are extended (10–16). Due to excessive capital pressure, the default probability of banks increases when the loan maturity is long enough (more than 16). A suitable extension of loan maturity reduces the repayment pressure on firms, making them more resilient to the impact of macroeconomic fluctuations, reducing their default risk, and reducing the default risk of banks, assuming the amount of their loans does not change.
3.3 Effect of the capital adequacy ratio on systemic risk
As shown in Figure 11, this paper simulates the systemic risk under different capital adequacy ratios to investigate the impact of central bank regulation. According to Figure 11, the overall default probability of banks reduces continuously as the capital adequacy ratio increases. Moreover, the default probability of banks is lower under the random macroeconomic trend than it is under the upward and downward trends.
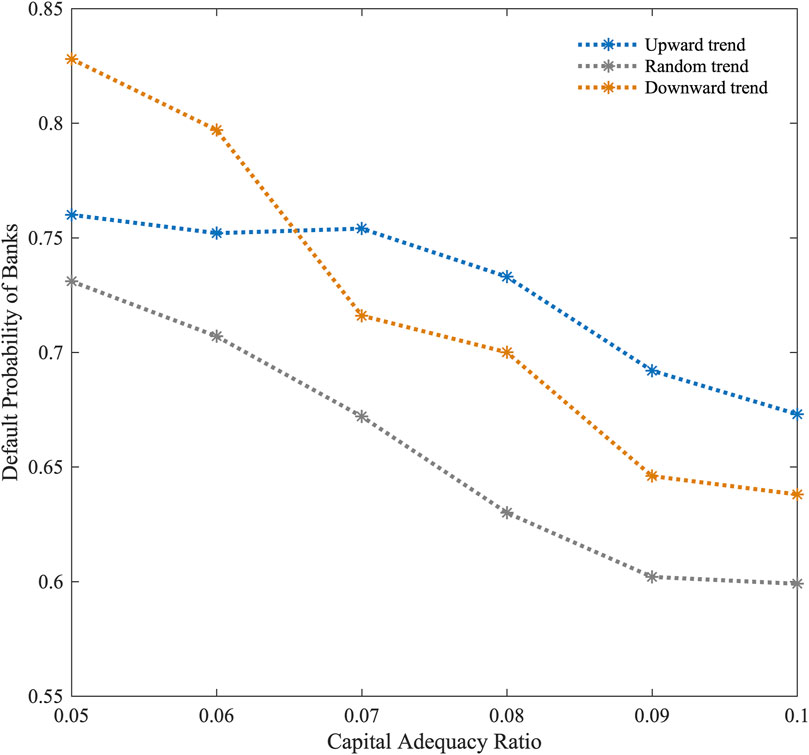
FIGURE 11. The default probability of banks with different capital adequacy ratio.
If the capital adequacy ratio is low (
Despite the downward trend of the macroeconomic, banks’ risk losses are also lower because their interest income is lower, which limits their credit behavior, therefore, their default probability is lower than that of the upward trend. By contrast, under the random macroeconomic trend, banks and firms’ income is in a relatively stable fluctuation state, the overall risk of the multi-layer network system is less than that of upward and downward trends, the overall default probability is also relatively low, and as capital adequacy ratios increase, the default probability of banks reduces as well.
4 Conclusion
First, this paper calculates the connection degree between banks and firms, establishes credit linkages between banks and firms, and establishes interbank lending linkages based on interbank lending assets and a probability function. The impact of macroeconomic fluctuations is also examined. Finally, a multi-layer financial network system model is developed based on bank-firm credit networks and interbank lending networks.
Based on the benchmark model, it is discovered that firms with medium and high leverage and small assets are more likely to default under the three macroeconomic scenarios. Moreover, some firms with small assets and low leverage may also be at risk of default. Due to lower profit rates, these defaults tend to occur at the beginning of the upward trend and at the end of the downward trend. It is found that banks with larger assets and more bank-firm credit linkages are more stable. When the macroeconomic trend is upward, banks default on a large scale and then gradually stabilize, whereas when the trend is downward or random, the number of default banks gradually increases and then gradually decreases.
The effect of various parameters on systemic risk in the multi-layer financial network system is then examined, and it is discovered that bank default probability rises when the average leverage of firms increases, then falls, then rises again. The inflection point of the average leverage of firms appears the earliest under a macroeconomic upward trend. It proposes that, when firm leverage is low, banks can loosen loan approval limitations and enhance credit income; when firm leverage is high, banks should closely regulate loan approval and promote access to firm loans to reduce default risk.
In addition, the default probability of banks increases as firm loans to total bank assets rise. Under upward and random macroeconomic trends, banks’ default probability decreases to some extent when the ratio is too high. In the case of upward and random trends, sufficient loan supply allows firms to expand their production inputs, resulting in higher profitability, larger net assets, and capital accumulation, and lower default risks. It is recommended that banks extend loan maturities appropriately to reduce repayment pressure and cope with macroeconomic shocks, while total loans remain stable. The study also shows that improving capital adequacy ratios can help reduce the risk of bank failure under macroeconomic fluctuations, which are important tools for regulators to reduce systemic risk.
This study contributes to the field by constructing a multi-layer dynamic evolution model based on interbank lending and bank-firm credit networks, which can be used to simulate systemic risk. This paper also offers some recommendations for banks to reduce systemic risk. In the future, inter-firm connections will be considered to create a more realistic multi-layer financial network. Furthermore, actual data from the financial system and publicly traded firms can be gathered for empirical analysis.
Data availability statement
The original contributions presented in the study are included in the article/Supplementary Material, further inquiries can be directed to the corresponding author.
Author contributions
QG performed the research and wrote the manuscript, all authors contributed to the interpretation of results and the improvement of the manuscript. All authors approved it for publication.
Funding
We are grateful for the support from National Natural Science Foundation of China (72101151) and Humanity and Social Science Youth Foundation of Ministry of Education of China (21YJC790082).
Conflict of interest
The authors declare that the research was conducted in the absence of any commercial or financial relationships that could be construed as a potential conflict of interest.
Publisher’s note
All claims expressed in this article are solely those of the authors and do not necessarily represent those of their affiliated organizations, or those of the publisher, the editors and the reviewers. Any product that may be evaluated in this article, or claim that may be made by its manufacturer, is not guaranteed or endorsed by the publisher.
Footnotes
1
2In previous related studies, the ratio of banks to firms varies. Among Grilli et al. [7], the ratio is 1:20; Riccetti et al. [12], the ratio is 1:25; Di Guilmi et al. [13], the ratio is 1:10; Lux [18], the ratio is 1:40; and De Masi and Gallegati [24], the ratio is 1:80. Despite the different ratio, the number of firms in the financial system is significantly larger than that of banks. Based on these studies, we chose three sets of ratios (1:20, 1:40, and 1:60) for simulation experiments. The results demonstrate a similar trend for the results under varied numbers of banks and firms, and we chose a reasonable ratio.
References
1. Silva W, Kimura H, Sobreiro WA. An analysis of the literature on systemic financial risk: A survey. J Financial Stab (2017) 28:91–114. doi:10.1016/j.jfs.2016.12.004
2. Badarau C, Lapteacru I. Bank risk, competition and bank connectedness with firms: A literature review. Res Int Bus Finance (2020) 51:101017. doi:10.1016/j.ribaf.2019.03.004
3. Eboli M. A flow network analysis of direct balance-sheet contagion in financial networks. J Econ Dyn Control (2019) 103:205–33. doi:10.1016/j.jedc.2019.04.007
5. Iori G, Jafarey S, Padilla FG. Systemic risk on the interbank market. J Econ Behav Organ (2006) 61:525–42. doi:10.1016/j.jebo.2004.07.018
6. Georg CP. The effect of the interbank network structure on contagion and common shocks. J Banking Finance (2013) 37:2216–28. doi:10.1016/j.jbankfin.2013.02.032
7. Grilli R, Tedeschi G, Gallegati M. Bank interlinkages and macroeconomic stability. Int Rev Econ Finance (2014) 34:72–88. doi:10.1016/j.iref.2014.07.002
8. Liu AQ, Paddrik M, Yang SY, Zhang XJ. Interbank contagion: An agent-based model approach to endogenously formed networks. J Banking Finance (2020) 112:105191. doi:10.1016/j.jbankfin.2017.08.008
9. Gencay R, Pang H, Tseng MC, Xue Y. Contagion in a network of heterogeneous banks. J Banking Finance (2020) 111:105725. doi:10.1016/j.jbankfin.2019.105725
10. Lenzu S, Tedeschi G. Systemic risk on different interbank network topologies. Physica A: Stat Mech its Appl (2012) 391:4331–41. doi:10.1016/j.physa.2012.03.035
11. Li SW, He JM. Investigating interbank contagion risks under different network structures. J Ind Eng Eng Manag (2012) 26:71–6+99. doi:10.13587/j.cnki.jieem.2012.04.013
12. Riccetti L, Russo A, Gallegati M. Firm–bank credit network, business cycle and macroprudential policy. J Econ Interact Coord (2021) 17:475–99. doi:10.1007/s11403-021-00317-6
13. Di Guilmi C, Gallegati M, Landini S, Stiglitz JE. An analytical solution for network models with heterogeneous and interacting agents. J Econ Behav Organ (2020) 171:189–220. doi:10.1016/j.jebo.2020.01.017
14. Gatti DD, Gallegati M, Greenwald B, Russo A, Stiglitz JE. The financial accelerator in an evolving credit network. J Econ Dyn Control (2010) 34:1627–50. doi:10.1016/j.jedc.2010.06.019
15. Luu DT, Lux T. Multilayer overlaps and correlations in the bank-firm credit network of Spain. Quant Finance (2019) 19:1953–74. doi:10.1080/14697688.2019.1620318
16. Li SW, Liu YF, Wu CQ. Systemic risk in bank-firm multiplex networks. Financ Res Lett (2020) 33:101232. doi:10.1016/j.frl.2019.07.005
17. Ma QT, YangWK , He JM. Investigating bank-firm systemic risk within a multilayer network. Chin J Manag Sci (2021) 29:1–14. doi:10.16381/j.cnki.issn1003-207x.2020.0803
18. Lux T. A model of the topology of the bank-firm credit network and its role as channel of contagion. J Econ Dyn Control (2016) 66:36–53. doi:10.1016/j.jedc.2016.03.002
19. Silva TC, Alexandre MD, Tabak BM. bank lending and systemic risk: A financial-real sector network approach with feedback. J Financial Stab (2018) 38:98–118. doi:10.1016/j.jfs.2017.08.006
20. Silva TC, da Silva MA, Tabak BM. Systemic risk in financial systems: A feedback approach. J Econ Behav Organ (2017) 144:97–120. doi:10.1016/j.jebo.2017.09.013
21. Grilli R, Tedeschi G, Gallegati M. Business fluctuations in a behavioral switching model: Gridlock effects and credit crunch phenomena in financial networks. J Econ Dyn Control (2020) 114:103863. doi:10.1016/j.jedc.2020.103863
22. Sui X, He JM, Li L. Construction of Firm-bank network model with multi-financial links and simulation analysis. J Sys Sci Math Scis (2020) 40:2370–80. doi:10.12341/jssms14062
23. Fan H, Gao QQ. The influence of macroeconomic dynamic fluctuations on the stability of the banking system. J Sys Mang (2017) 26:1104–11. https://kns.cnki.net/kcms/detail/detail.aspx?FileName=XTGL201706013&DbName=CJFQ2017.
24. De Masi G, Gallegati M. Bank-firms topology in Italy. Empir Econ (2012) 43:851–66. doi:10.1007/s00181-011-0512-x
Keywords: systemic risk, multi-layer financial network system, bank-firm credit network, interbank lending network, behavior of agents
Citation: Gao Q, Lv D and Jin X (2022) Systemic risk of multi-layer financial network system under macroeconomic fluctuations. Front. Phys. 10:943520. doi: 10.3389/fphy.2022.943520
Received: 13 May 2022; Accepted: 12 July 2022;
Published: 10 August 2022.
Edited by:
Umberto Lucia, Politecnico di Torino, ItalyReviewed by:
Benjamin Miranda Tabak, Fundação Getúlio Vargas, BrazilFarooq Akram, Norges Bank, Norway
Copyright © 2022 Gao, Lv and Jin. This is an open-access article distributed under the terms of the Creative Commons Attribution License (CC BY). The use, distribution or reproduction in other forums is permitted, provided the original author(s) and the copyright owner(s) are credited and that the original publication in this journal is cited, in accordance with accepted academic practice. No use, distribution or reproduction is permitted which does not comply with these terms.
*Correspondence: Qianqian Gao, Z2FvcWlhbnFpYW5AbGl4aW4uZWR1LmNu