 Yuqiang Xu
 Qiandeng Li1
- 1School of Petroleum Engineering, China University of Petroleum (East China), Qingdao, China
- 2Shandong Ultra-deep Drilling Process Control Tech RD Center, Qingdao, China
Hydraulic jet fracturing technology is one of the main means to develop low permeability and deep reservoirs. However, due to the large displacement and high sand ratio in the construction process, the erosion wear of high-speed sand particles on the hydraulic jet fracturing nozzle is more serious, which reduces the erosion cutting ability of the nozzle. Therefore, based on Finnie principle, a three-dimensional model of nozzle is established to analyze the influence of internal multiphase flow field distribution, flow rate, sand diameter and etc. on nozzle erosion. The results show that the erosion velocity increases nonlinearly with the increase of inlet pressure. With the increase of erosion time, the erosion rate gradually tends to be stable; with the increase of fluid viscosity, the erosion rate decreases; with the increase of the diameter and mass flow rate of the erosion particles, the erosion speed also increases, indicating that the size and mass flow rate of the erosion particles are the main factors affecting the erosion effect of the nozzle. The research results have important guiding significance for the rational use of the tool and the extension of the service life of the tool.
Introduction
Hydraulic jet fracturing converts high-pressure energy carried by abrasive jets into high-speed jets, which impact and cut casing walls and rocks to form perforation holes. During this process, the quartz sand, fracturing fluid and proppant used in sandblasting and perforating all need to pass through the nozzle to reach the formation. Under high pressure and high displacement conditions, due to the small size of the nozzle, when the quartz sand passes through the nozzle, it will erode the nozzle and severely deform the internal flow channel, which will greatly reduce the erosion cutting ability of the nozzle [1–5]. Therefore, studying the erosion law of hydraulic fracturing nozzles under high pressure and high displacement has important guiding significance for tool design and prolonging tool life [6].
In the process of hydraulic fracturing, the quartz sand carried by the nozzle under high pressure and high displacement has a complex erosion process on the nozzle. The main erosion forms are divided into cutting, micro-deformation, fatigue and diffusion [7]. Huang Zhongwei [8] et al. studied the influence of nozzle installation position, nozzle material, jet parameters and nozzle structure on the erosion degree. Li Zhi [9] et al. studied the effect of particle size, hardness and shape on the erosion behavior according to the properties of the abrasive itself, and found that the large-sized abrasive with high hardness under high jet pressure severely eroded the nozzle, and established a corresponding model. However, the established model has not been experimentally verified, so it is difficult to guide the design and application of the nozzle.
For nozzle erosion simulation research generally only the nozzle internal structure, nozzle installation location and internal flow field research, such as Wang Zhiguo [10]; the erosion behavior of nozzle in the process of hydraulic fracturing was not simulated and analyzed by changing the parameters of solid particle size, erosion angle and shape. Therefore, based on the Finne [11, 12] principle, this paper first establishes a three-dimensional model of the nozzle, analyzes the influence of the flow field distribution, flow rate, sand particle diameter and etc. on the nozzle erosion in the hydraulic jet fracturing tool, verifies the established model, and clarifies the erosion mechanism of the nozzle under the conditions of high pressure and high displacement, which provides guidance for the design and application of the nozzle.
Erosion Mechanism
Erosion is a wear phenomenon caused by the impact of multiphase flow medium on the material surface. According to the different flow media, erosion can be divided into sandblasting erosion and slurry erosion. Sandblasting erosion is the erosion of material by high-speed airflow carrying solid particles, while slurry erosion is the erosion of material by high-speed flow carrying solid particles [6, 13]. Thus, the erosion in the process of hydro-jet fracturing belongs to mud erosion. For hydraulic jet fracturing tools, the body material is No. 45 steel, which is plastic material, so it is mainly affected by cutting erosion. The nozzle material is cemented carbide, brittle material, mainly affected by impact fatigue erosion [14].
Finnie first proposed the plastic material erosion theory in 1958 [12]. He believes that the particles cut through the surface of the material continuously under low angle impact, resulting in pits that cause erosion loss of material quality. In this theory, the erosion volume of the material is proportional to the kinetic energy of the particle, which satisfies the functional relationship with the impact angle of the particle, and is inversely proportional to the flow stress of the material itself, which is expressed by Eq. 1. Since the erosion wear results caused by particles under large impact angles predicted by the model were smaller than the experimental values, Finnie revised the model in 1960 [11].
In 1963, Bitter [15] proposed the erosion deformation theory, which is mainly based on the energy balance in the erosion process. Bitter divided the erosion wear into deformation wear and cutting wear.
The erosion amount caused by deformation is:
The erosion caused by cutting is:
The theory is very consistent with the experimental data of brittle materials under different impact angles, and the erosion wear of plastic materials can also be reasonably explained, but it lacks the support of physical models.
E/CRC model [16–24], after particles impact on the wall, the failure on the wall is related to wall material, particle characteristics, impact angle and other factors. Compared with other models, the E/CRC model takes into account the particle hardness and shape factors, and the numerical results are closer to the experimental results. The wear rate calculation equation in the E/CRC model is:
where, ER is the wear rate (mass loss per unit area), kg/m2; C and n are 2.17 × 10⁻⁷ and 2.41, respectively; BH is Brinell Hardness; FS is the particle shape coefficient, which is 0.2 for spherical particles; Vp is particle velocity, m/s; β is particle impact angle, rad.
Compared with other models, Finnie model considers energy balance in the erosion process, and impact angle; furthermore, in the revised model, the particle shape was taken in to consideration as well, therefore, in this paper, Finnie model is used to explore the hydraulic fracturing nozzle erosion.
Physical Model
Simplification and Definition of Physical Model
According to the nozzle structure for hydraulic fracturing, a three-dimensional physical model is established after simplification, as shown in Figure 1. It is mainly composed of nozzle, inlet and outlet. The inlet diameter of fluid channel is 60 mm, the cavity height is 300 mm, the outlet diameter is 9.5 mm, and the number of outlets is 6.
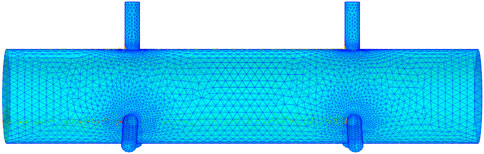
FIGURE 1. Three dimensional simplified physical model.
The pressure change at the inlet of the fluid channel is set at 30–50 MPa according to the research needs, with a step size of 5 MPa. The outlet pressure is 10 Pa, the fluid partial density is 1 g/cm3, the dynamic viscosity is 1 mPa s, and it is incompressible. The fluid partial control equation is:
Among them,
The erosion particle diameter is 0.6 mm, the density is 2.65 g/cm3, and the mass flow rate is 1 kg/s. The control equation is:
Finnie model is selected for the erosion model, which mainly affects the erosion wear of metal surface from the flow velocity and impact angle of solid particles, and the expression is shown in Eq. 3. Since the relative Reynolds number of particles is far less than 1, the fluid drag is Stokes equation.
In the formula, m is erosion wear rate, kg/m2; cj cut particle fraction for idealization; HV is particle surface hardness, Pa; α is erosion angle, degree;
Model Test Verification
In order to verify the validity of the established physical model, the experimental results of Shi et al [25]. were used for verification. In the erosion test, the test scheme is: displacement 3 m3/min, sand ratio 10%, cumulative injection time from 30 to 175 min, erosion time 30 min, after erosion found that nozzle diameter increased from 9.5 to 10.6 mm, nozzle mass decreased from 95 to 94, reduced by 1 g; the erosion wear of the test was 5.5 × 10⁻⁷ kg/s. Figures 2, 3 show the streamline diagram of the nozzle and the distribution of erosion particles when the simulated parameters are consistent with the experimental parameters. It can be seen from the figures that the erosion velocity is the largest at the nozzle.
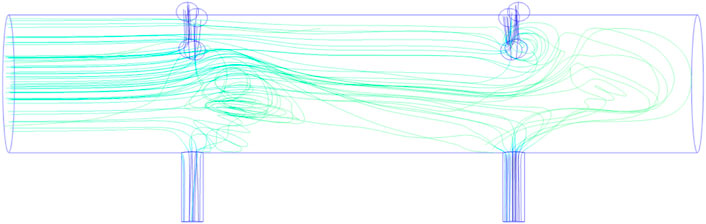
FIGURE 2. The schematic of streamline of fluid flow.
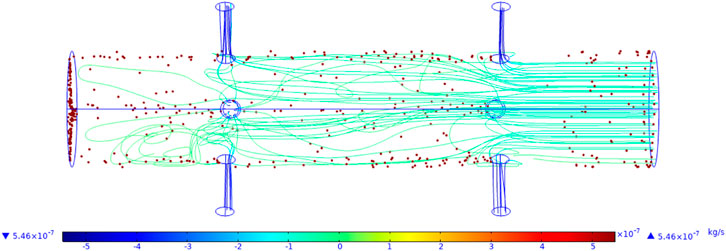
FIGURE 3. The distribution of the erosion particles in the nozzle.
Analysis and Discussion on Erosion Results
The initial values of liquid phase and particle phase were set as follows: the density of fracturing fluid was 1050 kg/m3, the viscosity was 150 mPa s, the sand density was 2650 kg/m3, and the average particle size was 0.6 mm. The inlet velocity is 10 m/s, and the sand mass rate is 1 kg/s. The pressure distribution, velocity distribution, streamline distribution and particle trajectory in the tool are obtained by numerical simulation, as shown in Figures 4, 5.
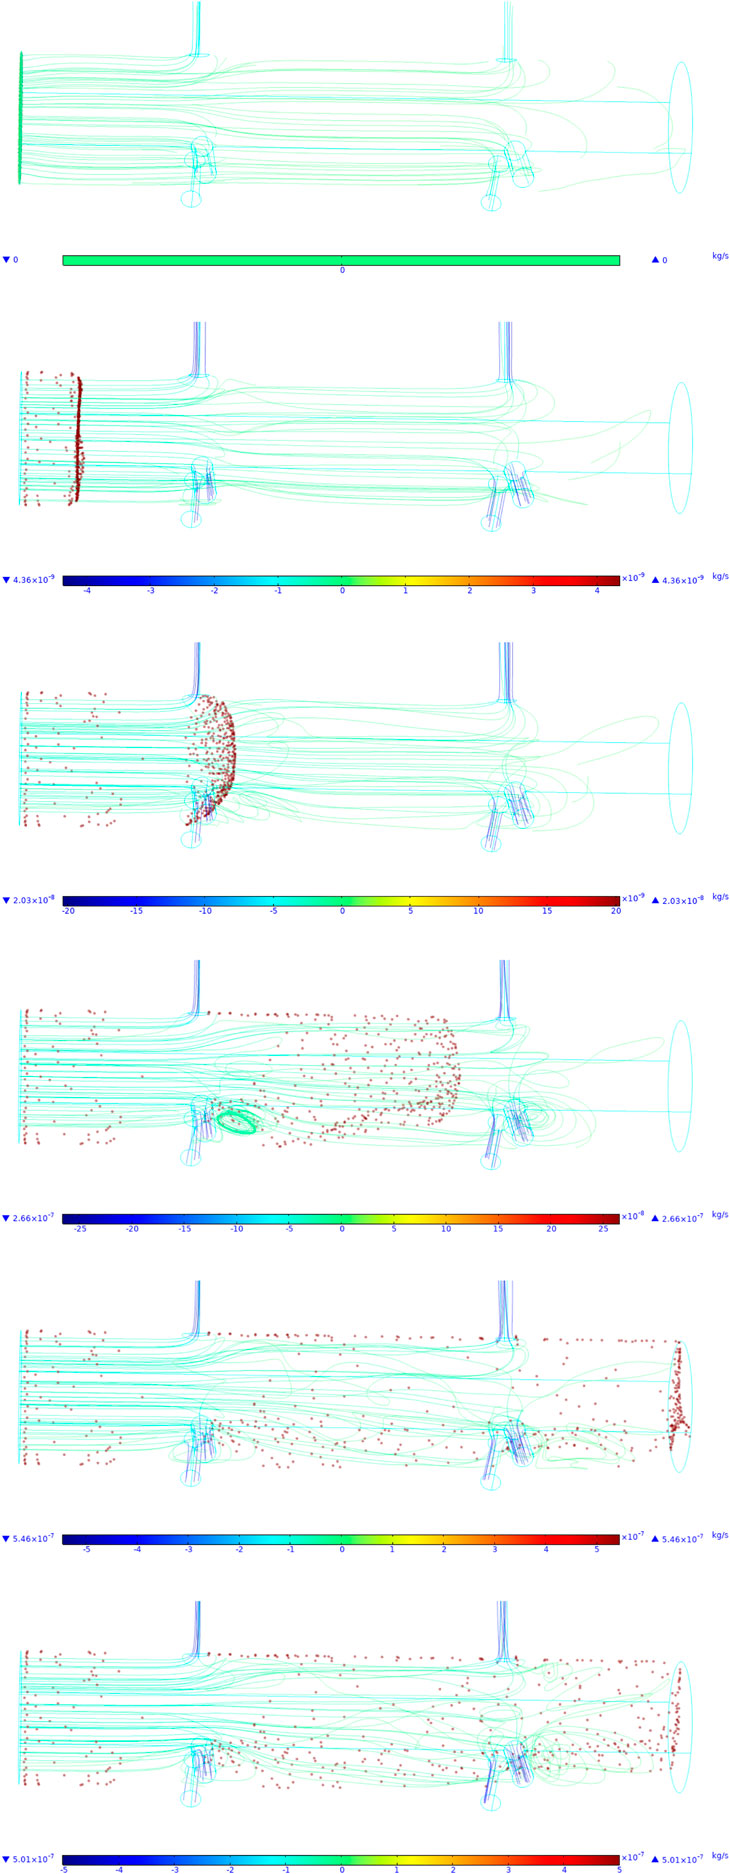
FIGURE 4. The distribution of the erosion particles at different time.
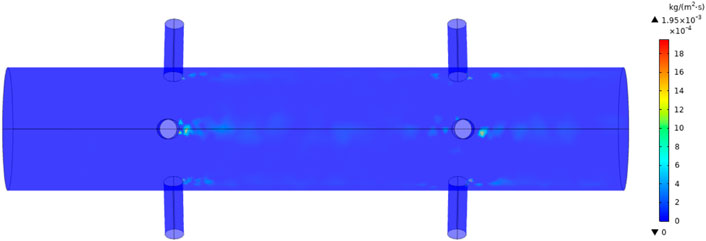
FIGURE 5. The erosion velocity of the nozzle.
Figure 5 shows the erosion rate distribution of solid particles in the fluid on the inner surface of the nozzle. It can be seen from the figure that at the root of the nozzle, the erosion rate is the highest, reaching 1.95 × 10⁻³ kg/(m2 s); it is obvious from the diagram that the main erosion position is around the six nozzles, indicating that the erosion of solid particles on the nozzle is mainly concentrated here; it can be seen from the figure that the erosion performance of the nozzle near the inlet is higher than that of the nozzle far away, indicating that the installation position of the nozzle also affects the erosion performance of the nozzle. Figure 6 is the distribution of erosion fluid particles. It can be seen from the figure that the solid particles are more concentrated at the bottom, resulting in the accumulation of solid erosion particles at the bottom. However, it can be seen from the figure that this has little effect on the wall erosion. This is because when the high-pressure fluid enters the tool body, the flow rate is high, so that the solid erosion particles carried by the high-pressure fluid are rapidly accumulated at the bottom. With the increase of erosion time, the more erosion particles are accumulated, so that the bottom of the tool is covered, and the erosion effect of the bottom is not obvious. From the overall point of view, the solid particles at the nozzle on the tool are more than the bottom, and the degree of wear on the wall is higher.
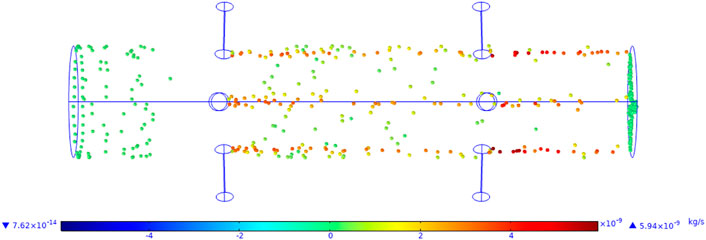
FIGURE 6. The schematic of erosion velocity of the nozzle.
Figure 7 shows the distribution of the fluid velocity of the nozzle under the erosion condition. It can be seen from the figure that the fluid velocity inside the whole tool shows that the flow velocity at the nozzle is much higher than that at other parts of the tool. It can be seen from the figure that the flow velocity at the nozzle is about 200 m/s. In terms of the whole tool, the flow velocity at the upper part of the tool is higher than that at the lower part, and the vortex is obviously generated at the lower nozzle position.
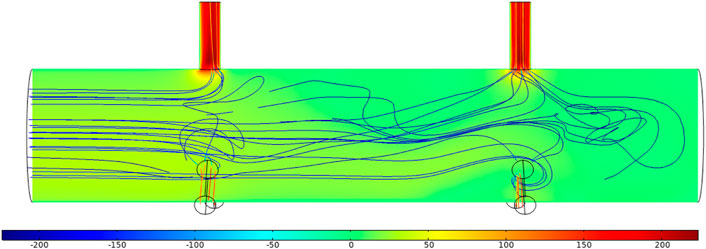
FIGURE 7. The flow velocity distribution of the tool.
Influence of Inlet Pressure
Figure 8 shows the pressure distribution of the tool body and the nozzle. It can be clearly seen from the figure that an annular pressure band is formed at the root of the nozzle, which is about 35 MPa. The pressure difference is formed at the root of the nozzle and the outlet of the nozzle, and the pressure at the outlet of the nozzle is about 7 MPa, which makes the pressure difference at the root of the nozzle and the outlet of the nozzle about 25 MPa, leading to the excessive velocity of the fluid here, which is also the reason for the large erosion rate here. Therefore, in the influence of the inlet pressure on the erosion rate, the inlet pressure is set to change from 35 to 50, and other working parameters are set as follows: the outlet pressure is 10 MPa; the inlet diameter is 60 mm; the outlet diameter is 9.5 mm.
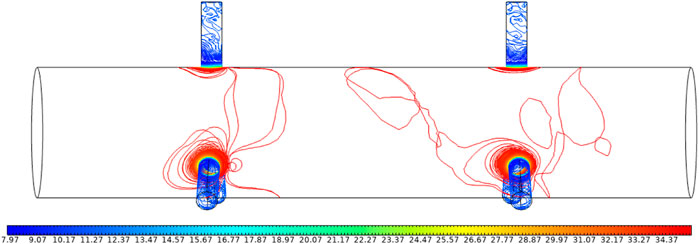
FIGURE 8. The flow pressure distribution of the tool.
Table 1 shows the impact of erosion rate under different inlet pressures. It can be seen from the table that with the increase of inlet pressure, the erosion rate also increases, and the outlet velocity also increases, indicating that the greater the inlet pressure is, the greater the fluid flow rate is, and the velocity of solid particles carried in the fluid is also increased, resulting in an increase in the erosion of the nozzle. It can also be seen from Figure 9 that with the increase of inlet pressure, the erosion rate also increases nonlinearly.
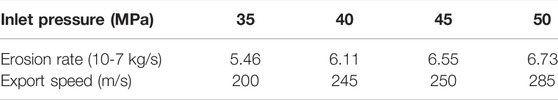
TABLE 1. The erosion velocity with different inlet pressure.
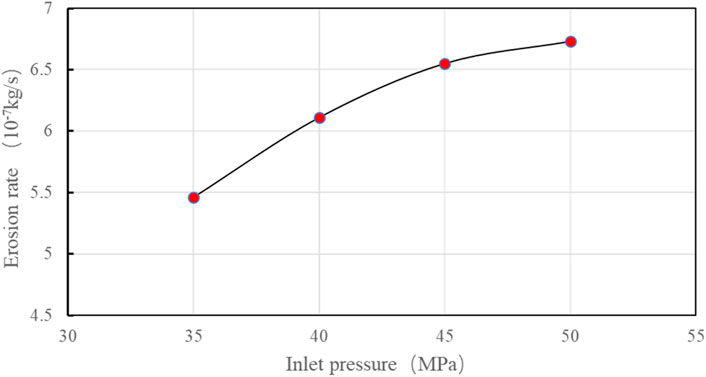
FIGURE 9. The relation between erosion velocity and inlet pressure.
Figure 10 shows the erosion of particles on the nozzle under the condition of inlet pressure changing from 40 to 50 MPa. It can be obviously seen from the figure that with the increase of inlet pressure, the erosion particles deposited at the bottom of the tool are significantly reduced. This is because with the increase of inlet pressure, the flow velocity inside the tool increases, so that the erosion particles deposited at the bottom of the tool are blown up, resulting in the decrease of solid particles deposited at the bottom. Under the condition of constant volume content of erosion particles, the erosion particles in the flow state increase, resulting in the increase of erosion velocity of the nozzle.
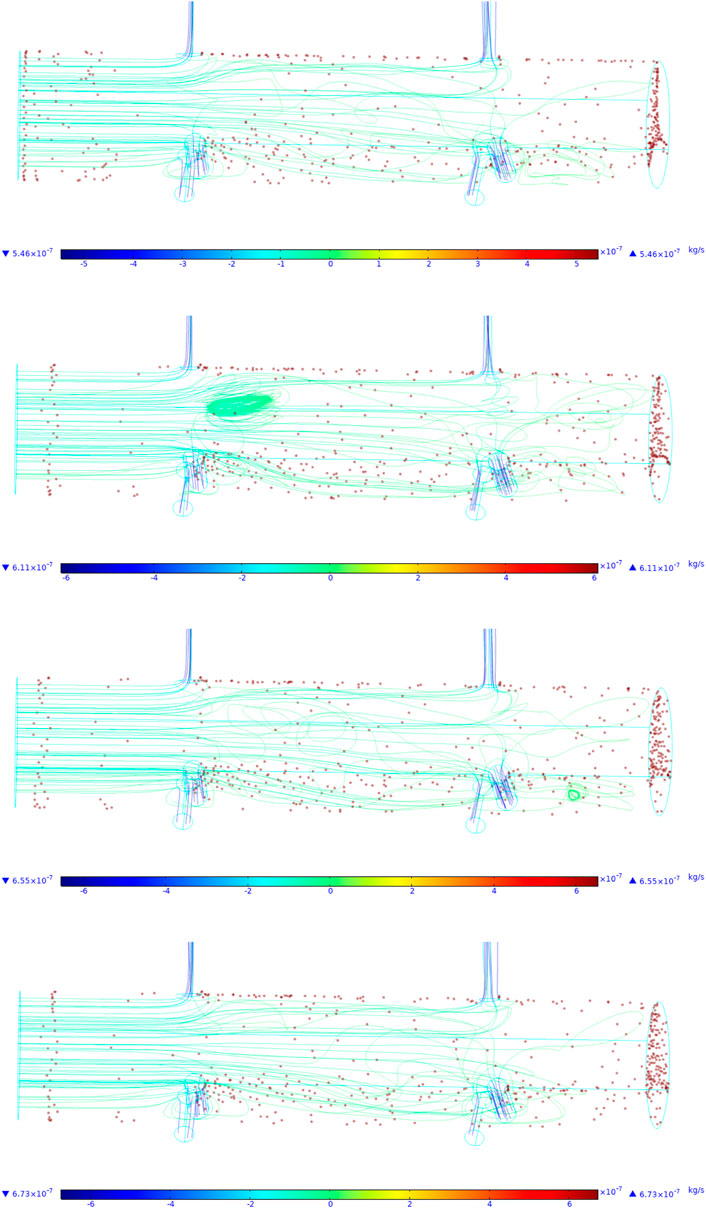
FIGURE 10. The distribution of the particles under different inlet pressure. Influence of erosion time.
In the analysis of the impact of erosion time on erosion rate, the inlet pressure was set to 40 MPa, and the erosion time varied from 0.05 to 0.08 s. Other working parameters were as follows: the outlet pressure was 10 MPa; the inlet diameter is 60 mm; the outlet diameter is 9.5 mm.
Table 2 shows the impact of erosion rate under different erosion time conditions. It can be seen from the table that with the increase of erosion time, the erosion rate also increases, and the export velocity remains unchanged. When the erosion time increases from 0.05 to 0.08 s, the erosion rate increases from 5.46 × 10⁻⁷ to 6.25 × 10⁻⁷ kg/s. At the same time, it can also be seen from Figure 11 that when the erosion time increases, the erosion rate gradually increases, and with the increase of erosion time, the erosion rate gradually no longer changes.
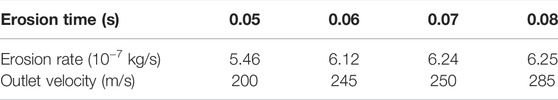
TABLE 2. The influence of erosion duration on the nozzle erosion.
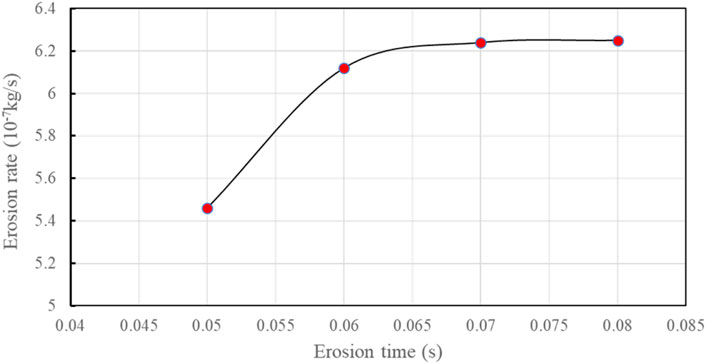
FIGURE 11. The relation between duration and erosion velocity.
Figure 12 shows the erosion effect of nozzle under different erosion time conditions. It can be clearly seen from the figure that with the increase of erosion time, the distribution of erosion particles in the tool is more uniform, and the deposition of erosion particles at the bottom of the tool tends to be stable. The accumulation of solid particles blown by high-speed fluid and erosion particles carried by fluid is in a dynamic equilibrium state, indicating that the increase of erosion time does not increase the erosion rate, but makes the erosion rate tend to a stable value. It can be seen from the figure that at the root of the nozzle, it is the main accumulation position of erosion particles.
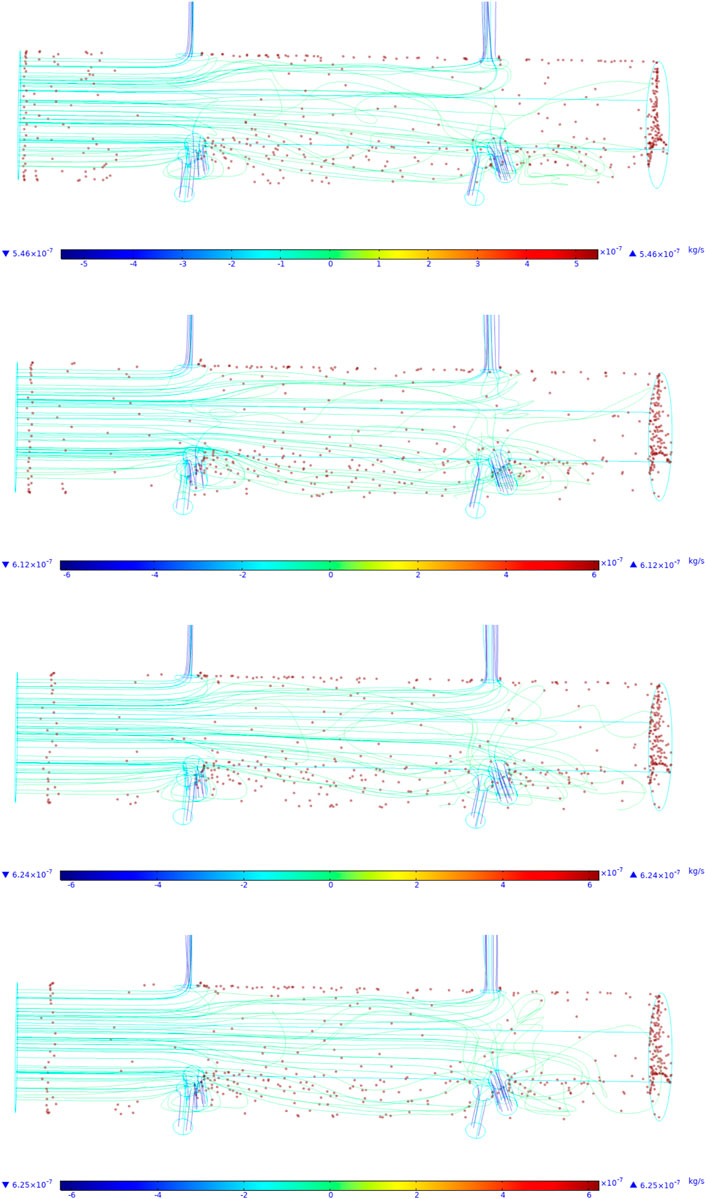
FIGURE 12. The influence of erosion duration on the nozzle erosion.
Influence of Fluid Viscosity
In the analysis of the influence of fluid viscosity on the erosion rate, the inlet pressure was set to 40 MPa, and the dynamic viscosity varied from 1 mPa s to 6 mPa s to 8 mPa s. Other working parameters were as follows: the outlet pressure was 10 MPa; the inlet diameter is 60 mm; the outlet diameter is 9.5 mm.
Table 3 is the impact of erosion rate under different dynamic viscosity conditions. It can be seen from the table that the erosion rate decreases with the increase of fluid viscosity, indicating that the fluid viscosity increases. Under the condition of constant inlet pressure, the fluid velocity decreases, resulting in the decrease of the velocity of the fluid carrying the erosion particles, resulting in the decrease of the erosion velocity and the decrease of the outlet velocity. It shows that under the condition of constant inlet pressure, the greater the fluid viscosity, resulting in the decrease of the flow velocity. It can also be seen from Figure 13 that under the condition of constant inlet pressure, the erosion rate decreases with the increase of fluid viscosity.
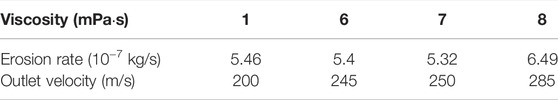
TABLE 3. The influence of viscosity on erosion velocity.
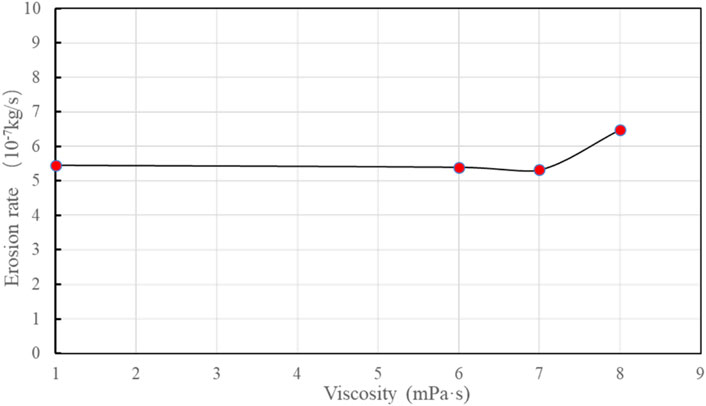
FIGURE 13. The influence of viscosity on erosion velocity.
Figure 14 is the distribution of erosion particles under different viscosity conditions. It is obvious from the figure that when the fluid is clear water, the erosion particles accumulate more seriously at the bottom of the tool, but when the viscosity is 7 mPa s, the erosion particles are evenly distributed at the bottom of the tool, and the distribution is also more uniform at the tool body and the nozzle.
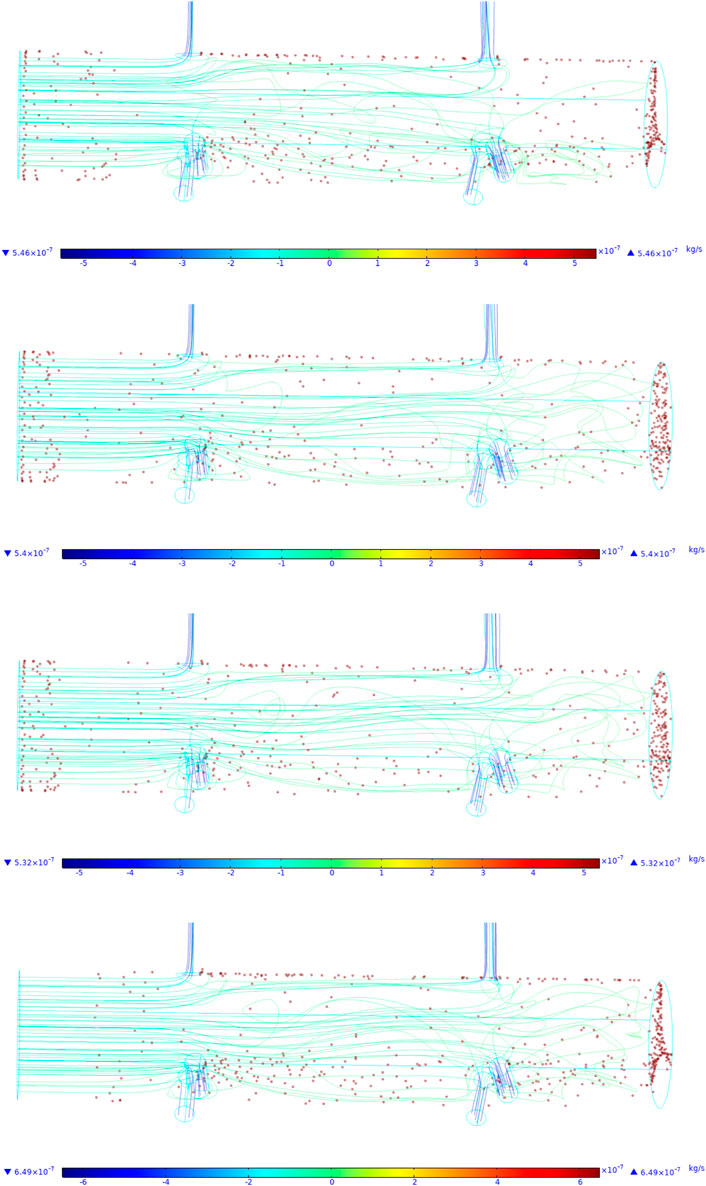
FIGURE 14. The influence curve of different viscosities on the erosion effect.
Effect of Erosion Particle Diameter
In the analysis of the impact of erosion particle diameter on erosion rate, the inlet pressure was set to 40 MPa, and the dynamic viscosity varied from 0.6 to 1.2 mm. Other working parameters were as follows: the outlet pressure was 10 MPa; the inlet diameter is 60 mm; the outlet diameter is 9.5 mm.
Table 4 shows the impact of erosion rate of erosion particles under different diameters. It can be seen from the table that with the increase of erosion particle diameter, the erosion rate also increases, and the outlet velocity remains unchanged, indicating that the size of erosion particles is also the main factor affecting the nozzle erosion effect.
TABLE 4. The influence of diameter on erosion velocity.
Figure 15 erosion of erosion particles on the inner wall of the tool under the condition of different particle sizes. It can be seen from the figure that with the increase of erosion particles, the erosion effect of erosion particles on the tool decreases, which is due to the change of particle mass when the particle size of erosion particles increases. Under the condition of constant inlet velocity, the driving effect of liquid flow on erosion particles becomes worse, resulting in the decrease of particle velocity and the weakening of erosion on the inner wall of the tool. This shows that increasing the diameter of particles will greatly reduce the erosion of fracturing nozzles and effectively prolong the life of the tool. It can also be seen from Figure 16 that the relationship between erosion particle diameter and erosion velocity decreases with the increase of particle diameter.
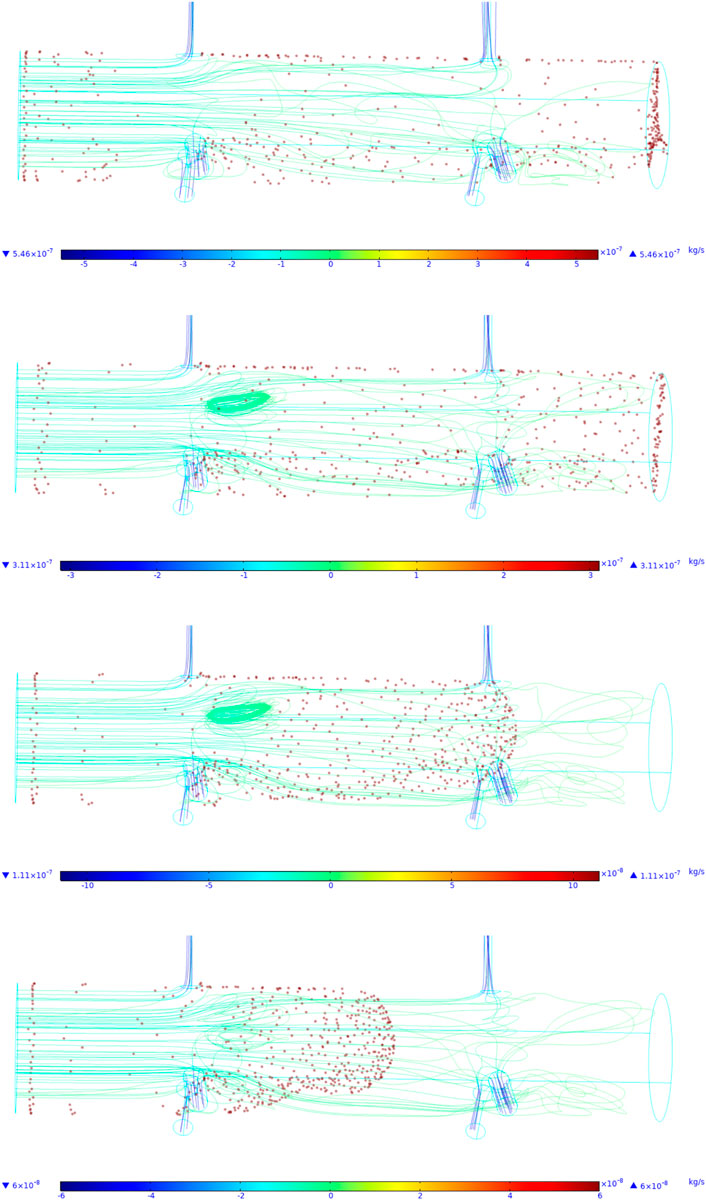
FIGURE 15. The distribution of different diameters particles.
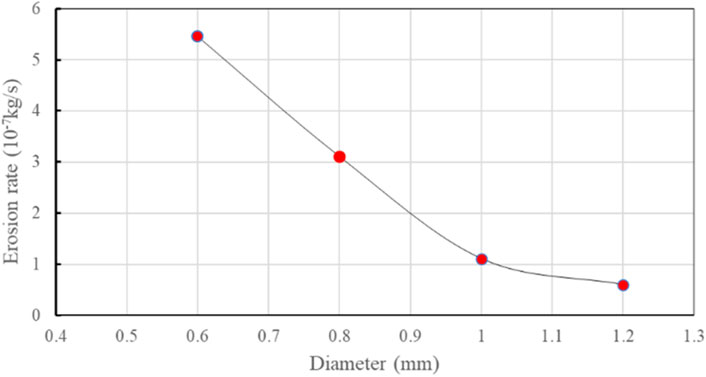
FIGURE 16. The relation of particles diameter on erosion velocity.
Effect of Erosion Particle Mass Flow Rate
In the analysis of the impact of erosion particle diameter on erosion rate, the inlet pressure was set to 40 MPa, and the mass flow rate varied from 1 kg/s to 1.6 kg/s. Other working parameters were as follows: the outlet pressure was 10 MPa; the inlet diameter is 60 mm; the outlet diameter is 9.5 mm.
Table 5 shows the influence of erosion rate of erosion particles under different inlet mass flow rates. It can be seen from the table that with the increase of mass flow rate, the erosion rate also increases, and the outlet velocity remains unchanged, indicating that the mass flow rate of erosion particles is also the main factor affecting the nozzle erosion effect.
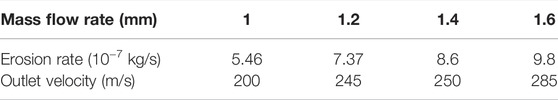
TABLE 5. The erosion velocity under different mass flow.
It can also be seen from Figure 17 that the erosion rate increases linearly with the increase of erosion particle mass flow rate. At the same time, it can be seen from Figure 18 that when the mass flow rate is greater than 1 kg/s, there is a vortex at the upper nozzle, and it can be clearly seen from the figure that the distribution of erosion particles is more uniform and the bibliography of particles increases significantly. This is because when the mass flow rate increases, the erosion particles carried by the fluid increase, which also leads to the increase of erosion rate.
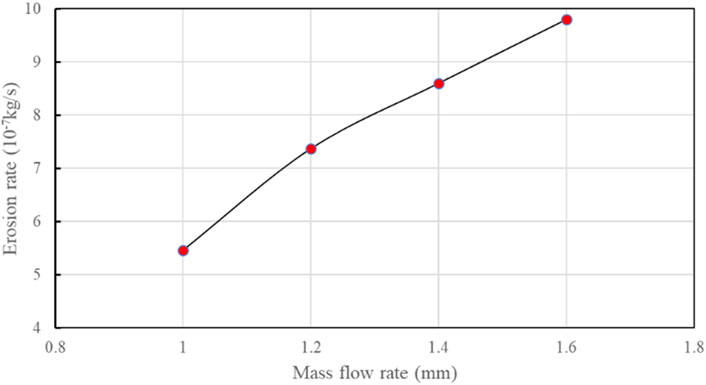
FIGURE 17. The erosion velocity under different mass flow.
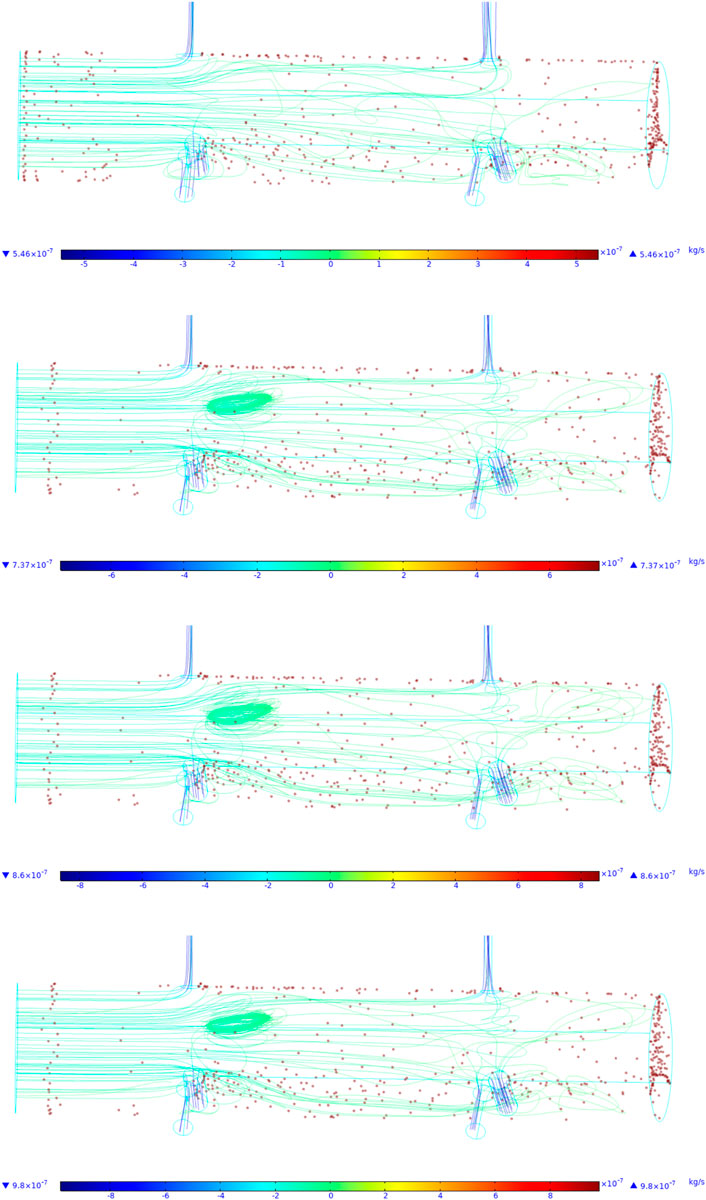
FIGURE 18. Erosion rate curves under different mass flow rate conditions.
In summary, the erosion rate of the device is analyzed from the corresponding working parameters. The results show that the erosion rate increases nonlinearly with the increase of inlet pressure. When the erosion time increases, the erosion rate increases gradually, with the increase of erosion time, the erosion rate gradually no longer changes; under the condition of constant inlet pressure, the erosion rate decreases with the increase of fluid viscosity. With the increase in the diameter of erosion particles, the erosion velocity increases, and the export velocity remains unchanged, indicating the size of erosion particles.
Conclusion
1) By establishing the three-dimensional model of the nozzle and verifying the established model, the error rate between the simulation results and the experimental results is 0.7% under the condition of the same parameters as the test, which indicates that the established physical model is effective and can further carry out the influence of other working parameters on the erosion rate of the nozzle.
2) The analysis of the erosion rate of the device from the aspect of working parameters shows that the erosion rate increases nonlinearly with the increase of inlet pressure; with the increase of erosion time, the erosion rate gradually tends to be stable; with the increase of fluid viscosity, the erosion rate decreases; with the increase of particle diameter and mass flow rate, the erosion velocity increases, which indicates that the particle size and mass flow rate are the main factors affecting the nozzle erosion effect.
3) The results show that the erosion rates of the upper and lower nozzles of the tool are different, and the distribution of sand particles at different positions in the tool is also significantly different. The main erosion position of sand particles on the tool wall is at the root of six nozzles, which is the main accumulation position of erosion particles. The erosion performance of the nozzle near the inlet is higher than that of the nozzle far away, indicating that the installation position of the nozzle also affects the erosion performance of the nozzle, therefore, it is highly suggested that nozzle distribution of the hydraulic fracturing tool need to be installed in upper location of that as much as possible.
Data Availability Statement
The raw data supporting the conclusion of this article will be made available by the authors, without undue reservation.
Author Contributions
YX is the main contributor of the paper, providing the overall ideas, methods and financial support of the paper. QL mainly completed the construction of numerical simulation model and the analysis of experimental data, and made great contributions to the writing of the paper. BL mainly completed the collation and analysis of data and the proofreading of papers. ZG completed the review of the overall idea and scheme of the paper, and analyzed some data.
Funding
The authors would like to acknowledge the academic and technical supports of China University of Petroleum (East China). This paper is supported by the National Natural Science Foundation of China (No. 52074326).
Conflict of Interest
The authors declare that the research was conducted in the absence of any commercial or financial relationships that could be construed as a potential conflict of interest.
Publisher’s Note
All claims expressed in this article are solely those of the authors and do not necessarily represent those of their affiliated organizations, or those of the publisher, the editors and the reviewers. Any product that may be evaluated in this article, or claim that may be made by its manufacturer, is not guaranteed or endorsed by the publisher.
References
1. Changgui J, Kuiwei L, Minhui L. Hydraulic Jet Fracturing Technology [J]. Oil-Gasfield Surf Eng (2011) 30(1):89. doi:10.3969/j.issn.1006-6896.2011.1.043
2. Tengfei W, Yun X, Jianfang J, Zhuhong T, Yunhong D. Coiled Tubing Hydraulic Jet Annular Fracturing Technology [J]. Nat Gas Industry (2010) 30(1):65–7. doi:10.3787/j.issn.1000-0976.2010.01.018
3. Mcdaniel BW, Surjaatmadja JB, East LE. Hydrajet (Abrasive) Perforating Can Improve Success of Fracturing Stimulations. In: proceedings of the International Petroleum Technology Conference; December 3–5, 2008. Kuala Lumpur, Malaysia: IPTC-12043-MS.(2008).
4. Tang J, Lu Y, Ouyang M, Zhang W, Zhang X. Optimal Design and Performance Evaluation of a New Hydrajet-Fracturing Nozzle [J]. J China Univ Pet Edition Natrual Sci (2015) 39(1):72–8. doi:10.3969/j.issn.1673-5005.2015.01.010
5. Fan X, Li G, Huang Z, Niu J, Song X, Sheng M, et al. Field-scale Testing of Hydraulic Isolation in Wellbore during Hydra-Jet Fracturing [J]. J China Univ Pet Edition Natrual Sci (2015) 39(2):69–74. doi:10.3969/j.issn.1673-5005.2015.02.011
6. Surjaatmadja JB, Bezanson J, Lindsay SD, Ventosilla P, Rispler K. New Hydra-Jet Tool Demonstrates Improved Life for Perforating and Fracturing Applications. In: proceedings of the SPE/ICoTA Coiled Tubing and Well Intervention Conference and Exhibition; April 1–2, 2008. The Woodlands, Texas, USA: SPE-113722-MS.(2008). doi:10.2118/113722-ms
7. Ma Y, Ren J, Li Y, Chen T, Li B. Development of Research on Erosion of Materials [J]. J Lanzhou Univ Tech (2005) 31(1):21–5. doi:10.3969/j.issn.1673-5196.2005.01.006
8. Zhongwei H, Gensheng L, Shouqi T, Prophet S, Mao S, Chunfang W. Wear Investigation of Downhole Tools Applied to Hydra-Jet Multistage F Racturing [J]. J Chongqing Univ (2014)(5) 77–82. doi:10.11835/j.issn.1000-582X.2014.05.011
9. Zhi L, Yun X, Zhenduo W, Zuo C, Guangwei Z. Analysis on Nozzle Wear of Hydraulic Sandblast Fracturing Tools [J]. Oil Field Equipment (2010) 39(11):25–8. doi:10.3969/j.issn.1001-3482.2010.11.007
10. Zhiguo W, Xiangtong Y, Yihua D, Shengjun L. Erosion Prediction Model for Super 13Cr Tubing during Large-Scale Hydraulic Fracturing [J]. Oil Drilling Prod Tech (2016) 38(4):473–8. doi:10.13639/j.odpt.2016.04.013
11. Finnie I. Some Observations on the Erosion of Ductile Metals. Wear (1972) 19(1):81–90. doi:10.1016/0043-1648(72)90444-9
12. Finnie I, Stevick GR, Ridgely JR. The Influence of Impingement Angle on the Erosion of Ductile Metals by Angular Abrasive Particles. Wear (1992) 152(1):91–8. doi:10.1016/0043-1648(92)90206-n
13. Surjaatmadja JB, Grundmann SR, Mcdaniel B, Deeg WHJ, Brumley JL, Swor LC, et al. Hydrajet Fracturing: An Effective Method for Placing Many Fractures in Openhole Horizontal Wells. In: proceedings of the SPE International Oil and Gas Conference and Exhibition in China; November 2–6, 1998. Beijing, China: SPE-48856-MS.(2008). doi:10.2118/48856-ms
14. Jixin Z, Jianchun F, Xianjue Z, Yongjin X, Hanchuan W. Research on the Erosion Wear Characteristics of 42CrMo Steel in Hydraulic Fracture Conditions [J]. China Pet Machinery (2012) 40(4):100–3. doi:10.16082/j.cnki.issn.1001-4578.2012.04.006
15. Bitter JGA. A Study of Erosion Phenomena Part I. Wear (1963) 6(1):5–21. doi:10.1016/0043-1648(63)90003-6
16. Zhang Y, Reuterfors EP, Mclaury BS, Rybicki EF. Comparison of Computed and Measured Particle Velocities and Erosion in Water and Air Flows [J]. Wear (2007) 263(1):330–8. doi:10.1016/j.wear.2006.12.048
17. Zhang J, Mclaury BS, Shirazi SA. CFD Simulation and 2-D Modeling of Solid Particle Erosion in Annular Flow. In: proceedings of the 10th North American Conference on Multiphase Technology; June 8–10, 2016. Banff, Canada: BHR-2016-433.(2016).
18. Hutchings IM, Winter RE. Particle Erosion of Ductile Metals: A Mechanism of Material Removal. Wear (1974) 27(1):121–8. doi:10.1016/0043-1648(74)90091-x
19. Papini M, Dhar S. Experimental Verification of a Model of Erosion Due to the Impact of Rigid Single Angular Particles on Fully Plastic Targets. Int J Mech Sci (2006) 48(5):469–82. doi:10.1016/j.ijmecsci.2005.12.010
20. Takaffoli M, Papini M. Material Deformation and Removal Due to Single Particle Impacts on Ductile Materials Using Smoothed Particle Hydrodynamics. Wear (2012) 274-275:50–9. doi:10.1016/j.wear.2011.08.012
21. Azimian M, Schmitt P, Bart HJ. Numerical Investigation of Single and Multi Impacts of Angular Particles on Ductile Surfaces. Wear (2015) 342-343:252–61. doi:10.1016/j.wear.2015.08.022
22. Liu M, Wang J, Yan Y, Xie W, Yang X, Yan X, et al. Numerical Simulation on the State of Fluids along the String of Gas Storage Well[J]. Oil Drilling Prod Tech (2017) 39(04):449–54. doi:10.13639/j.odpt.2017.04.010
23. Li R, Yamaguchi A, Ninokata H. Computational Fluid Dynamics Study of Liquid Droplet Impingement Erosion in the Inner Wall of a Bent Pipe. Jpes (2010) 4:327–36. doi:10.1299/jpes.4.327
24. Suzuki M, Inaba K, Yamamoto M. Numerical Simulation of Sand Erosion in a Square-Section 90-Degree Bend. Jfst (2008) 3:868–80. doi:10.1299/jfst.3.868
Keywords: hydraulic fracturing, nozzle, erosion rate, numerical simulation, finnie principle
Citation: Xu Y, Li Q, Li B and Guan Z (2022) Numerical Simulation Study of Hydraulic Fracturing Nozzle Erosion in Deep Well. Front. Phys. 10:947094. doi: 10.3389/fphy.2022.947094
Received: 18 May 2022; Accepted: 20 June 2022;
Published: 14 July 2022.
Edited by:
Weiqi Fu, China University of Mining and Technology, ChinaReviewed by:
Meng Li, Chongqing University of Science and Technology, ChinaWeiqiang Song, Shandong University of Science and Technology, China
Copyright © 2022 Xu, Li, Li and Guan. This is an open-access article distributed under the terms of the Creative Commons Attribution License (CC BY). The use, distribution or reproduction in other forums is permitted, provided the original author(s) and the copyright owner(s) are credited and that the original publication in this journal is cited, in accordance with accepted academic practice. No use, distribution or reproduction is permitted which does not comply with these terms.
*Correspondence: Yuqiang Xu, eHV5dXFpYW5nQHVwYy5lZHUuY24=