 Kazuki Tamura
 Kazuyo Ito
 Sachiko Yoshida3
 Jonathan Mamou
 Katsutoshi Miura
 Seiji Yamamoto
- 1Hamamatsu University School of Medicine, Hamamatsu, Shizuoka, Japan
- 2Tokyo University of Agriculture and Technology, Koganei, Tokyo, Japan
- 3Toyohashi University of Technology, Toyohashi, Aichi, Japan
- 4Department of Radiology, Weill Cornell Medicine, New York, NY, United States
The elasticity of biological tissues is one of the physical characteristics of tissues and has attracted attention as a clinical diagnostic parameter. The elasticity can be determined on the microscopic scale with speed of sound (SoS) measurements using acoustic microscopy. In SoS measurements, a thin-sliced section is attached to a glass slide in the same manner as a light microscopic specimen. There are two main methods for preparing thin sections: paraffin-embedding and frozen-section. The frozen-section method requires fewer processing steps from sectioning to measurement and is considered to reduce artifacts in the sample compared with the paraffin-embedding method. Both methods need fixatives to keep tissue structures. Many reports of measurements using frozen sections are focused on soft tissues with relatively high protein contents. In this study, we determined the SoS in thin sections of four types of organs (brain, heart, liver, and kidney) prepared using two different methods (paraffin-embedding and frozen-section) and four different chemical fixatives (formalin, Karnovsky fixative (KF) 0.5% and 2.0% glutaraldehyde, and ethanol). The SoS in heart and liver samples prepared using KF showed good agreement with reported values for raw samples. For samples fixed with KF, the SoS increased as the glutaraldehyde concentration increased from 0.5% to 2.0%. A brain tumor sample was processed with KF 0.5%, and the SoS in the tumor was significantly higher than that in the non-tumor area. The results confirmed that it is possible to measure the SoS in brain samples with low protein contents using appropriate fixatives.
1 Introduction
Elasticity is a key parameter in clinical practice because it enables quantitative evaluation of the disease state [1]. Many clinical trials have obtained quantitative values for the elasticity of liver tissues using ultrasonography [2–5] and MRI [6–8]. In particular, ultrasound elastography [9–11] and MR elastography [7, 8] have been used to show that the grade of liver fibrosis correlates positively with the elasticity of the liver tissue. However, the above clinically used techniques provide only averaged values. Therefore, more precise evaluations of the elasticity (i.e., quantification of the elasticity at the cellular level) may provide more clinically significant findings. For example, pathological abnormality is evaluated in detail with dissected tissues through optical microscopy. Generally, it takes several days to process the sample for observation and approximately 30 min for rapid diagnosis of intraoperative samples. Faster sample evaluation is required because surgery is paused during the pathology observation.
A detailed understanding of the mechanical properties of the diseased tissue is essential for quantitative ultrasound (QUS) [12]. QUS methods provide quantitative information on tissue structures that are smaller than the spatial resolution of the imaging system [13, 14]. In particular, cell-nuclei-differentiable resolution can be achieved with high-frequency ultrasound (HFU) (i.e., >15 MHz). Acoustic microscopy employs ultrasound ranging from 60 MHz to 1 GHz in center frequency and allows clarification of the microscale mechanical (acoustical) properties of biological tissues. Evaluation with acoustic microscopy can be rapid because the sample does not require staining, which is a necessary process for optical microscopy observations. Two types of tissue preparation procedures are generally used for acoustic microscopy observations. Most commonly, the sample is chemically fixed after dissection and embedding in paraffin. This is also a standard procedure for preparing light microscopy (LM). Many studies have determined the mechanical properties of various organs, including the liver [15], skin [16], lymph node [17], thyroid [18], eye [19], and heart [20]. The speed of sound (SoS) is higher in fixed and embedded tissues than in unprocessed tissues. Formalin fixed and paraffin-embedding (FFPE) tissues generally lead to biases owing to thermal denaturation of proteins. Aldehyde fixation, including formalin fixation, affects proteins in tissues [21], and the protein content varies among tissues [22]. Therefore, the effects of these artifacts also depend on the tissue, and careful consideration should be given when comparisons are made among tissues or lesions. Cryosectioning of flash-frozen samples is often performed. After sectioning, samples are chemically fixed if necessary. Cryosectioning is advantageous in that the sample is unaffected by high temperature or organic solvents, although it has not become the method-of-choice because of the fragility of most tissues (e.g., prone to tear). Specifically, lipid-rich tissues are unstable. Indeed, the mechanical properties of tissues, such as plaque [23] and the eye [24], are assessed at only a few organizations. Flash-frozen sample preparation eliminates biases produced by heat and chemical treatment, enabling comparisons of paraffin-embedded and frozen sections, which is an important topic in other observational fields, such as immunostaining [25] and protein analysis [26].
Tissue fixation can be broadly classified into cross-linking fixation and precipitation fixation. Cross-linking fixation mainly uses aldehyde-based fixatives. This type of fixative creates covalent bonds between biomolecules, which anchors soluble proteins to biological membranes and increases the mechanical strength. Formaldehyde is most commonly used in LM and mainly acts on the amino group at the end of the side chain of basic amino acids, such as lysine [27, 28]. Glutaraldehyde is also frequently used, and its mechanism of action is similar to that of formaldehyde. Bonding force of divalent glutaraldehyde is stronger than that of monovalent formaldehyde, but penetration of glutaraldehyde into tissues is slower than that of formaldehyde. However, glutaraldehyde can cross-link proteins over greater distances and has a stronger fixation power than formaldehyde [29, 30]. To combine the advantages of these two fixatives, the Karnovsky fixative, a mixture of formaldehyde and glutaraldehyde, is used. Precipitation fixation decreases the solubility of proteins by disrupting hydrophobic interactions, and thus the protein is denatured, precipitated, aggregated, and inactivated. Ethanol, methanol, and acetone are used. Alcohols generally induce greater tissue shrinkage than formalin. Both techniques shrink the specimen by inducing chemical changes, although the rate of shrinkage is greater in precipitation fixation than in cross-linking fixation. Specifically, chemical fixation shortens the intermolecular distance and enhances intermolecular interactions, resulting in changes in the mass volume and mechanical properties of the biological tissue. Acoustic microscopy measures SoS as a elasticity-related parameter. This assessment is expected to be sensitive to the changes in mechanical properties caused by cross-linking and/or shrinkage due to sample dehydration.
In this study, four types of intact soft tissues with different protein contents were processed and evaluated. To our knowledge, processing tissues with high water contents using the frozen-section method has not been studied. Four chemical fixatives (ethanol, 0.5% glutaraldehyde, 2.0% glutaraldehyde, and formaldehyde) were compared. The fixation mechanism is different depending on the fixative: alcohol or aldehyde [21]. Glutaraldehyde is used to prepare samples for electron microscopy, and formaldehyde is commonly used for tissue processing. On the basis of the comparative analysis, brain tumor samples were prepared using the frozen-section method and chemical fixation, and the SoS in these samples was measured.
2 Methods
2.1 Intact rat samples with different chemical fixation and embedding methods
Experiments were performed using adult male Sprague-Dawley rats (9 weeks old, weighing 284 g, Japan SLC, Hamamatsu). The organs were resected following decapitation under deep anesthesia after perfusing with heparinized saline and 30 mM 2-[4-(2-hydroxyethyl)-1-piperazinyl] ethanesulfonic acid (HEPES) buffer. Samples were prepared using either the frozen-section method or paraffin-embedding method.
In the frozen-section method, samples were dissected and cut into 3-mm squares and flash-frozen to prepare frozen blocks with Tissue-Tek O.C.T. Compound (Sakura Finetek Japan Co.,Ltd.). Then, samples were soaked into isopentane surrounded by liquid nitrogen, and samples were stored at −80°C until sectioning. The tissues were serially sectioned at intervals of 12 μm with a cryostat to minimize the variance between sections due to the tissue structure. Thin sections on slide glasses were air-dried and then stored at 4°C in a dry atmosphere. To prevent sample detachment, silane-coated slide glasses were used. One serial section was prepared for one fixative. The sections were soaked in each fixative for 5 min. For chemical fixation, 10% neutral buffered formalin (FF), 0.5% Karnovsky fixative (KF-0.5%), 2% Karnovsky fixative (KF-2.0%), and 99.5% ethanol (Alc) were used for a comparative analysis. The Karnovsky fixatives (0.5% or 2%) [31] consisted of 0.5% or 2% glutaraldehyde, 2% paraformaldehyde, and 30 mM HEPES buffer. The sections were then washed in distilled water for 10 min. Samples were measured to determine the SoS after excess water was wiped off.
In the paraffin-embedding method, samples were dissected and cut into 3 mm squares and then soaked in FF for 24 h. FFPE samples were embedded in paraffin after replacement with an organic solvent. Paraffin blocks were sliced (12 µm thickness) and placed on the slide glass. The samples were deparaffinized in the organic solvent to remove paraffin and soaked in distilled water. Samples were measured to determine the SoS after excess water was wiped off.
In LM observations, samples are approximately 4-μm thick to avoid cell layering. However, in ultrasonic measurements, it is difficult to distinguish the echo signals of the sample surface from those of the glass substrate. The autoregressive (AR) model to analyze the measured waveforms allows some overlap of the two signals. Nevertheless, the thickness must be considered in terms of the ultrasonic wavelength (6 μm, 250 MHz, 1,500 m/s) and impulse tail. One of the issues considered in this study is the stability of chemical fixation. Thus, samples were prepared with a thickness of 12 µm to provide sufficient sample thickness for calculation using the AR method.
All of the following experiments were performed in accordance with the rules for animal experimentation (Approval number: 20200017) and the guidelines for the care and use of laboratory animals of Hamamatsu University School of Medicine.
2.2 Brain tumor sample preparation
Experiments were performed on adult male Sprague-Dawley rats (9 weeks old, weighing 280 g, Japan SLC, Hamamatsu). The tumor implantation method was described previously [32]. Briefly, under 2% isoflurane anesthesia, a hole was placed 1 mm posterior to the bregma and 3 mm to the right of the midline using a stereotactic apparatus (Narishige Scientific Instrument Lab., Tokyo). C6 glioma cells (105 cells) in 10 μL of culture medium were implanted at a depth of 5 mm. Treated rats were returned to their cages after closure of their surgical wounds. The whole brain was resected 18 days after implantation. Brain tissues containing tumors were sectioned to compare tumor and non-tumor regions. For the frozen block, the excised sample containing the brain tumor was sliced into 1-mm-thicknes, and a frozen block of the area containing the brain tumor was prepared. The frozen block was sectioned in the same way as for the intact samples. The sample was fixed with KF-0.5% using the same protocol as for the intact samples before measurement.
All of the experiments were performed in accordance with the rules for animal experimentation (Approval number: 2019028) and the guidelines for the care and use of laboratory animals of Hamamatsu University School of Medicine.
2.3 Measurement of the SoS
The three-dimensional radio frequency (RF) echo signal was acquired using a scanning acoustic microscope (modified AMS-50SI, Honda Electronics, Toyohashi) with a ZnO single-element transducer (Honda Electronics, Toyohashi). Figure 1 illustrates the RF echo signal and corresponding spectrum at a glass plate. The peak power spectrum was at 253.9 MHz, and the −6 dB band was from 179.7 MHz to 300.8 MHz. A broad spectrum (Q# = 0.48) was observed. The acquired RF echo signal was digitized to 8-bits with a sampling frequency of 2 GHz. The scanning area was 600 μm by 600 μm with an interval of 2 μm. After correcting the phase on the X- and Y-axis, an AR model was applied for SoS analysis [33]. The assumption of the AR model is that the echo signal is the summation of more than two elements. Considering that the echo signal returned from the sample was weak (due to the acoustic impedance difference), we assumed the received signal was composed of two signals, from the glass and sample surface, even if the analysis reduced the stability towards the electrical noise. The AR method separated two overlapping pulses and calculated the thickness of the sample using the phase difference (time difference) between the echoes on the sample surface and the glass echoes in the area without the sample. The SoS was calculated using the thickness and the propagation time of the glass echo obtained by the echo passing through the sample. This means that changes in the thickness caused by tissue preparation do not affect the SoS calculation.
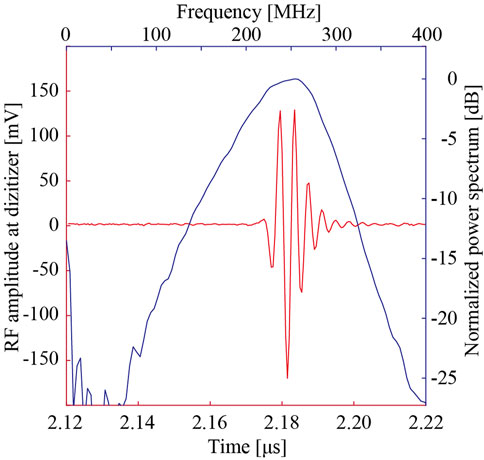
FIGURE 1. Ultrasound transducer properties.
Accuracy-guaranteed pixels were defined to indicate the percentage of pixels that have an SoS value that is plausible derived from the biological tissue. The threshold for defining accuracy-guaranteed pixels was set according to the range of pixels that could be reliably fitted by the AR method in the numerical simulations conducted in advance for the analysis algorithm [33]. Accuracy-guaranteed pixels were determined with the following thresholds: 1,450 m/s < SoS <1800 m/s, 2 µm < thickness <20 μm, 1.48 MRayl < acoustic impedance <2.2 MRayl. The region of interest was set to the location of the biological tissue, and the percentage of accuracy-guaranteed pixels [%] was calculated as the percentage of accuracy-guaranteed pixels in the region of interest. The higher the percentage, the more reliable the SoS estimation for the biological tissue. In contrast, a small percentage indicates a missing sample or a lack of sample surface echoes necessary for the SoS calculation.
2.4 Pathological image quantification for brain tumor sample
After scanning, the sections were stained with hematoxylin and eosin (H&E), and a pathological image was obtained using a virtual slide scanner (NanoZoomer 2.0-HT, Hamamatsu Photonics, Hamamatsu) to observe sample shedding and the distribution of cell nuclei. The image resolution was 220 nm/pixel. Hematoxylin stains the cell nuclei blue, and eosin stains the extracellular matrix and cytoplasm pink [34].
2.5 Statistical test
A two-dimensional (2D) SoS map of 300 × 300 points (i.e., 90,000 points in total) was obtained for each tissue section. The SoS values, along with other parameters, were compared to the threshold value to determine accuracy-guaranteed pixels. The points below the threshold was excluded from further processing. In each 2D map, regions of interests were manually selected to determine the points used for statistical analysis. Consequently, 30,000–60,000 points in the sample area were determined to be accuracy-guaranteed pixels. (Of note, the number of points for the combination of brain and FF was extremely small, approximately 3,000 points.) The mean and standard deviation were calculated for each sample and fixative.
Analysis of variance (ANOVA) was used to identify trends in the mean SoS with respect to the four organs and five fixatives. The p-value for the linear term was used after verifying that higher order terms did not contribute significantly. After finding a group effect for all combinations of pairs or contiguous pairs of a trend test, post hoc analyses were performed and corrected for multiple testing using the Bonferroni–Holm correction. If this correction was employed, the corresponding p-value was denoted “corrected p-value.”
To assess the SoS in the non-tumor and tumor regions, the SoS values were confirmed to be non-normal by a Lilliefors test. Non-parametric tests were chosen to compare pseudo-median values of two independent samples (Mann–Whitney U test). p-values <0.05 were statistically significant. All statistical analyses were performed using MATLAB 2021a (Mathworks, MA).
3 Results
3.1 Evaluation of sample preparation process with intact organs
Figure 2 shows representative 2D SoS maps and corresponding images of H&E stained samples of the brain (top panels) and heart (bottom panels). As shown in Figure 2A, the SoS map of the FF-fixed brain sample contained many void pixels, indicating that the SoS calculation in many pixels was unreliable (Figure 2A). The stained-sample image showed the partially remaining tissues. However, SoS could not be calculated even in areas with remaining tissues. In other conditions, the SoS image had the same shape as that of the stained sample. Heart samples with Alc yielded the highest number of accuracy-guaranteed pixels.
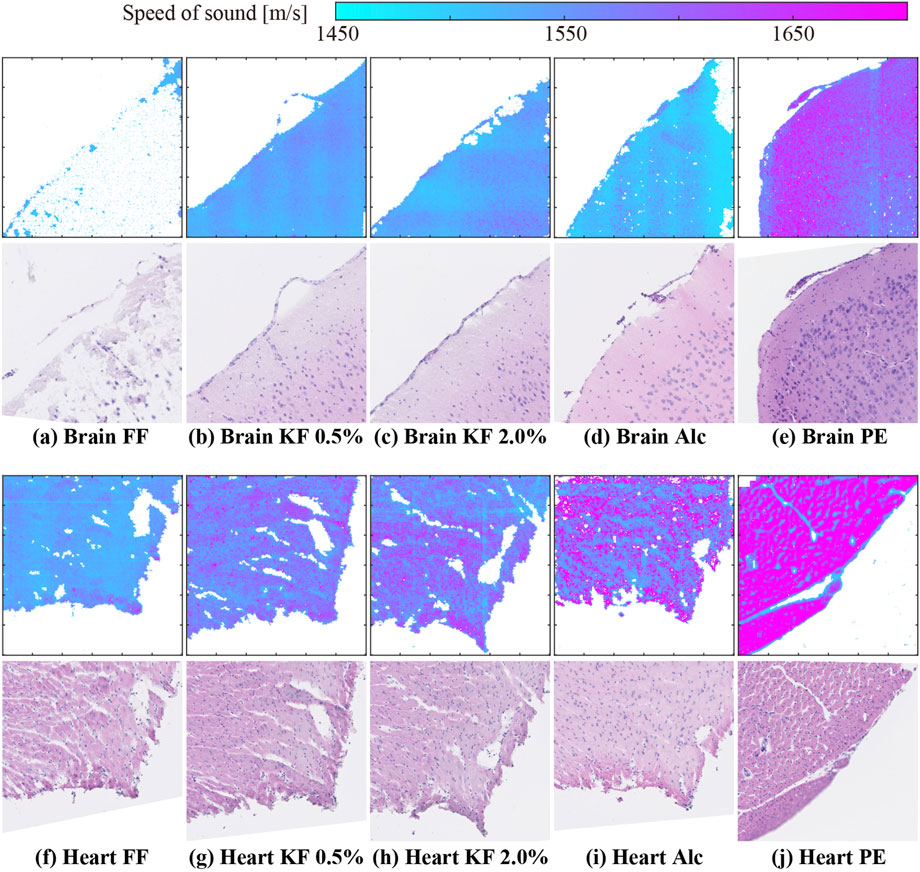
FIGURE 2. SoS maps and H&E stained sample images of (A–E) brain and (F–J) heart samples prepared using (A,F) FF, (B,G) KF-0.5%, (C ,H) KF-2.0%, (D,I) Alc, and (E,J) PE.
Figure 3 shows the percentage of accuracy-guaranteed pixels for four types of organs. The vertical axis indicates the percentage of accuracy-guaranteed pixels. Different markers indicate the different fixation/embedding methods. The number of accuracy-guaranteed pixels is shown in the corresponding plot. Among the organs, the heart, liver, and kidney showed similar percentages regardless of the processing method. In contrast, the percentage of accuracy-guaranteed pixels for the brain samples varied depending on the processing method: FF produced samples with the poorest percentage (9.1%), while the remaining methods produced samples with reliable percentages (95% or higher).

FIGURE 3. Percentage of accuracy-guaranteed pixels. Numbers on the plot are the number of accuracy-guaranteed pixels.
Figure 4 shows the mean and standard deviation of SoS, in the different tissues prepared using different fixatives and processing methods. The vertical and horizontal axis represents the SoS and organs, respectively. Different colors with symbols indicate different fixation/embedding methods. Among all methods, FFPE samples showed the highest values of SoS except for the liver. Alc fixatives exhibited the highest SoS values among fresh-frozen sections except for the brain. FF samples displayed the lowest SoS except for the brain. For samples fixed with aldehyde, the SoS increased as the glutaraldehyde concentration increased. We conducted a two-factor repeated measures ANOVA of the conditions, and the result showed a significant difference in the organ factor (F (3,863150) = 62943, p < 0.05), the fixative factor (F (4,863150) = 380953, p < 0.05), and the interaction effects (F (12,863150) = 38525, p < 0.05). The results of multiple comparisons showed that all pairs except Brain-Alc and Brain-Fol, Kid-GA05 and Brain-GA20, and Heart-GA05 and Liver-GA20 were significantly different. The glutaraldehyde concentration (i.e., KF-0.5% vs. KF-2.0%) correlated with the SoS, specifically SoS in the brain (0.1%), heart (0.2%), liver (2.1%), and kidney (1.6%) significantly increased with increasing glutaraldehyde concentration. SoS in the brain was higher with aldehyde fixation (FF, KF-0.5%, and KF-2.0%) than with alcohol fixation, whereas SoS in the other organs was higher with alcohol fixation than with aldehyde fixation. With formalin fixation (i.e., FF and PE), the frozen-section method resulted in 6.3%–12.4% lower SoS values than the paraffin-embedding method. Reported values [35] obtained using 3.5 MHz ultrasound without sample embedding and chemical fixation are 1,588 m/s and 1,605 m/s in the heart and liver, respectively. Formalin fixation with the flash-frozen method resulted in lower SoS values for the heart and liver (heart: −3.4%, liver: −4.4%). Formalin fixation with the paraffin-embedding method resulted in higher SoS values (heart: 5.4%, liver 4.3%). Among the preparation methods, KF-0.5%, and KF-2.0% (frozen sections) resulted in SoS values similar to those of raw samples.
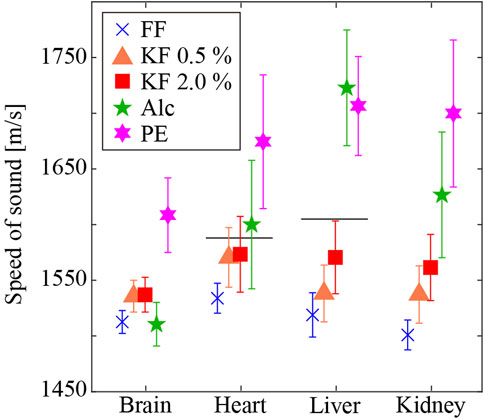
FIGURE 4. SoS in different tissues prepared using different fixatives and embedding methods. Horizontal lines are literature values of raw samples [35]. The SoS in the heart and liver are 1,588 m/s and 1,605 m/s, respectively.
3.2 SoS difference between brain tumor and surrounding region
Figure 5 shows the SoS and corresponding histological images of the brain tumor. Figure 5A shows the SoS map, ranging from 1,450 m/s to 1700 m/s. Figure 5B shows the corresponding LM image of the H&E stained sample. The LM image produced after the measurement showed the same contours as the SoS image. There were very few missing SoS values in areas with tissues. The purple dots in the LM image indicate cell nuclei. The right half of the image, where cell nuclei are abundant, is the area of the brain tumor. The density of cell nuclei was clearly higher in the tumor area than in the non-tumor area. However, the distribution of cell nuclei in the tumor area was inhomogeneous, and the density of cell nuclei tended to be higher in the periphery of the tumor. In the SoS image, the values were higher at the periphery of the sample (the upper edge of the sample shown in the image) for both the tumor and non-tumor areas. Similarly, the SoS values were higher at the periphery of the sample and at the periphery of the tumor. Figure 5C shows the average SoS values, with standard deviation, in the non-tumor and tumor regions. The SoS in the non-tumor and tumor regions was 1,498 ± 14 m/s and 1,516 ± 19 m/s, respectively. The SoS in the tumor region was significantly greater (1.2%) than that in the non-tumor region (p < 0.05).
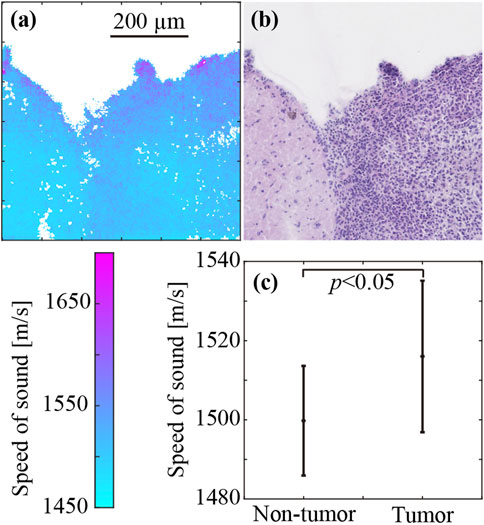
FIGURE 5. SoS in the brain tumor (right half) and non-tumor regions (left half). (A) SoS map. (B) H&E-stained image. (C) SoS values (mean ± SD) in the tumor and non-tumor regions.
4 Discussion
Two distinct embedding methods and four different chemical fixatives were applied to four types of organs. The SoS differed by more than 6% between the paraffin-block method and the frozen-section method with FF. The percentage of accuracy-guaranteed pixels of formalin-fixed brain samples was 9.1%, which was small because parts of the samples were missing and the echo signal from the remaining samples was not sufficiently returned. In addition, the SoS values of the frozen sections differed depending on the fixing solution, even when the sections were adjacent.
4.1 SoS comparison between fixed sample and raw sample
With the frozen-section method, the chemical fixative affected the SoS. The SoS in heart and liver samples fixed with KF-2.0% was the closest to that in the corresponding raw samples [35]. In addition, KF provided enough accuracy-guaranteed pixels over the sample area. This is an important factor in obtaining stable SoS results. Note that the brain tissue was less affected by the glutaraldehyde concentration than the other organ tissues.
The SoS in heart and liver samples processed with the paraffin-embedding method was respectively 5.5% and 5.9% higher than that in the corresponding raw samples [35]. The SoS in thin sections prepared by paraffin-embedding is reported to be higher than that in raw samples [15]. This difference is observed because the tissue is affected by exposure to high temperatures and organic solvents during tissue processing [27]. Moreover, the SoS in cryosections is reported to increase with exposure to organic solvents. Our present result agrees with this observation. Additionally, the SoS was significantly higher in paraffin-embedded samples than in flash-frozen samples even though the same chemical fixative (i.e., FF) was used to prepare these samples, suggesting that the effect of the tissue processing method was larger than the effect of the chemical fixative on the tissues and thus the calculated SoS.
4.2 Relation between organ components and fixative
The different chemical fixatives used to process flash-frozen samples had different effects on each organ. High protein contents are found in blood vessels (24% wet weight), heart (16.5%), eye sclera (26%), and liver (18%) [22]. Some studies have successfully obtained SoS results using cryosections of these organs/tissues [23, 24]. Of the organs investigated in this study, the heart, liver, and kidney are protein-rich organs [22]. In contrast, the brain has a low protein content (10%) [22] but a particularly high water content (77%) [22], and thus it is considered one of the most challenging tissues to measure the SoS.
This is likely due to the difference in the principle of fixation or the number of functional groups of each fixative. The tissue fixation methods used in this study can be categorized into precipitation fixation with alcohols and cross-linking fixation with aldehydes. Fixation with alcohol stabilizes the tissue by dehydrating hydroxy groups in the tissue or in the protein, resulting in protein coagulation. Aldehyde fixation stabilizes the tissue by cross-linking the amino groups in the protein. The results in this study showed that the SoS in ethanol-fixed samples were negatively correlated with the water content and positively correlated with the protein composition ratio. Samples fixed with aldehydes (FF, KF0.5%, KF2.0%) showed less variation in SoS with tissue composition ratio than those fixed with ethanol. The smaller variation in SoS in aldehyde-fixed samples is possibly attributed to the loss of water (i.e., hydroxy groups), which represents the major constituent of the tissue. In contrast to alcohol fixation, cross-linking with aldehydes alters the three-dimensional structure and thus the properties of the tissue, leading to a change in SoS. However, the fixation process does not significantly change the composition ratio. Thus, the variation in SoS is considered to be small.
The variation in SoS in aldehyde-fixed samples is due to a change in the elasticity of the tissue. This is presumably caused by changes in the three-dimensional structure due to the formation of cross-linked structures. SoS in the liver with the highest protein composition ratio (18% [22].) was approximately 2.2% higher than that in the brain with the lowest protein composition ratio (10% [22].) (KF 2.0%). Furthermore, in the case of the brain and liver, GA fixation resulted in a >1.3% higher SoS than formalin fixation. The brain and liver showed similar degrees of glutaraldehyde-induced SoS increase, although few pixels were judged as accuracy-guaranteed pixels in the formalin-fixed brain sample. This suggests that formalin fixation of the brain is not appropriate for acoustic microscopy.
In addition, the brain displayed a smaller difference in SoS with aldehyde and alcohol fixation than other organs. Lipids and glycoproteins constituting the brain contain many complex glycolipids and complex glycoproteins with large molecular weights [36]. This is likely due to their intolerance to organic solvents and water and may cause alcohol-induced denaturation with lesser degree.
To conclude this assessment, for acoustic microscopy measurement using cryosections, KF0.5% is the optimal choice, which ensures the smallest change in SoS relative to that in the raw sample and the highest percentage of accuracy-guaranteed pixels.
4.3 Brain tumor sample with KF 0.5%
SoS in the brain tumor was measured following fixation with the Karnovsky fixative containing 0.5% glutaraldehyde. The SoS image (Figure 5A) and the pathological image (Figure 5B) showed similar shapes, and SoS values were calculated for areas where tissue was present. High values were observed around the marginal region of both brain tumor and intact brain tissue samples (Figure 2D). However, the intact tissue has a pia mater around the periphery of the brain tissue, whereas the brain tumor sample lacks it from the surface of the non-tumor area. Although the pia mater is absent, the surface of the non-tumor area tends to have a high density of cells, which is consistent with a high-SoS region.
The above results indicate that chemical fixation with KF-0.5% of intact samples enable measurements of brain tissue cryosections without perfusion fixation even when the brain tissue has a low protein concentration.
The brain tumor SoS was 1.2% faster than the non-tumor-region SoS. Only a few studies have reported the SoS in a tumor with acoustic microscopy. However, the relation between the non-tumor region and tumor was reported to be dependent on the tumor-type or organ [37, 38]. Additionally, to the best of our knowledge, the acoustic properties of brain tumor cryosections have not been studied.
The SoS in the non-tumor region (1,498 m/s) was 2.4% lower than that in intact brain tissue fixed with KF-0.5% (1,535 m/s). The area around the tumor is edematous and has a higher water content than intact tissue, even if there are no cancer cells infiltrating the area. The fact that the SoS in brain tissue with a high water content is lower than that in other tissues, in this study, also explains why the SoS in the tumor is lower than that in the intact brain tissue.
Gliomas, widely studied as a representative of brain tumors, are different from intact brain tissues in terms of phospholipid composition. Specifically, the amount of phosphatidylcholine reduces as the tissue becomes cancerous, while the amount of sphingomyelin, phosphatidylinositol, and lysophosphoglyceride increases, which is related to perturbations of structural and functional membranes in neoplastic cells [39]. Further investigations of the correlation between the acoustic properties and chemical composition of the brain will enable diagnosis of tumors at an early stage.
4.4 Limitation
The biggest limitation of this study is the difficulty in tissue processing. Cryosectioned specimens are fragile in that they can easily detach from the glass plate during tissue processing from sectioning to pathology staining. The issue underlying this measurement is that the state of the specimen is not apparent until the optical microscopy observation. The silane-coated glass plate used in this study reduces the possibility of such detachment during the tissue processing.
Since ultrasound is irradiated perpendicular to the sample on the glass plate, the SoS calculation is possibly adversely affected by the extraneous material in the propagation path. In this study, all the tissue processing was performed by a technician to minimize the artifact caused by tissue processing.
The SoS calculation process includes a process to compensate for the slight tilt of the glass slide that occurs due to mechanical constraints. Before calculating the SoS, the phase component of the echo signal in the area of the SoS measurement that did not include the histology sample was used to interpolate the position of the glass slide where the sample is located and calculate the SoS. In the measurement of the intact samples, a measurement area that includes a straight line in both the X and Y directions of the measurement field of view that did not include the sample was set, and thus interpolation of the glass slide position can be performed correctly. In contrast, for the brain tumor sample, only one side of the glass slide area was reserved in order to include the tumor and non-tumor areas within the field of view for SoS measurements. This may lead to a decrease in the reliability of calculated SoS values at a distance from the glass slide area. In this study, even if the glass slide could not be corrected sufficiently, we took a countermeasure by arranging the non-tumor and tumor areas to the left and right of the center of the field of view so that the effect on the calculated SoS values of the tumor and non-tumor areas would be the same.
5 Conclusion
This study evaluated the effect of chemical fixatives, namely, formalin, Karnovsky fixative with 0.5% and 2.0% glutaraldehyde, and alcohol, on SoS measurements. Cryosections and paraffin sections of intact rat organs (brain, heart, liver, and kidney) were prepared. Formalin-fixed and paraffin-embedding samples showed the highest values of SoS except for the liver. Frozen sections with alcohol fixatives exhibited the highest SoS values among fresh-frozen sections except for the brain. Frozen sections with FF samples displayed the lowest SoS except for the brain. For samples fixed with KF, the SoS increased as the glutaraldehyde concentration increased from 0.5% to 2.0%. The results indicated that the Karnovsky fixative solution with 0.5% glutaraldehyde was the most suitable fixative for the frozen-section method in terms of SoS validity and stability of calculated results. On the basis of this result, brain tissue including tumor tissue, was chemically fixed with the Karnovsky fixative with 0.5% glutaraldehyde. The SoS in the tumor was significantly higher than that in the surrounding non-tumor area. The knowledge gained in this study regarding the selection of fixative solutions for samples to achieve stable SoS measurement results even for samples with low protein contents or high water contents, such as edema. Establishing a target-independent tissue processing method is expected to be useful in clinical pathology, where various pathological conditions must be treated.
Data availability statement
The raw data supporting the conclusions of this article will be made available by the authors, without undue reservation.
Ethics statement
The animal study was reviewed and approved by Hamamatsu University School of Medicine.
Author contributions
KT and SYo designed the project. KT performed experiments, KT, KI, and JM performed analyzed data. KT, KI, and KM wrote the manuscript. JM and SYa provided resources and equipment. SYa assembled and directed the team.
Funding
This work was supported by the JST ACT-X JPMJAX22KB, JSPS KAKENHI Grant Nos. 19K20666, 20K12621, 21K12643, 21K18076 and 22K12857; The Murata Science Foundation; HUSM Grant-in-Aid; the Research Foundation for Opto-Science and Technology and the Toukai Foundation for Technology.
Acknowledgments
We thank Yayoi Kawabata of the Advanced Research Facilities & Services (ARFS), Hamamatsu University School of Medicine, for technical assistance. We thank Edanz (https://jp.edanz.com/ac) for editing a draft of this manuscript.
Conflict of interest
The authors declare that the research was conducted in the absence of any commercial or financial relationships that could be construed as a potential conflict of interest.
Publisher’s note
All claims expressed in this article are solely those of the authors and do not necessarily represent those of their affiliated organizations, or those of the publisher, the editors and the reviewers. Any product that may be evaluated in this article, or claim that may be made by its manufacturer, is not guaranteed or endorsed by the publisher.
References
1. Ophir J, Céspedes I, Ponnekanti H, Yazdi Y, Elastography LX. Elastography: A quantitative method for imaging the elasticity of biological tissues. Ultrason Imaging (1991) 13:111–34. doi:10.1177/016173469101300201
2. Bavu É, Gennisson JL, Couade M, Bercoff J, Mallet V, Fink M, et al. Noninvasive in vivo liver fibrosis evaluation using supersonic shear imaging: A clinical study on 113 hepatitis C virus patients. Ultrasound Med Biol (2011) 37:1361–73. doi:10.1016/j.ultrasmedbio.2011.05.016
3. Muller M, Gennisson JL, Deffieux T, Tanter M, Fink M. Quantitative viscoelasticity mapping of human liver using supersonic shear imaging: Preliminary in vivo feasability study. Ultrasound Med Biol (2009) 35:219–29. doi:10.1016/j.ultrasmedbio.2008.08.018
4. Palmeri ML, Wang MH, Dahl JJ, Frinkley KD, Nightingale KR. Quantifying hepatic shear modulus in vivo using acoustic radiation force. Ultrasound Med Biol (2008) 34:546–58. doi:10.1016/j.ultrasmedbio.2007.10.009
5. Boursier J, Isselin G, Fouchard-Hubert I, Oberti F, Dib N, Lebigot J, et al. Acoustic radiation force impulse: A new ultrasonographic technology for the widespread noninvasive diagnosis of liver fibrosis. Eur J Gastroenterol Hepatol (2010) 22:1074–84. doi:10.1097/MEG.0b013e328339e0a1
6. Leitão HS, Doblas S, Garteiser P, D’Assignies G, Paradis V, Mouri F, et al. Hepatic fibrosis, inflammation, and steatosis: Influence on the MR viscoelastic and diffusion parameters in patients with chronic liver disease. Radiology (2017) 283:98–107. doi:10.1148/radiol.2016151570
7. Chen J, Talwalkar JA, Yin M, Glaser KJ, Sanderson SO, Ehman RL. Early detection of nonalcoholic steatohepatitis in patients with nonalcoholic fatty liver disease by using MR elastography. Radiology (2011) 259:749–56. doi:10.1148/radiol.11101942
8. Salameh N, Larrat B, Abarca-Quinones J, Pallu S, Dorvillius M, Leclercq I, et al. Early detection of steatohepatitis in fatty rat liver by using MR elastography. Radiology (2009) 253:90–7. doi:10.1148/radiol.2523081817
9. Chen S, Sanchez W, Callstrom MR, Gorman B, Lewis JT, Sanderson SO, et al. Assessment of liver viscoelasticity by using shear waves induced by ultrasound radiation force. Radiology (2013) 266:964–70. doi:10.1148/radiol.12120837
10. Yoneda M, Suzuki K, Kato S, Fujita K, Nozaki Y, Hosono K, et al. Nonalcoholic fatty liver disease: US-based acoustic radiation force impulse elastography. Radiology (2010) 256:640–7. doi:10.1148/radiol.10091662
11. Palmeri ML, Wang MH, Rouze NC, Abdelmalek MF, Guy CD, Moser B, et al. Noninvasive evaluation of hepatic fibrosis using acoustic radiation force-based shear stiffness in patients with nonalcoholic fatty liver disease. J Hepatol (2011) 55:666–72. doi:10.1016/J.JHEP.2010.12.019
12. Tamura K, Mamou J, Yoshida K, Yamaguchi T, Franceschini E. Quantifying scattering from dense media using two-dimensional impedance maps. J Acoust Soc Am (2020) 148:1681–91. doi:10.1121/10.0001972
13. Tamura K, Mamou J, Yoshida K, Hachiya H, Yamaguchi T. Ultrasound-based lipid content quantification using double Nakagami distribution model in rat liver steatosis. Jpn J Appl Phys (2020) 59:SKKE23. doi:10.35848/1347-4065/ab918e
14. Tamura K, Yoshida K, Maruyama H, Hachiya H, Yamaguchi T. Proposal of compound amplitude envelope statistical analysis model considering low scatterer concentration. Jpn J Appl Phys (2018) 57:07LD19. doi:10.7567/JJAP.57.07LD19
15. Irie S, Inoue K, Yoshida K, Mamou J, Kobayashi K, Maruyama H, et al. Speed of sound in diseased liver observed by scanning acoustic microscopy with 80 MHz and 250 MHz. J Acoust Soc Am (2016) 139:512–9. doi:10.1121/1.4940126
16. Miura K, Yamashita K. Evaluation of aging, diabetes mellitus, and skin wounds by scanning acoustic microscopy with protease digestion. Pathobiol Aging Age-related Dis (2018) 8:1516072. doi:10.1080/20010001.2018.1516072
17. Miura K, Nasu H, Yamamoto S. Scanning acoustic microscopy for characterization of neoplastic and inflammatory lesions of lymph nodes. Sci Rep (2013) 3:1255. doi:10.1038/srep01255
18. Miura K, Mineta H. Histological evaluation of thyroid lesions using a scanning acoustic microscope. Pathol Lab Med Int (2014) 6:1–9. doi:10.2147/plmi.s58343
19. Rohrbach D, Jakob A, Lloyd H, Tretbar S, Silverman RH, Mamou J. A novel quantitative 500-MHz acoustic-microscopy system for ophthalmologic tissues. IEEE Trans Biomed Eng (2016) 64:715–24. doi:10.1109/TBME.2016.2573682
20. Hozumi N, Yamashita R, Lee CK, Nagao M, Kobayashi K, Saijo Y, et al. Time-frequency analysis for pulse driven ultrasonic microscopy for biological tissue characterization. Ultrasonics (2004) 42:717–22. doi:10.1016/j.ultras.2003.11.005
21. Eltoum I, Fredenburgh J, Myers RB, Grizzle WE. Introduction to the theory and practice of fixation of tissues. J Histotechnol (2001) 24:173–90. doi:10.1179/his.2001.24.3.173
22. Goss SA, Frizzell LA, Dunn F, Dines K. Dependence of the ultrasonic properties of biological tissue on constituent proteins. J Acoust Soc Am (1980) 67:1041–4. doi:10.1121/1.384071
23. Saijo Y, Filho ES, Sasaki H, Yambe T, Tanaka M, Hozumi N, et al. Ultrasonic tissue characterization of atherosclerosis by a speed-of-sound microscanning system. IEEE Trans Ultrason Ferroelectr Freq Control (2007) 54:1571–7. doi:10.1109/TUFFC.2007.427
24. Hoang QV, Rohrbach D, McFadden SA, Mamou J. Regional changes in the elastic properties of myopic Guinea pig sclera. Exp Eye Res (2019) 186:107739. doi:10.1016/j.exer.2019.107739
25. Shi SR, Liu C, Pootrakul L, Tang L, Young A, Chen R, et al. Evaluation of the value of frozen tissue section used as “gold standard” for immunohistochemistry. Am J Clin Pathol (2008) 129:358–66. doi:10.1309/7CXUYXT23E5AL8KQ
26. Sprung RW, Brock JWC, Tanksley JP, Li M, Washington MK, Slebos RJC, et al. Equivalence of protein inventories obtained from formalin-fixed paraffin-embedded and frozen tissue in multidimensional liquid chromatography-tandem mass spectrometry shotgun proteomic analysis. Mol Cel Proteomics (2009) 8:1988–98. –1998. doi:10.1074/mcp.M800518-MCP200
27. Rait VK, O’Leary TJ, Mason JT. Modeling formalin fixation and antigen retrieval with bovine pancreatic ribonuclease A: I - structural and functional alterations. Lab Investig (2004) 84:292–9. doi:10.1038/labinvest.3700045
28. Hoffman EA, Frey BL, Smith LM, Auble DT. Formaldehyde crosslinking: A tool for the study of chromatin complexes. J Biol Chem (2015) 290:26404–11. doi:10.1074/jbc.R115.651679
29. Migneault I, Dartiguenave C, Bertrand MJ, Waldron KC. Glutaraldehyde: Behavior in aqueous solution, reaction with proteins, and application to enzyme crosslinking. Biotechniques (2004) 37:790–802. doi:10.2144/04375rv01
30. Walt DR, Agayn VI. The chemistry of enzyme and protein immobilization with glutaraldehyde. Trac - Trends Anal Chem (1994) 13:425–30. doi:10.1016/0165-9936(94)85023-2
31. Tamura K, Ito K, Miura K, Yamamoto S. Differences in acoustical property between normal and tumor cells in a rat brain tumor based on cell nuclei density. In: Proceedings of Symposium on Ultrasonic Electronics; Wednesday 25th- Friday 27thNovember 2020 (2020).
32. Koizumi S, Hayasaka T, Inoue N, Setou M, Namba H. Molecular imaging by multiple-stage tandem imaging mass spectrometry in a rat brain C6 glioma model. Prog CI (2010) 32:33–41.
33. Rohrbach D, Mamou J. Autoregressive signal processing applied to high-frequency acoustic microscopy of soft tissues. IEEE Trans Ultrason Ferroelectr Freq Control (2018) 65:2054–72. doi:10.1109/TUFFC.2018.2869876
34. Chan JKC. The wonderful colors of the hematoxylin-eosin stain in diagnostic surgical pathology. Int J Surg Pathol (2014) 22:12–32. doi:10.1177/1066896913517939
35. Hachiya H. Acoustic characteristics of biological tissue and their measurement technique. J Acoust Soc Jpn (2013) 69:232–7. doi:10.20697/jasj.69.5_232
36. Dawson G. Measuring brain lipids. Biochim Biophys Acta - Mol Cel Biol Lipids (2015) 1851:1026–39. doi:10.1016/j.bbalip.2015.02.007
37. Rohrbach D, Saegusa-Beecroft E, Yanagihara E, Machi J, Feleppa EJ, Mamou J. Fine-resolution maps of acoustic properties at 250 MHz of fresh samples and unstained fixed 12-μm thin sections from cancerous human lymph nodes. In: IEEE International Ultrasonics Symposium; September 3-6, 2014; Chicago, IL USA. (2014). 624. doi:10.1109/ULTSYM.2014.0153
38. Miura K. Histological imaging of gastric tumors by scanning acoustic microscope. Br J Appl Sci Technol (2014) 4:1–17. doi:10.9734/bjast/2014/5101
Keywords: speed of sound, chemical fixation, frozen section, brain, glioma
Citation: Tamura K, Ito K, Yoshida S, Mamou J, Miura K and Yamamoto S (2023) Alteration of speed-of-sound by fixatives and tissue processing methods in scanning acoustic microscopy. Front. Phys. 11:1060296. doi: 10.3389/fphy.2023.1060296
Received: 03 October 2022; Accepted: 23 January 2023;
Published: 24 February 2023.
Edited by:
Naotaka Nitta, National Institute of Advanced Industrial Science and Technology (AIST), JapanReviewed by:
Radu Hristu, Polytechnic University of Bucharest, RomaniaUdo Jochen Birk, University of Applied Sciences Graubünden, Switzerland
Copyright © 2023 Tamura, Ito, Yoshida, Mamou, Miura and Yamamoto. This is an open-access article distributed under the terms of the Creative Commons Attribution License (CC BY). The use, distribution or reproduction in other forums is permitted, provided the original author(s) and the copyright owner(s) are credited and that the original publication in this journal is cited, in accordance with accepted academic practice. No use, distribution or reproduction is permitted which does not comply with these terms.
*Correspondence: Kazuki Tamura, ay50YW11cmFAaGFtYS1tZWQuYWMuanA=