- 1Ocean College, Jiangsu University of Science and Technology, Zhenjiang, China
- 2Key Laboratory of Underwater Acoustic Environment, Institute of Acoustics, Chinese Academy of Sciences, Beijing, China
Introduction: The lack of prior knowledge of the marine environment increases the difficulty of passive ranging of underwater sound sources by using a single hydrophone. The dispersion curve of the normal mode contains extensive marine environmental information, which can be extracted without prior knowledge, but the characteristics of dispersion curves of different modes vary, and the mode order cannot be determined from the received data.
Methods: Herein, a method based on a single hydrophone that can jointly identify the mode order and estimate the propagation range in unknown marine environment is proposed. The method uses Bayesian theory as the main methodology and is applicable to broadband pulse sound sources in shallow seas with long-range propagation. The dispersion curves extracted from the data and those calculated by the dispersion formula are the input signal and the replica of the methods, respectively. Accurate identification of the normal mode order and estimation of the propagation range can be achieved by establishing the joint cost function.
Results: In the case of unknown a priori knowledge of the marine environment, the method enables rapid inversion, is tolerant to environmental parameter mismatch, and is low cost and practical.
Discussion: The simulation and measured data analysis results demonstrate the accuracy and validity of the method. The measured data contains linear frequency modulation impulse source signal and explosion sound source signals, and the mean relative error of range estimation is less than 5%.
1 Introduction
Multipath and dispersion are important characteristics of shallow water waveguides, and the study of dispersion characteristics is very important in the field of underwater acoustics. The received signal is a superposition of multiple-order normal modes when a broadband pulsed sound propagates in a shallow sea, and the amplitude and phase of the signal also change, thus increasing the difficulty of signal processing [1].
The passive ranging of underwater sound sources is aimed at estimating the propagation range on the basis of extracted environmental information by processing the received signal when the location of the source is unknown. This research is of great importance in national defense applications and in marine biolocation. However, most existing methods rely on sensor arrays [2, 3], which are not only costly but also yield ranging results with high uncertainty, because the arrays are susceptible to the influence of the water environment. Ranging methods based on a single hydrophone have been proposed to address the shortcomings of array-based ranging methods [4–7]. The feature extraction of underwater acoustic signal mostly depends on ship radiated noise [8–10]. However, the close association of dispersion characteristics and the characteristics of each mode with the marine environment provides possibilities for analyzing the structure and extracting the environmental parameters [7]. The dispersion curves are widely used in the passive ranging of single hydrophones for broadband pulsed sources. After analyzing the received signals, the information on the ocean environment, source location, and Eigen functions contained in the dispersion characteristics are effectively used to achieve the inversion of the ocean environmental parameters in shallow waveguides [11–13]; the estimation of the speed of sound profile (SSP) in water [14]; as well as the passive localization of a variety of broadband impulse sources, such as light bulb sources [15], dolphin calls [16], and explosion sources [17, 18]. However, all of the above methods require some or all of the a priori knowledge of the marine environment to obtain accurate ranging results, which is very difficult for a practical application.
Combining the extracted dispersion curves and Bayesian estimation theory to achieve sound source ranging can reduce the reliance on a priori knowledge of the marine environment [19–21], However, the method based on the dispersion characteristics has two conditions for application: a priori knowledge of the marine environment and the determined order of the normal modes. The characteristics of dispersion curves of different modes vary. Mode order identification is the basis for underwater engineering applications using dispersion curves. Factors such as the SSP (the sound speed profile) in water, the geoacoustic structure, and the location of the source/receiver can affect the propagation of the sound signal and consequently lead to some normal modes being missed in the received signal. Separating the modes from measured data can be accomplished through a warping transform [11], and signal faults can be observed in the spectrogram results of warped signals; however, directly identifying the mode order remains impossible, thus it is important to find a method to effectively identify the normal modes.
Identification of normal mode order can be achieved on the basis of the conventional beamforming of a horizontal line array [22]. The dispersion curves extracted by warping transform are used as the input signal, according to Bayesian theory, while the replica is calculated with the acoustic field model. Subsequently, the joint estimation of mode order and environmental parameters can be performed [23]. However, the calculation of the replica requires multiple environmental parameters regarding the water as well as the bottom. Too many inversion parameters reduce the inversion efficiency, and correlations between parameters increase the error. A inversion scheme that does not require mode identification is thus proposed.
The feature of this study is the identification of normal modes and source ranging effectively without a priori knowledge of the marine environment. Bayesian inversion theory has good tolerance for marine environmental parameters, and all unknown marine environmental parameters can be used as inversion parameters for inversion. The input function and replica are two important components of the Bayesian inversion methodology. This study differs from previous inversion work because the input function is easy to obtain and the replica is efficiently calculated. In the method described herein, the dispersion curves of normal modes with high energy and good energy focus are used as the input signal, and the replica is obtained from the dispersion formula. The computational speed of the replica affects the efficiency of the entire inversion process. For shallow environments in which the speed of sound on the seabed is higher than that in water, the bottom features can be approximated according to the bottom reflection phase shift parameter P for SRBR (surface-reflected-and-bottom- reflected) modes in the case of small angle incidence.
The dispersion formula can be obtained with four parameters. Therefore, for SRBR normal modes, the dispersion curve of the mode calculated by the dispersion formula is valid. Under the condition of unknown a priori knowledge of the ocean, when the replica is obtained with the dispersion formula, the number of inversion parameters is reduced, the errors caused by the coupling of environmental parameters are effectively avoided, and the inversion efficiency is improved.
The method is applied to the data measured from the South China Sea in October 2014 and the Yellow Sea of China in December 2018. The method provides a reliable estimate of the propagation range of the sound source.
2 Materials and methods
2.1 Modal propagation theory
In a shallow water waveguide, consider a broadband pulsed sound source S(f), located at depth zs. The signal is received by a hydrophone located at depth zr after a propagation range r. The received signal can be can be expressed as the sum of multi-order normal modes [24]:
where n is the normal mode order, and
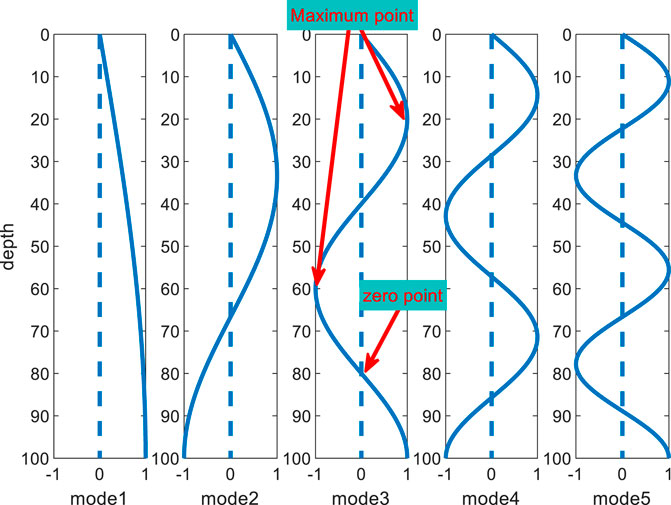
From Eq. 2, when the depth of water is H, the normalized amplitude of the first 5-order normal modes varies with z, as shown in Figure 1.
As shown in Figure 1, the Eigen function of the normal mode has n points with zero energy value in the depth direction, and this point is called a node. The energy of the mode signal of each order in the received data varies with the source/receiver depth configuration. When the source/reception depth is just near the node, the modal excitation is insufficient and subsequently disappears. Marine environmental factors affect the propagation characteristics of normal modes. Therefore, the mode contains a large amount of oceanographic information and is widely applied in underwater engineering. The analysis of normal mode characteristics is important in performing the inversion of geoacoustic parameters and source localization. However, the mode order cannot be determined directly from the received data, and the use of time-frequency analysis (TFA) and warping transform provides convenience in research.
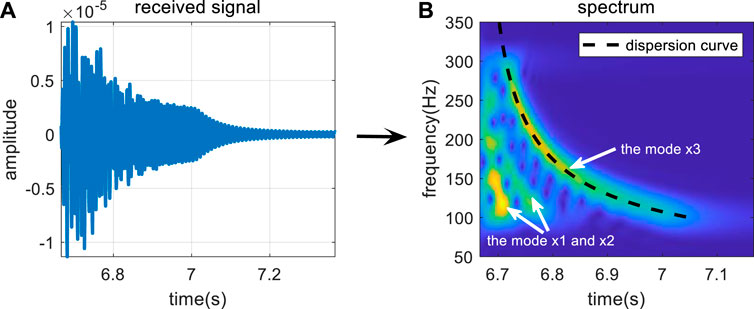
The energy variation in normal modes can be observed through the TFA technique. Figures 2A, B show the received signal in the time domain and time–frequency domain after TFA for a broadband pulsed sound source in the frequency band of 100–300 Hz propagating for 10 km in a Pekeris waveguide. The environmental parameters are as follows: depth H = 100 m, SSP in water c0 = 1500 m/s, depth of the sound source zs = 28 m at the node of mode 4, seabed speed of sound cb = 1800 m/s, and density ρb = 1.6 g/cm3.
Figure 2A shows the total propagation characteristics of multi-order normal modes, which cannot reflect the characteristics of a single mode. However, multiple normal modes with higher energy can be seen in Figure 2B. Because the order of each mode cannot be determined directly, the order is assumed to be x1, x2, x3, ..., and xn. The energy of the normal mode is gathered in a curve associated with time and frequency (e.g., the black dotted line corresponding to the x3 order mode in Figure 2B), which is called the dispersion curve. The dispersion curves not only describe the energy variation characteristics of normal modes but also contain information on the marine environment. The characteristics of dispersion curves of different modes vary, and determining these characteristics is equivalent to obtaining multiple sets of data containing information about the environment in the case of one receiver.
2.2 Dispersion curve
Dispersion characteristics are very important aspects of shallow water waveguides. The dispersion characteristics can be explained by the group velocity and phase velocity, which are associated with the order of the normal mode and vary with frequency. The group velocity and phase velocity can be written as:
The different group velocity of each mode leads to different arrival times; therefore, the dispersion curve is a function of time and frequency. The dispersion curve of mode n can be written as:
The energy of the mode varies with the dispersion curve, according to the mode order n, propagation range, and horizontal wavenumber
2.2.1 The dispersion formula
In Beam-Displacement Ray-Mode (BDRM) theory, when a sound source with a small grazing angle propagates in a waveguide where the speed of sound of the seabed is larger than that in water, the dispersion curve of the SRBR normal mode can also be calculated with the dispersion formula [25]:
where the P is the bottom reflection phase shift parameter, which is a quantity associated with the seabed parameter, expressed as:
where ρ1, ρ2, cb, and α are the water density, seabed density, and seabed absorption, respectively. According to Eq. 6, the P is a frequency-dependent quantity. However, when the attenuation of the seabed is minor, and the frequency exceeds 10 Hz, the effect of frequency on P can be neglected, and Eq. 6 can be simplified to:
The inversion efficiency can be improved by reducing the number of inversion parameters by describing the bottom properties with parameter P. Moreover, the dispersion curve can be calculated more rapidly by using the dispersion formula compared with the sound field model (e.g., KRAKENC) [26].
According to the above, the dispersion curves of each order of simple positive waves can be calculated with Eq.5 and 6, when the parameters of the marine environment are known. KRAKENC is a more mature model for acoustic field calculation; therefore, the dispersion curves obtained by KRAKENC according to Eq. 5 are used as the reference curves.
However, the dispersion curves obtained with the dispersion formula Eq. 5 do not contain frequencies lower than Ariy frequency (Ariy frequency: The frequency corresponding to the minimum value of the group velocity of the normal mode). It is also an important part of our future work to obtain dispersion formulas that can calculate complete dispersion curves.
2.2.2 Extraction of dispersion curves
In practical applications, detailed environmental parameters are difficult to obtain, and the dispersion curves can be extracted through analysis of the received signals. The combination of time-frequency analysis techniques, warping transform, modal filtering, and ridge extraction techniques can achieve accurate extraction of dispersion curves in measured data.
The warping transform can transform the time domain signal
The extracted modes are inverted with the inverse warping operator
The above process can be described by the simulation results in the Pekeris waveguide, with the same simulation environment as in the previous section, taking the example of extracting the dispersion curve of normal mode x3.
In the spectrogram of the received signal shown in Figure 3A, the energy of mode ×3 is strong, thus facilitating its extraction. The received signal contains at least 5th-order normal modes, but the energy of different-order modes varies, and the energy of mode four is weak and appears blurry in Figure 3B. Mode x3 is extracted after modal filtering and unwarping transform, and the spectrogram and extracted dispersion curve of modal x3 are shown in Figures 3C, D, respectively.
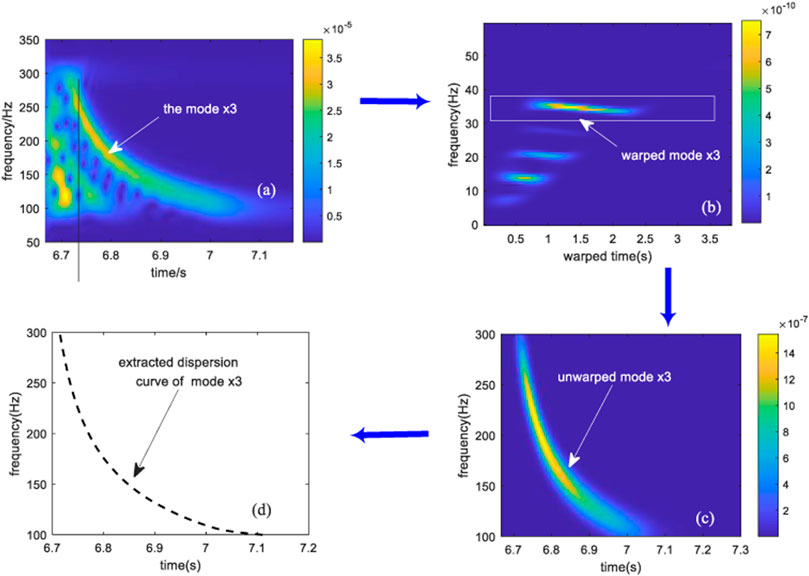
FIGURE 3. Structure of dispersion curve extraction: (A) spectrogram of the received signal; (B) spectrogram of the warped signal; (C) spectrogram of mode x3; (D) dispersion curve of mode x3.
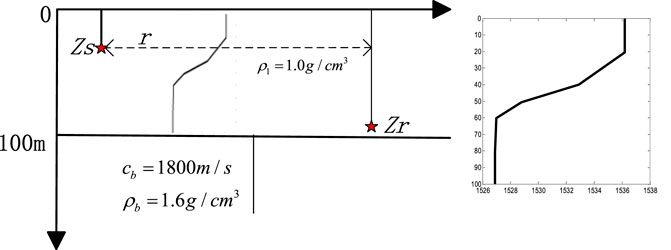
The dispersion formula Eq. 5, data-extraction and theoretical calculation based on an acoustic model are three methods for calculating the dispersion curve. The accuracy of the calculated results is verified by comparing with the results from KRAKEN, used as reference value. The simulation analysis is performed in the Pekeris waveguide and the waveguide with a thermocline, respectively, whose simulation parameters are shown in Figure 4. The propagation range of source is r = 5 km, and the broadband of source is 100–200 Hz, the sampling rate is fs = 1 kHz, the spectrum of the received signal is obtained by the short-time Fourier transform (STFT). The spectrum information is illustrated in Figure 3, where the information of RGB is given. The locations of the source and receiver, and the seabed environment are the same as in the Pekeris waveguide, but the speed of sound in water has a thermocline at 20–40 m. The difference between the speed of sound at the surface and the seabed is 9 m/s, and the source is located in the thermocline. Figure 5A and Figure 5B show the TFA results of the received signal in the two waveguides and the dispersion curves calculated with the three methods, respectively.
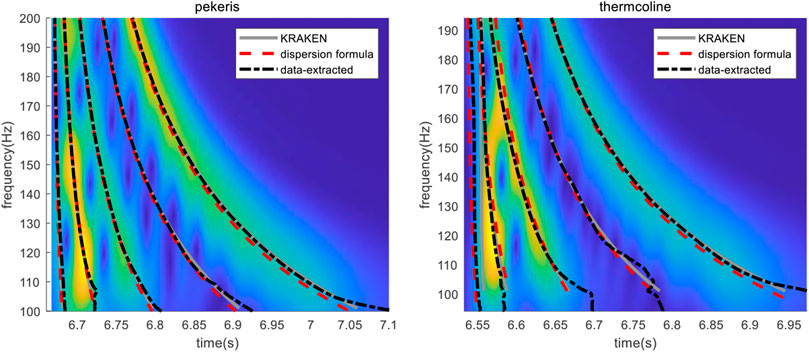
FIGURE 5. Dispersion curves calculated with different methods (A) in the Pekeris waveguide and (B) a thermocline waveguide.
Figure 5 shows that the dispersion curves obtained through the three methods match well in the Pekeris waveguide, and are consistent with the mode energy change trend. In a thermocline waveguide, the dispersion curves extracted from data and calculated with Eq. 5 are consistent, but the low order normal modes do not fully conform to the characteristics of SRBR normal modes, and the consistency is poor. The results of the extracted dispersion curves, particularly the high energy modes, represent the energy variation trend of each mode and can be used in underwater applications.
In addition, Figure 5A shows that the mode order corresponding to the higher energy modes (modes x1, x2, and x3) in the received signal are 2, 3, and 5. The properties of the dispersion curves correspond to the mode order, and the accurate identification of the extracted modes is key to the passive ranging of sources by using the dispersion curves in the case of unknown marine environmental parameters. However, the identification of the modes in the case of unknown a priori knowledge presents the following difficulties.
1) Because of the weak intensity of the first-order mode, the first mode that can be detected in the TFA results of the received signal is not necessarily the true first-order normal mode.
2) The depth configuration of the source/receiver results in weak energy of several modes in the signal, but the number of missing modes cannot be determined, and thus the remaining mode orders cannot be determined.
3) When the frequency is high, the group velocity of two modes tends to be close to the speed of sound in water, the arrival times of the two modes are close, and the two modes are easily mixed into the same mode, thus making the identification of the mode order difficult.
2.3 The joint estimation algorithm
Under the condition of unknown prior knowledge, Bayesian theory is tolerant to environmental parameter mismatch and has a wide application in the passive location of underwater sound sources. In Bayesian theory, the joint inversion of mode order and source propagation range can improve the inversion efficiency. Therefore, a joint estimation method of normal mode order and range of underwater source is presented.
2.3.1 Bayesian inversion theory
The posterior probability density (PPD) of the parameters to be inverted is used as the estimation result, in an important feature of Bayesian theory. The PPD is associated with the conditional probability density of measured data
where m is a vector of inversion parameters with length M, and d is the parameter vector of measurement data. In general,
The likelihood function
Furthermore, where E(m) is the data matching function, a generalized misfit combining data and prior can be defined as
The φ(m) is also known as the cost function. According to Eq.10 and Eq.11, the
To decrease the difficulty in calculating the integral in the above equation, the principle for parameter estimation is the maximum a posteriori (MAP). The inversion parameter values can initially be determined through the optimization search algorithm. The optimal value of a set of inversion parameters is obtained when the maximum likelihood function is maximal.
The uncertainty of the inversion parameters is characterized by the one-dimensional marginal probability distribution of the parameters
Where mi refers to the ith inversion parameter。
2.3.2 The joint cost function
As described above, the cost function can be derived from a likelihood function, which is key to achieving parameter estimation. The input function and the replica are two important components of the likelihood function. The dispersion curve
where
let
the cost function is:
In the absence of prior knowledge of the environment, the true order of mode n must be determined simultaneously, on the basis of the assumption that the true order is nr Therefore, each set of data also must satisfy:
where
Eq. 18 and Eq. 19 affect each other, and the order determination takes precedence over the parameter inversion in the optimization search process. After the order of normal mode numbers of the nth data set is determined by Eq. 19, the nth data set is then used to perform the parameter search and inversion according to Eq. 18. The optimal solution of the parameters is substituted into Eq. 12 to obtain the PPD of each inversion parameter, and then the effective inversion of the parameters is achieved. The Genetic Algorithm is used as a method of parameter search for optimization.
According to Eq. 5, the calculation of the replica in an unknown ocean environment requires the depth H, average speed of sound c0, bottom reflection phase shift parameter P, and range r. Herein, the above four parameters are estimated jointly with the mode order.
2.3.3 Sensitivity analysis
The sensitivity of the four parameters to be inverted is analyzed in the waveguide with a thermocline. The simulation environment is shown in Figure 4. To fully verify the validity of the method for the mode order identification, the depth of the receiver is at the node of mode 5, which is also near the node of mode 2; i.e., theoretically the received signal has low energy of modes 5 and 2.
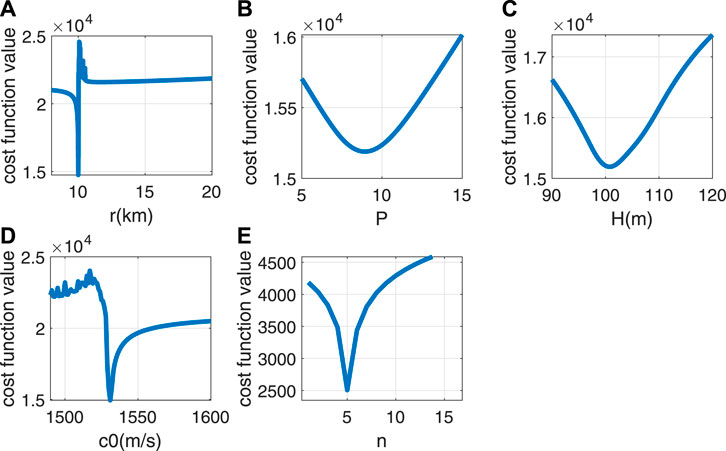
The input function is the dispersion curves extracted from the data, and the rest of the parameters are taken as true values when sensitivity analysis is performed for one parameter. The analysis results are shown in Figures 6A–E.
Figure 6 shows that the four inversion parameters are sensitive to the cost function. Compared with other parameters, the value cost function curve of r varies more sharply around the true value, thus fully demonstrating the sensitivity of the range to the cost function and the accuracy of inversion. The dispersion curve data of mode 5 from the received signal are selected to analyze the sensitivity of the normal mode order n. Figure 6E indicates that the cost function has the smallest value at the true order of the mode, thus indicating the validity of the cost function.
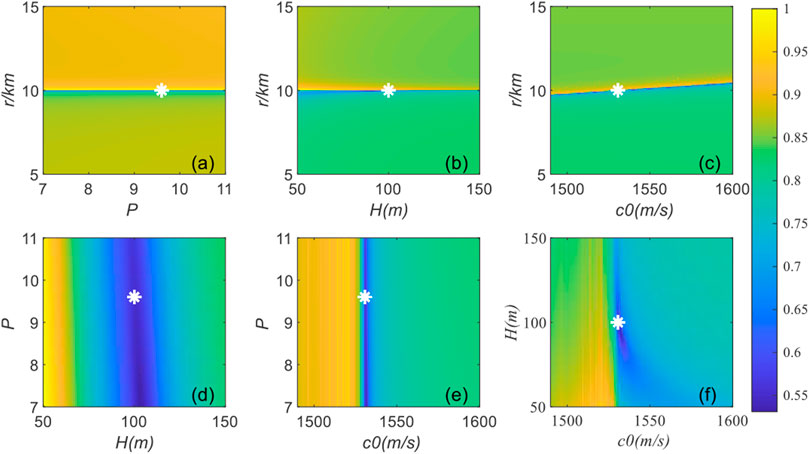
In addition, for a more adequate analysis of the validity of the cost function, two-dimensional correlations of inversion parameters are analyzed. The two parameters to be analyzed vary within the search interval, and the remaining parameters are taken as true values. The true values of the two parameters are marked with a white star. Figure 7 shows that the correlation between the range r and other parameters is low, with a nearly straight line at r0, thus indicating that r plays a major role in the influence of the cost function with high sensitivity. However, the correlation between P and H is high, the correlation between c0 and H gradually decreases with depth, and the speed of sound gradually dominates. Parameter coupling caused by correlation between parameters affects the accuracy of the inversion results. However, as shown in Figure 7, the parameter coupling does not affect the sensitivity of r. Comprehensively, the four inversion parameters and mode order have high sensitivity to the joint cost function.
3 Results
3.1 Theoretical simulation
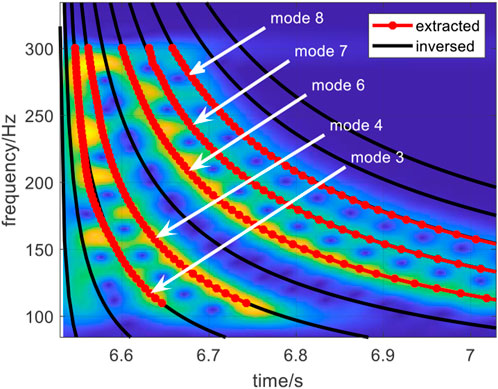
The simulation environment is shown in Figure 4. When r = 10 km, the sound source is set at the node of mode 5, and the search interval of inversion parameters is shown in Table 1. The spectrogram results of the received signal and warped signal are shown in Figure 8A and Figure 8B. Five normal modes have higher energy in the received signal, and their dispersion curves can be chosen as the input signals to the inversion methods, as indicated by the black dashed line in Figure 8B.
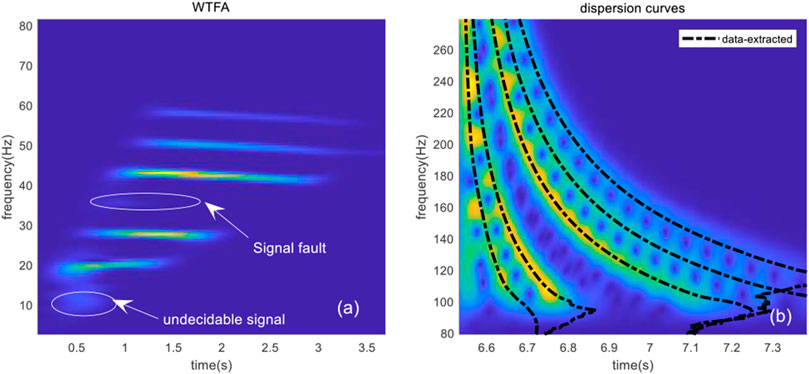
FIGURE 8. Received data: (A) spectrogram of the warped signal; (B) TFA results of the received data and the extracted dispersion curves.
As shown in Figure 8A, the received data contain two missing modes, thus preventing determination of the position of the first mode and the number of modes at the signal fault, and hindering accurate reversal of the parameters and determination of mode orders.
When the dispersion curve is extracted, the normal modes with high energy and good aggregation are the primary choice, and the frequency band of each mode larger than the Ariy frequency is chosen (the dispersion curve will have an inflection point at the Ariy frequency), and the extracted dispersion curves are the input function for parameter search. The convergence speed of all four parameters is very fast, and the time required for a 3,000 times optimization search is less than 3 min. Therefore, an improvement in the efficiency of the inversion method has been achieved.
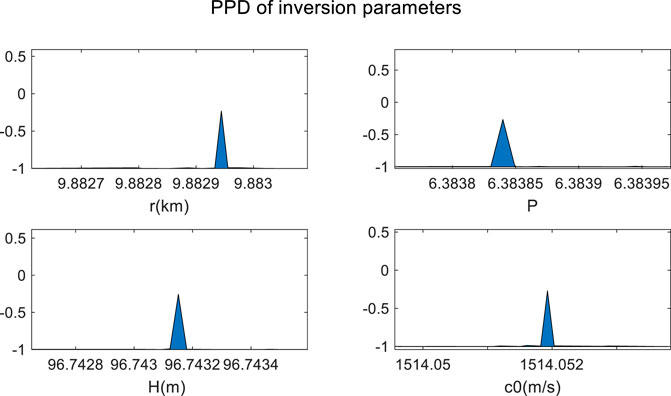
Figure 9 shows the one-dimensional marginal probability densities (1-D MPD) of the parameters, which is calculated from the optimal values of the parameter search Figure 9 shows no clear side flap interference in the 1-D MPD of the four parameters, and the optimal search results are globally optimal. The one-dimensional MPD maximum of the inversion parameters is taken as the inversion result, as shown in Table 1.
As shown in Table 1, the results of the mode determination are accurate, and the numbers of extracted modes are 3, 4, 6, 7, and 8, in agreement with the low energy of modes 2 and 5 when the source is located at the node of mode 5 and near the node of mode 2. At this time, t, a possibility exists that mode 1 is also unexcited, owing to the existence of a thermocline in the water of the simulated environment. The error of r is 0.12%, thus indicating that the estimation result is accurate and reliable. Although the coupling between P and H causes the estimation errors for these two parameters to be much higher than r, the errors for all parameters are within 5%, which fully demonstrates the feasibility of the method proposed herein.
This work mainly considers the estimation of the propagation range, and the estimation errors of other parameters do not affect the estimation results of the range, thus demonstrating that the method has strong environmental adaptability.
Figure 10 provides the results of the mode order identification, and the results of comparing the dispersion curves obtained from the inversion parameters and Eq. 5 with the dispersion curves obtained from data and the spectrogram of the received signal. The findings demonstrate not only that the mode order identification results are accurate but also that the inversed dispersion curves match the results obtained through other methods, thus indicating the accuracy and validity of the joint estimation.
3.2 Experimental data analysis
Two sets of experimental data are selected for analysis to fully illustrate the validity of the method. The first set of experimental data was gathered in the South China Sea in October 2014, and the sound source was a broadband LFM signal; the second set of experimental data was obtained in the Yellow Sea of China in December 2018, and the sound source was an explosion sound signal. The two sets of experimental data represent two cases; that is, there is an energy fault in two modes and the modes are missing, the first few orders of normal modes are missing, and the first-order mode cannot be determined.
3.2.1 Measured data 1
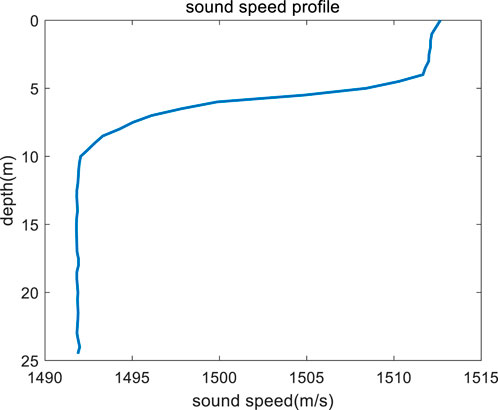
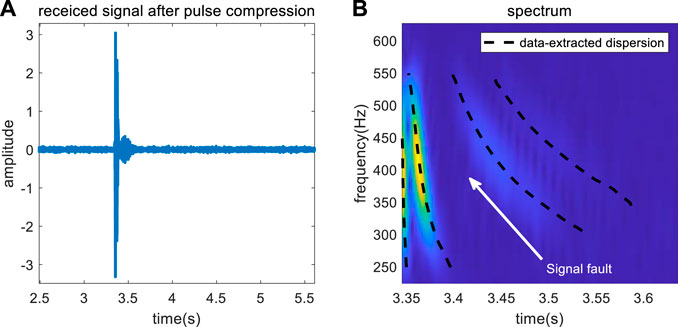
The depth of the experimental sea H = 24.5 m, and the SSP in the water has a thermocline, as shown in Figure 11, the average speed of sound is c0 = 1497 m/s, the broadband source with the broadband 200–500 Hz is located at zs = 10 m, and p = 6.33. The signal is received by a single hydrophone at zr = 9 m, and the receiving depth is near the node of mode 3. r0 = 4.96 km, as measured by GPS. The source is a long pulse, and the received signal is processed by pulse compression for the next step of analysis.
The received signal is shown in Figure 12A, and the signal to noise ratio is high. The dispersion curves are extracted after warping transform. Figure 12B shows the time-frequency analysis result of the received signal. The normal modes with stronger energy are selected for dispersion curve extraction, and the extraction results are shown in Figure 12B. The received signal contains four orders modes with strong energy, and the position of mode 1 is clear, but several modes are missing after mode 2, and the number of the missing modes cannot be known, according to the figure. The part of the dispersion curve with high energy and strong aggregation is used as the input function. To ensure accuracy of the inversion, the frequency range matching the different orders of the simple positive waves is selected, and the final dispersion curve as the input function is shown in Figure12B. The search intervals of the parameters to be inverted and the reference values are shown in Table 2.
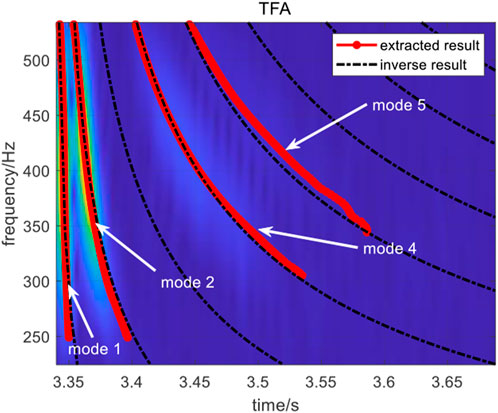
Parameter inversion and modal identification are performed according to the procedure described above, and the inversion results are shown in Table 2. As shown in Table 2 and Figure 13, the results of normal mode number determination are accurate, and the results indicate that the missing mode is mode 3. Because of the location of the receiver, the energy of mode 3 is low and it is unobserved in the time-frequency domain of the received signal.
The errors of c0 and H are less than 5%, on the basis of comparison of the inversion results with the reference values, which are 2.04% and 0.002%, respectively. Although the error of P is larger, the estimated value of the propagation range is r = 5.00 km, which is a very accurate value with respect to the GPS result of r0 = 4.96 km, and the error is only 0.008%. The inversion results fully illustrate that the method has strong stability with respect to marine environmental parameters. The inversed dispersion curves match well with the data extraction results and the spectrogram of the received data, thus demonstrating the superiority of the proposed method in passive ranging and normal mode order determination.
3.2.2 Measured data 2
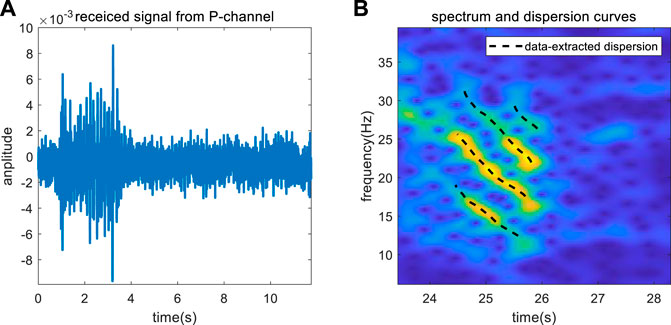
The depth of the experiment sea is H = 30 m, the SSP is isovelocity with the speed c0 = 1460 m/s, and p = 5.43. An explosion sound signal was received by the ocean bottom seismometer located at the seabed after propagating 35.12 km, and four channels (P, X, Y, and Z) of data were obtained. The P-channel data were selected for inversion, and the received signal is shown in Figure 14A, which indicated that the signal to noise ratio of the measured data is lower than that in data 1.
Figure 14B shows the TFA result of the received signal, indicating four normal modes with strong energy. However, the first mode in the Figure is not the true mode 1 in the received signal; that is, the first few orders of the normal mode in the signal are missing. We therefore must determine the number of normal mode to achieve the inversion of parameters. The dispersion curves in Figure 14B are the parts after band selection and serve as the input signal. The search intervals, reference values, and inversion results of the parameters to be inverted are shown in Table 3.
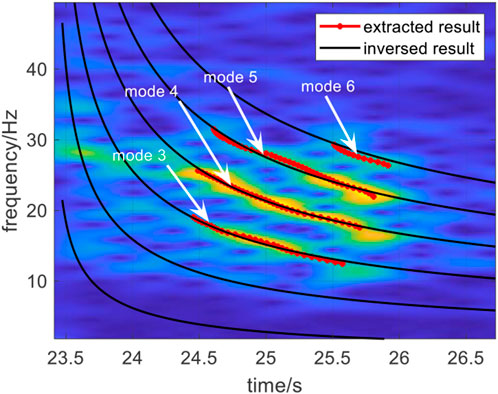
The comparison result of dispersion curves obtained with the different methods is shown in Figure 15, which shows that the inversed dispersion curves are in good agreement with those from the other methods. From Figure 15 and Table 3, the orders of normal modes used for inversion are 3, 4, 5, and 6, and the mode identification results are accurate. Consequently, the first two modes did not appear in the time-frequency domain of the received signal and warped signal.
The error of the distance estimation results with respect to those obtained by GPS is only 0.26%, thus further validating the accuracy of the source ranging. In addition, the estimation errors of other parameters are within 5%.
4 Conclusion
We propose a joint estimation method for the normal mode number and propagation range of an underwater broadband impulse source based on a single hydrophone in an unknown marine environment. This method is based on Bayesian estimation theory and is applicable to a shallow sea waveguide. The characteristics of the dispersion curve of the normal mode correspond to the mode order. The dispersion curves with high energy and good aggregation are extracted by warping transform and used as the input signal for Bayesian methods. In a waveguide in which the seabed speed of sound is larger than that in water, the bottom properties can be approximated on the basis of the bottom reflection phase shift parameter P for SRBR modes in the case of small angle incidence. A dispersion formula based on four parameters is used to calculate the replica and reduce the number of inversion parameters in the unknown ocean environment. The inversion errors caused by the correlation of parameters can be effectively avoided.
The normal mode order and environmental parameters are jointly inversed as unknown parameters, and the joint cost function ensures the consistency of the results for mode order and inversion parameters. In this paper, the propagation ranges of two different shallow sea waveguides in two different types of broadband pulsed sound sources are measured. The mode identification results are accurate when there is modal missing in two modes, or the first few orders of normal modes are missing. In addition, the coupling of environmental parameters does not affect the accuracy of the results of mode order identification and range estimation, accurate identification of the normal mode order is achieved in different waveguides, the inversion error of environmental parameters is within 5%, and the error of propagation range measurement is less than 3%, thus demonstrating the good tolerance of the method to the environmental parameters. The simulation and experimental processing results fully illustrate the effectiveness and feasibility of the method.
Data availability statement
The original contributions presented in the study are included in the article/Supplementary Material, further inquiries can be directed to the corresponding author.
Author contributions
XL completed literature research, conceptualization, methodology, and manuscript writing. YM completed conceptualization, funding acquisition, and project management. HC, HL, and XB jointly completed the validation and visualization.
Funding
This research was funded by the Natural Science Foundation of China, grant number No. 12204199, the Natural Science Foundation of Jiangsu Higher Education Institutions of China, grant number No. 21KJD140001, the Open Foundation from Marine Sciences in the First-Class Subjects of Zhejiang, grant number No. OFMS004, the Rising Star Foundation of the Integrated Research Center for Islands and Reefs Sciences, CAS. Grant number No. ZDRW-XH-2021-2-04, and the Science Foundation of Donghai Laboratory (Grant No: DH-2022KF01018).
Conflict of interest
The authors declare that the research was conducted in the absence of any commercial or financial relationships that could be construed as a potential conflict of interest.
Publisher’s note
All claims expressed in this article are solely those of the authors and do not necessarily represent those of their affiliated organizations, or those of the publisher, the editors and the reviewers. Any product that may be evaluated in this article, or claim that may be made by its manufacturer, is not guaranteed or endorsed by the publisher.
References
1. Jensen FB, Kuperman WA, Porter MB, Schmidt H. Computational Ocean acoustics. New York: Spinger (2011). doi:10.1007/978-1-4419-8678-8_7
2. Donald FG, Peter G. Inversion for geometric and geoacoustic parameters in shallow water: Experimental results. J Acoust Soc Am (1995) 97(6):3589–98. doi:10.1121/1.412442
3. Liang X, Lin B, Liu B, Ma X. Study on dispersion and attenuation of laser-induced surface acoustic wave by grinding surface roughness. Appl Acoust (2022) 1999:109028. doi:10.1016/j.apacoust.2022.109028
4. Shi H, Li J, Chang H, Liu L. Research on passive localization method of shallow water acoustic source with single hydrophone based on hierarchical grid histogram filtering. Appl Acoust (2022) 194(15):108812. doi:10.1016/j.apacoust.2022.108812
5. Rui D, Kunde Y, Ma Y, Yang Q, Li H. Moving source localization with a single hydrophone using multipath time delays in the deep ocean. J Acoust Soc Am (2014) 136:EL159–65. doi:10.1121/1.4890664
6. Zhai D, Zhang B, Li F, Zhang Y, Yang X. Passive source depth estimation in shallow water using two horizontally separated hydrophones. Appl Acoust (2022) 192:108723. doi:10.1016/j.apacoust.2022.108723
7. Bonnel J. Acoustical oceanography with a single hydrophone: Propagation, physics-based processing and applications. J Acoust Soc Am (2019) 146(4):2931. doi:10.1121/1.5137181
8. Li Y, Tang B, Yi Y. A novel complexity-based mode feature representation for feature extraction of ship-radiated noise using VMD and slope entropy. Appl Acoust (2022) 196:108899. doi:10.1016/j.apacoust.2022.108899
9. Li Y, Gao P, Tang B, Yi Y, Zhang J. Double feature extraction method of ship-radiated noise signal based on slope entropy and permutation entropy. Entropy (2022) 24(1):22. doi:10.3390/e24010022
10. Li Y, Geng B, Jiao S. Dispersion entropy-based lempel-ziv complexity: A new metric for signal analysis. Chaos solitons & fractals (2022) 161:112400. doi:10.1016/j.chaos.2022.112400
11. Bonnel J, Chapman NR. Geoacoustic inversion in a dispersive waveguide using warping operators. J Acoust Soc Am (2011) 130(2):101–7. doi:10.1121/1.3611395
12. Guo X, Yang K, Ma Y. A far distance wideband geoacoustic parameter inversion method based on a modal dispersion curve. Acta Physica Sinica (2015) 64(17):174302. doi:10.7498/aps.64.174302
13. Zoi-Heleni M, Nattapol A. Environmental inversion using dispersion tracking in a shallow water environment. J Acoust Soc Am (2018) 143:EL188–93. doi:10.1121/1.5026245
14. Graham AW, Stan ED, Jan D, Hannay DE. Bayesian environmental inversion of airgun modal dispersion using a single hydrophone in the Chukchi Sea. J Acoust Soc Am (2015) 137(6):3009–23. doi:10.1121/1.4921284
15. Bonnel J, Stan ED, Chapman NR. Bayesian geoacoustic inversion of single hydrophone light bulb data using warping dispersion analysis. J Acoust Soc Am (2013) 134(1):120–30. doi:10.1121/1.4809678
16. Bonnel J, AaronThode M, Blackwell SB, Kim K, Macrander AM. Range estimation of bowhead whale (Balaena mysticetus) calls in the Arctic using a single hydrophone. J Acoust Soc Am (2014) 136(1):145–55. doi:10.1121/1.4883358
17. Zhou SH, Qi YB, Ren Y. Frequency invariability of acoustic field and passive source range estimation in shallow water. Sci China- Phys Mech-astron (2014) 57(2):225–32. doi:10.1007/s11433-013-5359-z
18. Bonnel J, Gervaise C, Roux P, Nicolas B, Mars J. Modal depth function estimation using time-frequency analysis. J Acoust Soc Am (2011) 130(61):61–71. doi:10.1121/1.3592230
19. Sheri M, Stan ED, Iohn FC. Bayesian inversion of microtremor array dispersion data in southwestern British Columbia. Geophys J Int (2010) 183(2):923–40. doi:10.1111/j.1365-246X.2010.04761.x
20. Li Q, Yang F, Zhang K, Zheng BX. Moving source parameter estimation in an uncertain environment. Acta Physica Sinica (2016) 65(16):164304. doi:10.7498/aps.65.164304
21. Li X, Piao S, Zhang M, Liu Y. A passive source location method in a shallow water waveguide with a single sensor based on Bayesian Theory. Sensors (2019) 19(6):1452. doi:10.3390/s19061452
22. Meng R, Zhou S, Li F, Qi Y. Identification of interference normal mode pairs of low frequency sound in shallow water. Acta Phys Sin (2019) 68:134304. doi:10.7498/aps.68.20190221
23. Bonnel J, Lin YT, Eleftherakis D, Goff JA, Dosso S, Chapman R, et al. Geoacoustic inversion on the New England Mud Patch using warping and dispersion curves of high-order modes. J Acoust Soc Am (2018) 143:EL405–11. doi:10.1121/1.5039769
24. Jevgenija P, Kirill H, Bruno B, Groby J. An application of normal mode decomposition to measure the acoustical properties of low growing plants in a broad frequency range. Appl Acoust (2016) 117:39–50. doi:10.1016/j.apacoust.2016.09.028
25. Li X, Wang B, Bi X, Wu H. A fast inversion method for ocean parameters based on dispersion curves with a single hydrophone. Acta Oceanologica Sinica (2022) 41:71–85. doi:10.1007/s13131-022-1999-z
26. Porter MB. The KRAKEN normal mode program. NATO (1991). SACLANTCEN. Available at: https://openlibrary.cmre.nato.int/handle/20.500.12489/201?show=full.
27. Bonnel J, Aaron T, Dana W, Ross C. Nonlinear time-warping made simple: A step-by-step tutorial on underwater acoustic modal separation with a single hydrophone. J Acoust Soc Am (2020) 147(3):1897–926. doi:10.1121/10.0000937
Keywords: shallow water waveguide, normal mode order identification, range estimation, Bayesian inversion theory, without prior knowledge
Citation: Li X, Chen H, Lu H, Bi X and Mo Y (2023) A method of underwater sound source range estimation without prior knowledge based on single sensor in shallow water. Front. Phys. 11:1109220. doi: 10.3389/fphy.2023.1109220
Received: 27 November 2022; Accepted: 18 January 2023;
Published: 13 March 2023.
Edited by:
Yuxing Li, Xi’an University of Technology, ChinaReviewed by:
Adriano Todorovic Fabro, Universidade de Brasilia, BrazilXing Chuanxi, Yunnan Minzu University, China
Copyright © 2023 Li, Chen, Lu, Bi and Mo. This is an open-access article distributed under the terms of the Creative Commons Attribution License (CC BY). The use, distribution or reproduction in other forums is permitted, provided the original author(s) and the copyright owner(s) are credited and that the original publication in this journal is cited, in accordance with accepted academic practice. No use, distribution or reproduction is permitted which does not comply with these terms.
*Correspondence: Yaxiao Mo, bW95YXhpYW8xOTg3QDEyNi5jb20=
 Xiaoman Li
 Hongyun Chen1