 Elisa Roldán
 Neil D. Reeves
 Glen Cooper3
 Kirstie Andrews
- 1Department of Engineering, Faculty of Science and Engineering, Manchester Metropolitan University, Manchester, United Kingdom
- 2Research Centre for Musculoskeletal Science and Sports Medicine, Department of Life Sciences, Faculty of Science and Engineering, Manchester Metropolitan University, Manchester, United Kingdom
- 3School of Engineering, University of Manchester, Manchester, United Kingdom
Introduction: Electrospinning is a manufacturing technique that creates a net of nano and microfibres able to mimic the natural extracellular matrix (ECM) of biological tissue. Electrospun scaffolds' morphology and mechanical behaviour can be tailored by modifying the environmental, solution and process parameters. This study aims to produce biomimetic vascular implants optimising the manufacturing set up through two machine learning techniques and statistical approaches.
Methods: Polyvinyl alcohol (PVA) based scaffolds were produced by modifying the concentration of the polymer, flow rate, voltage, type of collector, diameter of the needle, distance between needle and collector and revolutions of the mandrel. The scaffolds were morphologically and mechanically characterised using scanning electron microscopy and mechanical testing respectively to inform the morphological model (simultaneously predicting diameter of the fibres and inter-fibre separation) and mechanical model (predicting strain at rupture and ultimate tensile strength).
Results: Prediction and traditional techniques led to an optimum set up of: 12% PVA, 1 ml/h flow rate, 20 kV, 8 cm between the needle, 18 G gauge needle, rotational mandrel of 15 cm and 2000 rpm. Optimised PVA scaffolds replicated the mechanical properties and morphology of the vascular tissue with an ultimate tensile strength of 6.17 ± 0.18 MPa, a strain at break of 97.39 ± 5.06, fibre diameters of 126 ± 6.11 nm and inter-fibre separation of 1488 ± 91.99 nm.
Discussion: This work revealed for the first time that machine learning Chi-squared Automatic Interaction Detection (CHAID) models are a novel and visual route to elect the optimum manufacturing set up to develop biomimetic vascular implants. Novel two-output Artificial Neural Networks (ANN) and multivariate analysis of variance and covariance (MANOVA, MANCOVA) models presented comparable prediction results (R2=0.91); however, two-output ANN predicted models demonstrated to be the most powerful tool for non-parametric conditions, showing cross-validation mean squared errors (MSE) of 0.0001943. Multi Linear Regression models (MLR) exhibited the lowest accuracy in their predictions (R2=0.6). Machine learning, statistical approaches and traditional characterisation methods were studied to successfully achieve vascular substitutes with analogous biomechanical behaviour and physical structure to the native vascular tissue.
1 Introduction
The circulatory system consists of 19000 km of a complex network of vessels. Thanks to this complex structure, all organs in our body receive the necessary nutrients and oxygen, and the metabolic detritus are eliminated [1]. The index of mortality due to cardiovascular disease (CVD) is increasing year by year, expected to reach more than 23.6 million deaths/year by 2030 [2]. Specifically, coronary artery disease (CAD) causes the highest rate of CVD mortality [3]. Nowadays, the gold standard for CAD treatment is coronary artery bypass graft (CABG) surgery [4]. However, the most used autologous grafts, such as internal mammary arteries or saphenous veins, are not always available and other kinds of approaches, such as tissue-engineered biomimetic grafts, must be investigated [5].
Blood vessels have a nanofibrous extracellular matrix (ECM) mainly formed by collagen and elastin fibres [6]. Electrospinning is a manufacturing technique able to create nano-structured scaffolds comparable to the ECM [7]. This technology allows tailoring of the morphology and mechanical behaviour of the scaffolds by varying the manufacturing parameters [8]. There are three different types of parameters: solution parameters (including viscosity, concentration, molecular weight, surface tension, or conductivity), process parameters (voltage, flow rate, gauge of the needle, type of collector, revolutions of the mandrel, or distance between the needle and the collector), and environmental parameters (such as relative humidity or temperature) [9]. By optimising all these parameters, a stable Taylor cone can be obtained and nanofibrous scaffolds with the desired properties can be produced [10].
The qualitative effects of these parameters on the created scaffolds have been previously documented [11–13]; however, the quantitative values to create the desired scaffold depend on environmental conditions, process inputs, polymer, and solvent used. Therefore, it is crucial to find out the range of the manufacturing parameters that initiates an appropriate Taylor cone and generates scaffolds with no bead formation and correct evaporation of the solvent. Once high-quality fibres are identified with certain parameters, these must be optimised to secure the required mechanical and morphological properties for our purpose, reproduce native vessel walls (with diameter of the fibres in the range of 40–150 nm [14–17]), high inter-fibre separation [18], and ultimate tensile strength and elongation at rupture close to 4.3–6.3 MPa and 59%–120%, respectively [19]). Establishing the ideal combination between solution and process parameters is one of the biggest challenges in electrospinning [20], since if the combination of all the parameters is not optimum, beaded fibres would be created, compromising the quality of the fibres and decreasing the material properties (elongation at break or ultimate tensile strength) of the scaffolds [10, 21].
Traditional techniques used to optimise the electrospinning input parameters are subjective, they do not provide errors or assess the reliability and they are based on trial-and-error technique, which requires the performance of a large number of experiments, increasing the time and cost of the experiments due to human and material resources [22]. These issues can be solved with modelling approaches, such as statistical or machine learning models, able to inference or predict the morphology and mechanical properties of scaffolds given certain manufacturing parameters [23]. However, machine learning and statistical models are designed for different purpose. Machine learning provides the highest accuracy predictions even when data were collected without a good experimental design, there was an imbalance in the data, presented complicated non-linear interactions, or the parametric conditions were not met [23, 24]. Therefore, knowing the morphology and mechanical properties of the natural tissue (in this case study blood vessels), these can be predicted though machine learning models and the optimum manufacturing setup can be determined. The goal of statistical models is to understand the relationships between variables through regression coefficients and assessing the model with confidence intervals and significance tests [25]. However, this approach requires a careful data collection, with well-balanced data and parametric conditions [26]. Although both modelling techniques initially require of an important number of experiments to inform the models, once the models are created it is possible to determine the optimum manufacturing set-up for different applications (e.g., different biological tissues). This research studies the traditional technique and different modelling approaches such as decision trees (never investigated before in electrospinning), novel two-outputs ANN, MANOVA, MANCOVA, and MLR and proves the suitability of all these techniques to optimise the electrospinning process to create biomimetic vascular scaffolds.
Decision tree models are non-parametric supervised learning algorithms that combine classification and regression for data mining. These methods split the multi covariate dataset, based on different conditions, into branches to create an inverted tree with root, internal, and leaf nodes [27]. The first node of the diagram is the root node which is a prediction of the dependant variable considering all the conditions assessed. The most important independent variable to predict the dependant variable will be the first internal node. One independent variable will not be represented in a decision tree when the algorithm interprets that it is not essential to predict the dependant variable. This machine learning tool is commonly used for variable selection, assessing the importance of the variables and simplifying complex relationships, for data manipulation and interpretation, and for handling of missing values and prediction [28]. Depending on the statistical tests used to determine the next best split (selecting the next best input variable) and the type of variables (categorical or continuous), the decision trees can be classified in different types. The most popular are the Classification and Regression Trees (CART) [27], Iterative Dichotomiser 3 (ID3) [29], C4.5 (an extension of the ID3) [30], Chi-squared Automatic Interaction Detection (CHAID) [31], and the Quick Unbiased Efficient Statistical Tree (QUEST) [32]. In this study, CHAID decision trees are used to predict the diameter of the fibres and the inter-fibre separation given the polymer concentration, type of collector, rotational speed of the mandrel, gauge of the needle, distance between the needle and the collector, flow rate, and voltage.
Artificial neural network (ANN) is a non-linear and dynamic modelling tool used in data mining to predict the behaviour of an endogenous variable given a complex dataset of exogenous variables [33]. This technique has being used for electrospinning to predict mostly fibre diameters in the past few years [33–35]. The prediction of mechanical properties of electrospun scaffold has only been reported by Vatankhah et al. [36]. That study predicted the modulus of elasticity given by different ratios of polymers, polymer concentrations, rotation speed, fibre diameter, and alignment index. All these studies provided different models to predict certain properties of electrospun scaffolds without being focussed on any specific application. In the present research, two novel models one to predict the fibre diameters and the inter-fibre separation simultaneously and another to predict the ultimate tensile strength, and strain at rupture were developed with the final mission of creating biomimetic vascular grafts. For the first model (morphological model), the independent variables were: polymer concentration, type of collector, rotational speed of the mandrel, gauge of the needle, distance between the needle and the collector, flow rate, and voltage. For predicting the ultimate tensile strength and the strain at break, the independent variables were rotation speed and gauge of the needle, and diameter of the fibre and inter-fibre separation were considered covariates.
Multiple novel findings were determined as part of this work: a) it is the first study that performs an integral analysis of two morphological properties (diameter of the fibre and inter-fibre separation simultaneously) and two mechanical properties (strain at break and ultimate tensile strength) through ANN; b) seven independent variables were considered to predict the morphology of the scaffolds, and two exogenous variables and two covariates were used to predict their mechanical behaviour; c) novel comparison between ANN and MANOVA/MANCOVA models; d) novel comparison of the importance of the factors based on CHAID, ANN, and MANOVA; e) it is first time that decision trees were used to optimise electrospinning parameters; and f) novel implementation of machine learning techniques to find the optimum setup to produce biomimetic vascular implants.
The aim of the present study is to present and compare different alternatives to optimise the manufacturing parameters used in the electrospinning technique to manufacture biomimetic cardiovascular scaffolds.
2 Materials and methods
2.1 Materials
Solutions of PVA (Sigma-Aldrich, United Kingdom) with concentrations of 10%, 12%, 14%, and 16% were prepared diluting the polymer in distilled water (dH2O) by heating at 100 °C and stirring until homogenous solutions were achieved.
Crosslinked samples were fabricated with 25% glutaraldehyde (GTA) acquired from Sigma-Aldrich (United Kingdom).
2.2 Scaffold production
An electrospinning device (Spraybase®, Ireland) was used to manufacture the electrospun scaffolds.
After a calibration process to identify the operational rage of each parameter, the studied scaffolds were produced by varying the values of concentration of the polymer (10%–16%), flow rate (0.5–5 ml/h), voltage (18–25 kV), diameter of the needle (15–23G), distance between the needle and the collector (5–18 cm), type of collector (flat-rotational 8 and 15 cm), and revolution of the mandrel (500–3,000 rpm). A total of 44 different datasets were used for the traditional characterisation technique and to inform the morphological predicted models.
The experiments were conducted at temperatures between 23 °C and 25 °C following Denis et al. [37].
2.3 Parameter optimisation
To manufacture scaffolds with high-quality nanofibres and achieve similar morphology and mechanical properties to the natural blood vessels, the manufacturing parameters need to be optimised. These parameters (process and solution parameters) were considered optimum for this study when a stable Taylor cone was obtained [10], the fibres of the scaffold produced were free of defects, with comparable diameter of the fibres to the collagen fibrils of the natural tissue (40–150 nm [14–17]), with high inter-fibre separation to favour the cell–cell interactions and cell density [18] and when the scaffold exhibited the closest ultimate tensile strength and elongation at break to the vascular tissue (4.3–6.3 MPa and 59%–120% [19]).
The optimum manufacturing conditions were obtained by altering systematically the variables described in Section 2.2 and characterising the produced scaffolds. Parameters such as concentration or distance between needle and collector affect significantly to the diameter of the fibres [38]. Moreover, the revolutions of the mandrel highly influence on the mechanical properties of the scaffolds [39]. Therefore, after a morphological optimisation, the concentration of the polymer, flow rate, voltage, type of collector, and distance between the collector and the needle were determined, and the mechanical optimisation found the revolution of the mandrel and the size of the needle that produce the closest ultimate tensile strength and strain at break to the cardiovascular tissue.
When the optimum input set was determined through traditional characterisation, statistical and machine learning techniques, the scaffold produced with those parameters was crosslinked and the ultimate longitudinal and transverse tensile strength and the longitudinal and transversal strain at rupture were analysed.
The production and solvent parameters of each experiment performed are detailed in Table 1.
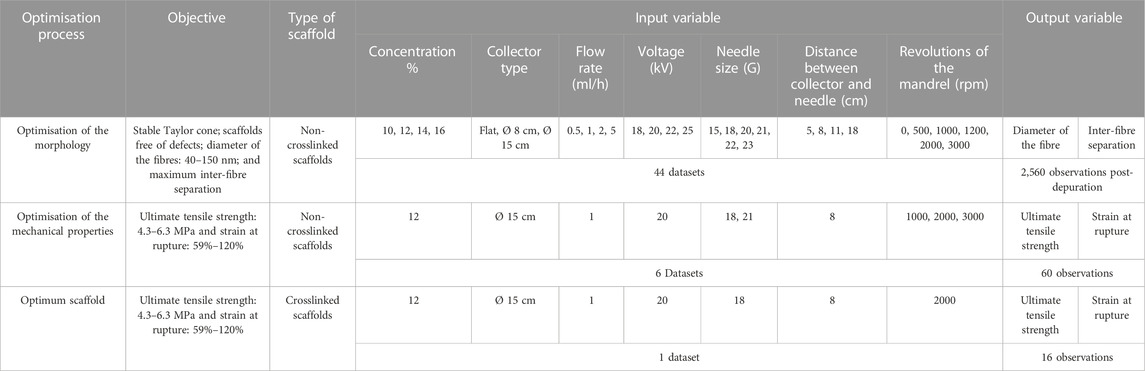
TABLE 1. Studies performed to determine the optimum process and solution parameters.
2.4 Chemical crosslinking
The crosslinking was performed on the optimum scaffold by vapour deposition, pouring 25 ml of 25% GTA in a Petri dish at the bottom of a sealed desiccator. A total of 16 samples were crosslinked to be mechanically characterised and dried under a fume hood for 24 h.
2.5 Scaffold characterisation
2.5.1 Morphology of the fibres
A SC7640 sputter coater (Quorum Technologies Ltd., Kent, United Kingdom) was used to coat the samples with gold prior to their visualization with a field emission scanning electron microscope (Zeiss Supra 40, FE-SEM, Carl Zeiss SMT Ltd., Cambridge, United Kingdom). The intensity used for coating the samples was 20 mA, voltage 0.8 kV, and the duration of the coating was 120 s. SEM images of each sample created with the different setups were taken at around 6 mm working distance, with a voltage of 2 kV and with magnifications of 1000x, 2000x and 3000x. Fibre diameters and inter-fibre separations were determined with AxioVision SE64 Rel. 4.9.1 (Carl Zeiss SMT Ltd., Cambridge, United Kingdom) by measuring 20 fibres per sample. Three samples (replicates) were measured for each different non-crosslinked scaffold and each testing condition to guarantee the repeatability of the results.
2.5.2 Mechanical characterisation
A total of 76 samples were mechanically characterised. The mechanical behaviour of six different non-crosslinked scaffolds and one crosslinked scaffold (created with the optimum solution and process parameters) were analysed. From each non-crosslinked scaffold, six longitudinal and six transverse samples were tested and for the crosslinked scaffold, and eight longitudinal and eight transverse samples were mechanically characterised. Longitudinal samples were called to the samples with the fibres orientated longitudinally to the applied load during the tensile test. Transverse samples were the ones with their fibres orientated transversally to the applied load.
The samples were removed from the mats with a dog-bone cutting die (25 mm × 4 mm, test length x width). Their thickness was measured three times with a digital and an analogical calliper in order to check the consistency of the measurements. They were attached on a cardboard frame to help the alignment of the sample in the tensiometer (Instron H10KS) and they were tensile tested until failure with a 100 N load cell and 1 mm/min test speed. Ultimate tensile strength and strain at break were determined for each sample and statistically analysed (described in Section 2.6.1) in order to evaluate the relationship between this mechanical property and the morphological properties.
2.6 Prediction models
In this research, data mining tools such as decision trees, ANN, and statistical models (MANOVA, MANCOVA, and MLR) were studied to predict morphology and mechanical properties of electrospun scaffolds and determine the optimum manufacturing conditions that led to the manufacturing of scaffolds with comparable morphological and mechanical properties to the natural blood vessels.
A description of the followed steps is presented in Figure 1.
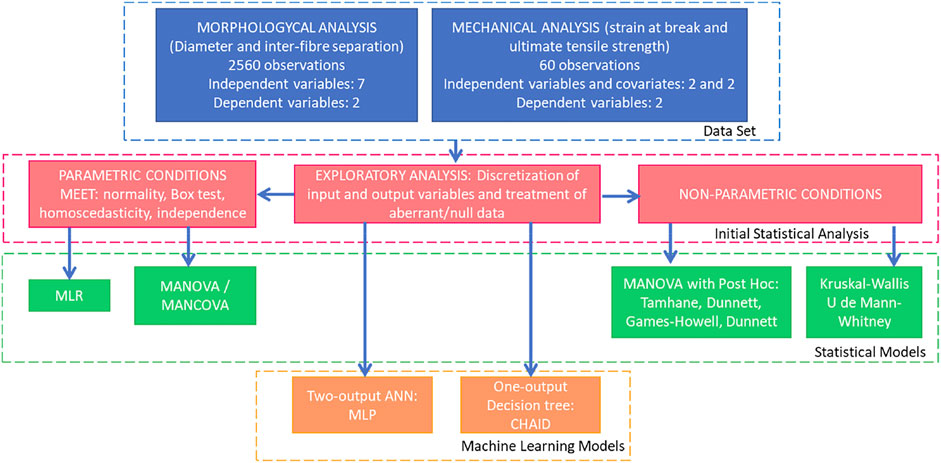
FIGURE 1. Outline of the followed methodology.
2.6.1 Statistical analysis and models
An initial exploratory analysis was necessary prior to the development of the models. The input and output variables were discretized as needed and the aberrant and null data treated. In addition to this initial analysis, the homoscedasticity, normality, independence, and the Box test were assessed to determine the parametric or non-parametric conditions of the distribution of the independent variables.
The multivariate analysis of variance (MANOVA) verified the significance of each of the independent variables, exogenous to the model and their interactions in the formation of the dependent or endogenous and continuous variables. A MANOVA was adopted for the optimisation of the scaffold’s morphology, where the independent variables were concentration of the polymer, flow rate, voltage, diameter of the needle, distance between the needle and the collector, type of collector, and revolutions of the mandrel, and the dependent variables were diameter of the fibre and inter-fibre separation.
The multivariate analysis of covariance (MANCOVA) verified the significance of each of the independent variables (factors), the covariates and their interactions in the formation of the dependent or endogenous and continuous variables. A MANCOVA model was used for the optimisation of the mechanical properties, in this case, the independent variables were the diameter of the needle and the revolutions of the mandrel, and the covariates were the diameter of the fibres and inter-fibre separation; the dependent variables were strain at break and ultimate tensile strength.
R2 of MANOVA and MANCOVA models determined their accuracy. In addition, the partial squared Eta value indicates the effect sizes produced by endogenous variables, a factor or an interaction. Values of 0.01 produce small effects, those of 0.06 produce average effects, and those of 0.14 produce very high effects in that factor or interaction [40]. This study helped to corroborate the results of the predictions obtained with the CHAID and ANN.
In cases where the parametric conditions were not met, non-parametric tests such as the Kruskal–Wallis and Mann–Whitney U test were performed. These tests were conducted for all the independent variables to assess the significance between the means of diameter of the fibres and inter-fibre separation for each level of the factors and determine the optimum configuration.
Exploratory statistical analysis of the predicted variables obtained with ANN models were performed per each factor and level to determine the optimum setup.
Pearson coefficient of correlation and MLR were used to estimate the relationship between process and solvent parameters and the morphology of the scaffolds.
Mean and standard error of the mean (Std error) were calculated for all quantitative structural and mechanical properties.
All statistical analyses were conducted using SPSS (IBM Inc., Chicago, Illinois).
2.6.2 Decision tree: Chi-squared Automatic Interaction Detection
Decision trees are a powerful technique to predict dependent variables, determine the optimum values of the independent variables to achieve a specific goal (for this research, stated in Section 2.3), and determine the importance of the independent variables in the dependent variables.
In this study, CHAID decision trees were used to predict dependent variables (diameter of the fibre and inter-fibre separation) and determine the importance between those variables and the independent variables stated in Section 2.2. A total of 1,280 observations of diameter of the fibre and the same amount for inter-fibre separation were used to inform the model. The dependant variables were categorised in three intervals: values below the mean, values between the mean and the 90th percentile, and values above the 90th percentile. All the independent variables were considered categorical. The measure used to select input variables was the Chi-square test. The predicted models were validated through cross-validation with 10 sample folds and the accuracy of the cross-validation was evaluated. Standard errors, accuracy of the cross validation, and percentage of prediction accuracy were obtained with IBM SPSS v.27.Importance of the factors was compared with ANN, MANOVA, and characterisation techniques.
CHAID decision trees were conducted using IBM SPSS v.27 (IBM Inc., Chicago, Illinois).
2.6.3 Two-output artificial neural networks
For the morphological model to simultaneously predict the diameter of the fibres and the inter-fibre separation, the method used for ANN was the multilayer perceptron (MLP) with two hidden layers and 10 neurons in the first hidden layer and 8 neurons in the second layer. The activation function to use for all units in the hidden layers was the hyperbolic tangent and the activation function to use for all units in the output layer was the identity. The training set constituted 70% of the data (1792) and 30% of the data (768) was considered as the testing set for the morphological ANN model. The criteria of the training were minibatch with an automatic minibatch size, the optimization method was the gradient descent, initial learning was 0.4, learning glower 0.001, learning epochs 10, momentum was 0.9, interval centre and interval offset were 0 and 0.5, respectively, and the memory size was 1000. As in the previous subsection, 44 datasets were used (Table 1), where the independent variables were concentration of the polymer, flow rate, voltage, diameter of the needle, distance between the needle and the collector, type of collector, and revolutions of the mandrel, and a total of 2,560 observations (between diameter of the fibre and inter-fibre separation) were measured and used to inform the ANN model.
The MLP with one hidden layer and two neurons was used in the mechanical model, to simultaneously predict the ultimate tensile strength and the strain at break given the diameter of the needle and the revolutions of the mandrel as independent variables, and the diameter of the fibres and inter-fibre separation as covariates (six datasets, Table 1). The activation function used in the hidden layer was the hyperbolic tangent and the activation function to use for all units in the output layer was the identity. The criteria of the training, optimization method, initial learning, learning glower, learning epochs, momentum, interval centre and interval offset, and memory size remained the same as in the morphological ANN model, changing just the minibatch size that was 2. For this model, the training set was 76.7% of the data (46) and 23.3% of the data (14) was the testing set, being 60 the total of observations between the ultimate tensile strength and the strain at break.
ANNs were conducted using IBM SPSS v.27 (IBM Inc., Chicago, Illinois). The accuracy of the models was assessed by calculating the mean squared errors (MSEs), R2, and the sensitivity and specificity evaluated with receiver operating characteristic (ROC) curves.
3 Results
3.1 Optimisation of the morphology of the scaffold
This first phase of the study was focused on the optimisation of solution and manufacturing parameters to create scaffolds with comparable morphology as the natural tissue. Parameters such as polymer concentration, flow rate, voltage, size of the needle, distance between the needle and the collector, and revolutions of the mandrel were optimised in this study. These parameters were used to predict the diameter of the fibres and the inter-fibre separation through five different techniques: traditional characterisation technique, decision trees, two-output ANN, MANOVA, and MLR.
3.1.1 Traditional characterisation techniques
The produced scaffolds were morphologically characterised measuring the diameter of the fibres and the inter-fibre separation. The ideal setup was determined based on the premises stated in Section 2.3. The experiments performed, quality of the fibres (fibres free of defects or bead formation), and observations noticed during the performance of the experiments were summarizes in Table 2.
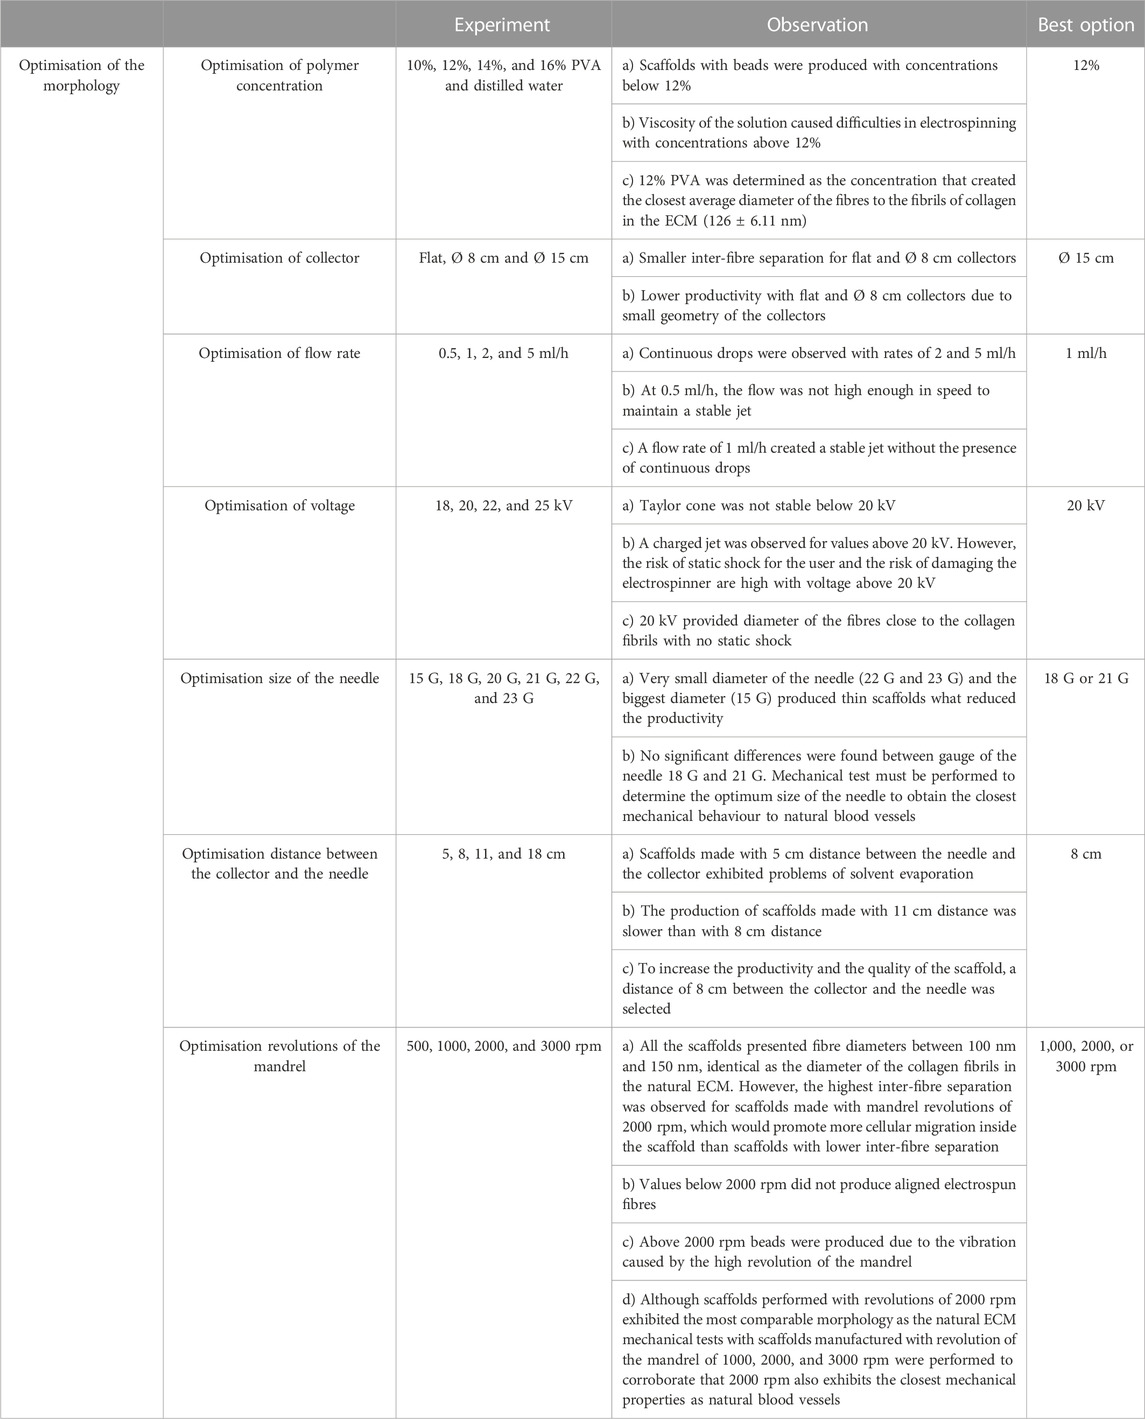
TABLE 2. Observations of the experiments.
Non-crosslinked scaffolds created with 12% PVA, 1 ml/h flow rate, 20 kV, and Ø 15 cm and 8 cm between the needle and the collector presented the most comparable morphology to the natural tissue, with aligned fibres, diameter of the fibres of 126 ± 6.11 nm (diameter of collagen fibrils of the ECM: 40–150 nm [14–17]), and inter-fibre separation of 1488 ± 91.99 nm.
3.1.2 Decision trees: Chi-squared Automatic Interaction Detection
Diameter of the fibres and the inter-fibre separation was categorised in intervals of below to the mean (below 134 nm and 997 nm), between the mean and 90th percentile, and above the 90th percentile to meet the conditions of this test [28].
The election of the nodes depends on the objective that is needed to achieve. In this case, the aim is to obtain a morphology comparable to the natural cardiovascular tissue; therefore, the diameter of the fibres should be in the range of 40–150 nm mimicking the collagen fibrils of the ECM [14–17], and the inter-fibre separation should be as higher as possible to favour the cell–cell interactions and cell density [18]. Considering these premises, the election criteria were to select those nodes with higher sample size (n) of fibres with diameter below the mean (Figure 2) and select the nodes with higher sample size (n) between the mean and above the 90th percentile of the inter-fibre separation (Figure 3).
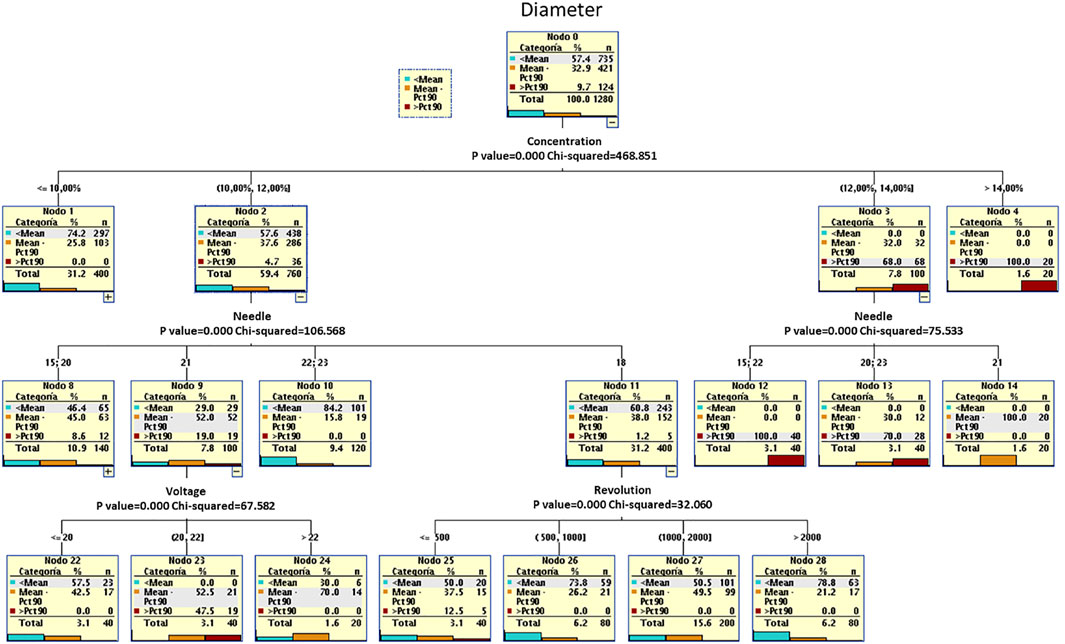
FIGURE 2. Decision tree to predict the diameter of the fibres based on the most relevant variables.
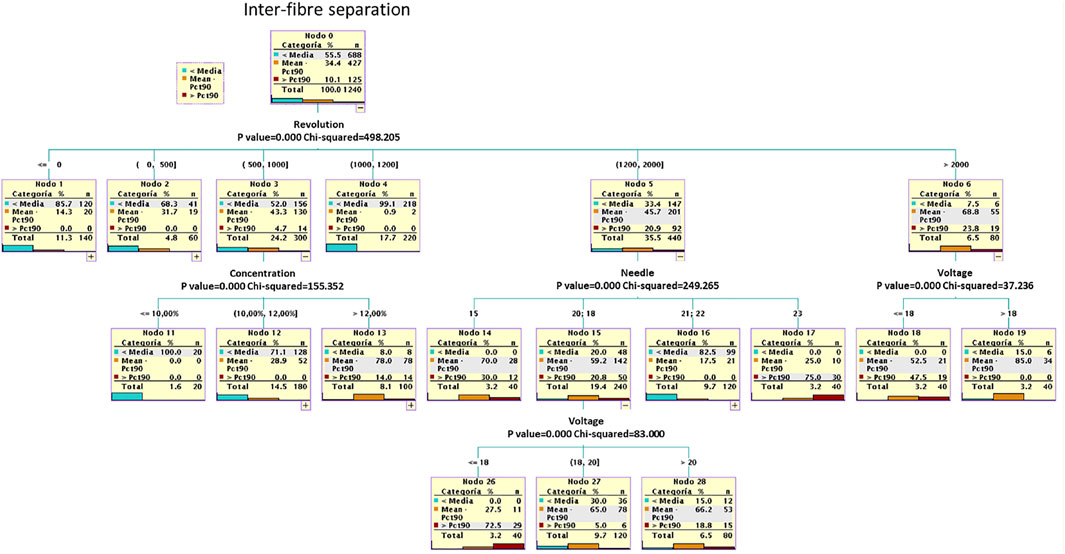
FIGURE 3. Decision tree to predict inter-fibre separation based on the most relevant variables.
Figure 2 shows that nodes 2, 11, and 27 were the ones with higher sample size for diameter of the fibres below the mean (134 nm). These nodes corresponded to concentration of 10%–12%, 18 G gauge of the needle and 1000–2000 rpm. Moreover, the most important variable to predict the diameter of the fibres was the concentration of the polymer, followed by the gauge of the needle, applied voltage, and the revolutions of the mandrel.
The model to predict the diameter of the fibres provided a standard error of 1.2% and a percentage of total prediction accuracy of 75%, where the values of diameter of the fibres below the mean obtained a prediction accuracy of 96.5% and an accuracy of the cross validation of 72.8%.
Figure 3 shows that nodes 5, 15, and 27 were the ones with higher sample size for inter-fibre separation above the mean (997 nm). These nodes corresponded to 1200–2000 rpm, 18–20 G gauge of the needle, and 18–20 kV. Moreover, the most important variable to predict the inter-fibre separation was the revolutions of the mandrel, following by the gauge of the needle, concentration of the polymer, and the applied voltage.
The model to predict the inter-fibre separation provided a standard error of 1.1% and a percentage of total prediction accuracy of 82%, where the prediction accuracy for values of inter-fibre separation above the mean and 90th percentile was 82.4% and the accuracy of the cross validation was 80.2%
Considering these two models, the optimum input parameters to reach the premises previously stated would be: 10% or 12% concentration of the polymer, 18 G gauge of the needle, 2000 rpm, and 18 or 20 kV.
3.1.3 Two-output artificial neural network
ANNs are able to predict dependent variables and assess the importance of the independent variables to predict the dependent variable. The concentration of the polymer had an importance of 31.7%, gauge of the needle had 16.5%, voltage had 14.4%, revolutions of the mandrel had 12.7%, distance between the collector and the needle had 11.9%, kind of collector had 9.9%, and the flow rate had an importance of 2.9% in the prediction of both diameter of the fibres and inter-fibre separation. These results agreed to the ones obtained with the CHAID method.
The adopted model generates predictions of diameter of the fibres with mean squared error (MSE) of 0.00017 and 0.0383 for the prediction of the inter-fibre separation. The MSE remained stable for both the diameter of the fibres and the inter-fibre separation.
Another way to analyse the accuracy of the model is representing the predicted values against the observed values. The model will be more accurate when the gradient of the regression is close to 1, y-intersect to 0, and the R2 close to 1. Figure 4 shows that both the prediction of the diameter of the fibres and the inter-fibre separation are very accurate with R2 of 0.91 and 0.81, respectively. These graphs also allow comparison with the MANOVA model to assess the accuracy of both models.
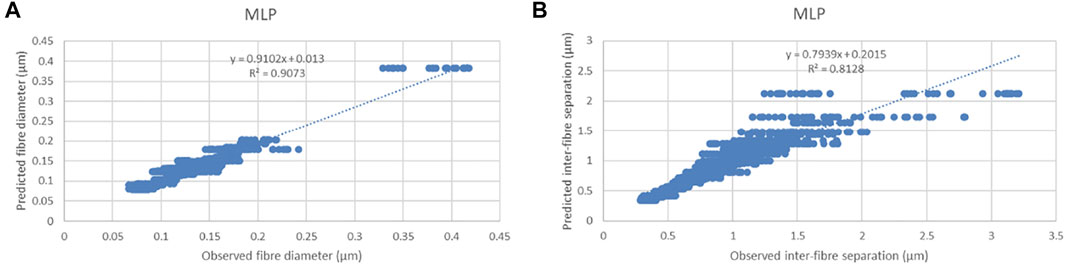
FIGURE 4. Multilayer perceptron predictions for (A) diameter of the fibres and (B) inter-fibre separation.
The final technique to evaluate the accuracy of ANN models is studying its sensitivity (true positives) and specificity (1 - false positives). However, the dependent variables (diameter of the fibres and the inter-fibre separation) must be categorised to be able to use this technique based on the ROC curve. The area under the sensitivity vs. specificity curves indicates how optimal the model is. Models with areas between 0.9 and 1 are classified such as excellent, from 0.8 to 0.9 good, 0.7–0.8 fair, 0.6–0.7 poor, and 0.5–0.6 fail. Figure 5 shows the sensitivity vs. the specificity for the diameter of the fibres and the inter-fibre separation with the areas under the curves. All the area’s values indicated an excellent prediction except for one for the fibre diameter that indicates a good prediction.
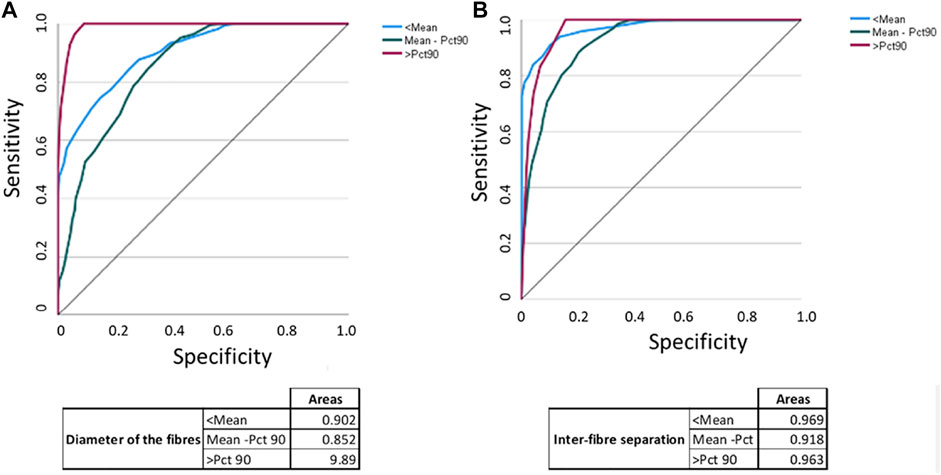
FIGURE 5. Sensitivity vs. specificity and areas under the curve for (A) diameter of the fibres and (B) inter-fibre separation.
An exploratory statistical analysis of the predicted variables was performed per each factor to determine the optimum setup. As previously stated, factors which produced diameter of the fibres closer to the size of the collagen fibrils and with higher inter-fibre separation were considered optimum and shadowed areas in Figure 6 represent the optimisation of the parameters. The optimum setup found from the ANN model was: 12%–14% concentration of the polymer, 8–9 cm between the needle and the collector, 18–20 kV, rotational collector of 15 cm, more than 2000 rpm, 18–21 G gauge of the needle, and 1 ml/h flow rate.
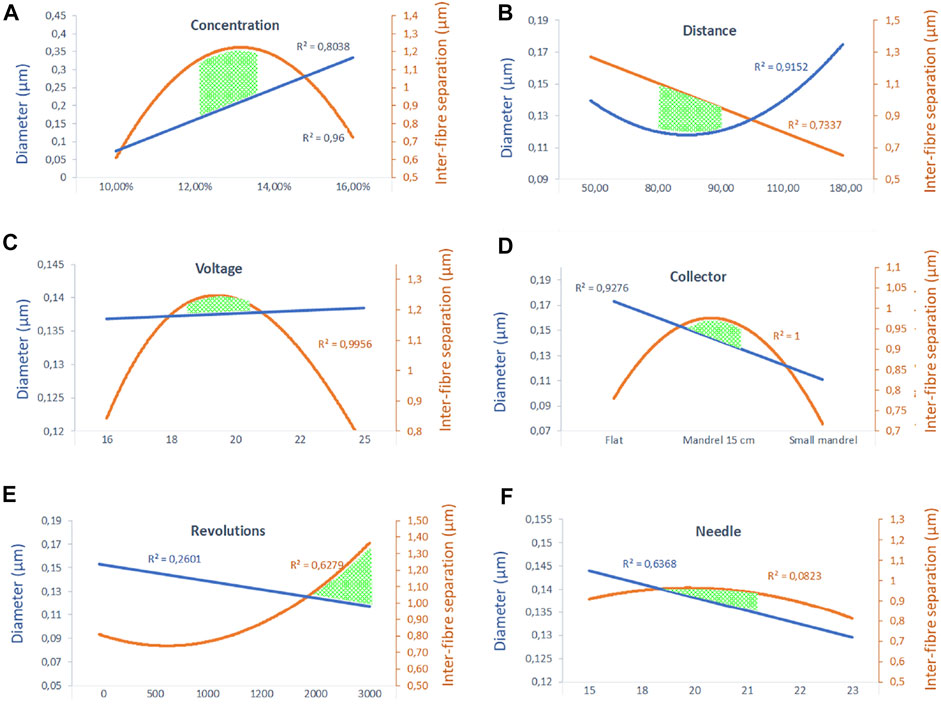
FIGURE 6. Optimisation of the parameters based on low values of diameter of the fibres and high values of inter-fibre separation for (A) PVA concentration, (B) distance between the collector and the needle (mm), (C) voltage (kV), (D) type of collector, (E) revolutions (rpm), and (F) gauge of the needle.
3.1.4 Multivariate analysis of variance
The MANOVA analysis showed that the variance of the means of the different categories of the variables was significantly different, which produced different effects of the diameter of the fibres and the inter-fibre separation (Table 3). Moreover, the model predicted the diameter of the fibre with R2 of 0.912 and with R2 of 0.816 to predict the inter-fibre separation, demonstrating in both cases the excellent goodness of the fit. It is worth noticing that if the intersection is null, the R2 would be 0.992 and 0.968.
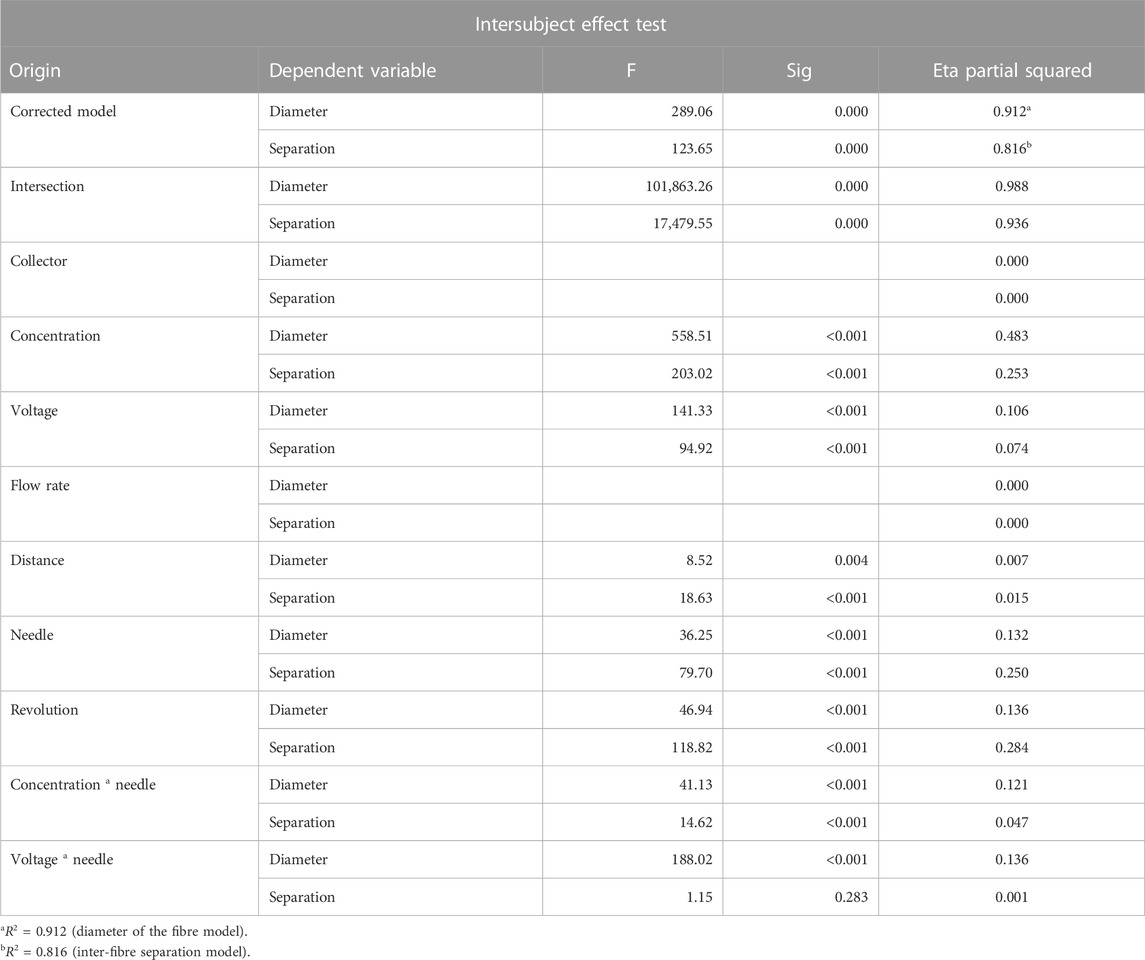
TABLE 3. MANOVA for the diameter of the fibres and inter-fibre separation.
The size of the effects produced by each variable are showed in the Eta part squared column (Table 3), this indicates that the concentration of the polymer, revolution of the mandrel, gauge of the needle, and voltage caused higher effects on the prediction of both endogenous variables. This fact is in agreement to the results previously reported for the ANN and the decision trees. A comparison between the ordinal importance of each factor for CHAID, ANN, and MANOVA is presented in Figure 7.
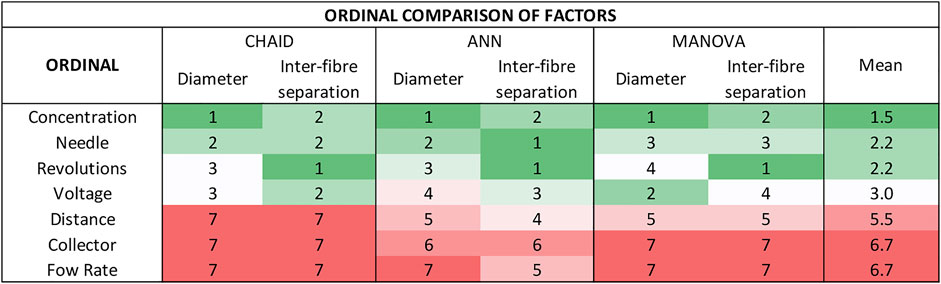
FIGURE 7. CHAID vs. MANOVA vs. ANN: ordinal importance of each factor to predict both diameter of the fibres and inter-fibre separation (1 is the most important factor and 7 is the least important factor).
The observed diameter of the fibres and observed inter-fibre separation vs. the predicted values were evaluated in order to compare the predictions obtained with the ANN and the MANOVA (Figure 8).
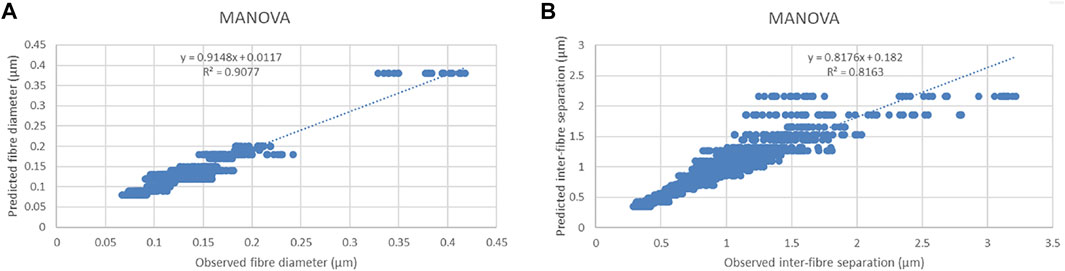
FIGURE 8. MANOVA predictions for (A) diameter of the fibres and (B) inter-fibre separation.
It was observed that regression models generated with multilayer perceptron (Figure 4) exhibited gradients and y-intercepts analogous to the ones obtained through MANOVA models (Figure 8), also R2 is comparable in both cases. Moreover, a linear regression was also performed between the data predicted by ANN and by MANOVA, the slope is very close to one and the ordinate at the origin to zero, with R2 equal to 0.99, which indicates that artificial neural networks can successfully substitute the MANOVA models when the parametric conditions are not meet.
The Box, Levene, and Kolmogorov–Smirnov tests confirmed the non-homogeneity of covariance and variance for the model and the non-normality (p-value < 0.001); therefore, the parametric conditions were not meet in our case and other non-parametric tools such as decision trees or ANN were more appropriate.
After performing the Kruskal–Wallis and Mann–Whitney U test (non-parametric test) for all the independent variables, it was demonstrated that there were significant differences between each level of the factors. As the MANOVA indicated that there were no differences of the means between the different interactions (with the exception of two: concentration × needle and needle × voltage interactions), the differences of the means shown for each factor by the non-parametric tests were reliable, especially with the high level of fit (R2) of the MANOVA and with the values of partial squared Eta that indicated that there were clear effects of the factors in the dependent variables.
The optimum setup found from the Kruskal–Wallis test to meet the requirements states in previous sections was the same as for ANN: 12%–14% concentration of the polymer, 8–9 cm between the needle and the collector, 18–20 kV, rotational collector of 15 cm, more than 2000 rpm, 18–21 G gauge of the needle, and 1 ml/h flow rate.
3.1.5 Multiple linear regression
The MLR model predicted the diameter of the fibres with R2 of 0.6 and the inter-fibre separation with R2 of 0.447. Pearson coefficients respect the diameter of the fibres were highly significant and revealed positive correlations for polymer concentration and flow rate and negative correlations for gauge of the needle, distance between the needle and the collector, and revolutions of the mandrel; however, the applied voltage did not have a clear impact on the diameter of the fibres. Positive correlations were found to respect the inter-fibre-separation for concentration and flow rate, negative correlations for voltage and distance between the needle and the collector, and gauge of the needle and revolution of the mandrel did not have repercussion on the inter-fibre separation.
3.2 Optimisation of the mechanical properties of the scaffold
The second phase of the study was focused on the optimisation of the revolutions of the mandrel and the gauge of the needle to create scaffolds with comparable mechanical properties to the natural tissue. The rest of the manufacture parameters were constant and determined in the previous section. Diameter of the fibres, inter-fibre separation, size of the needle, and revolutions of the mandrel were used to predict the ultimate tensile strength and strain at break through three different techniques: traditional characterisation techniques, ANN, and MANCOVA.
3.2.1 Traditional characterisation techniques
Revolutions of the mandrel and gauge of the needle were considered optimum when the ultimate transverse tensile strength and strain at break reached values comparable to the native blood vessel. Moreover, PVA is a water-soluble polymer, therefore, to slow down its degradation process it was necessary to crosslink the scaffold (created with the optimum process and solution parameters) and characterise the new crosslinked samples. The ultimate longitudinal and transverse tensile strength for these non-crosslinked and crosslinked scaffolds and transverse strain at break are presented in Table 4.
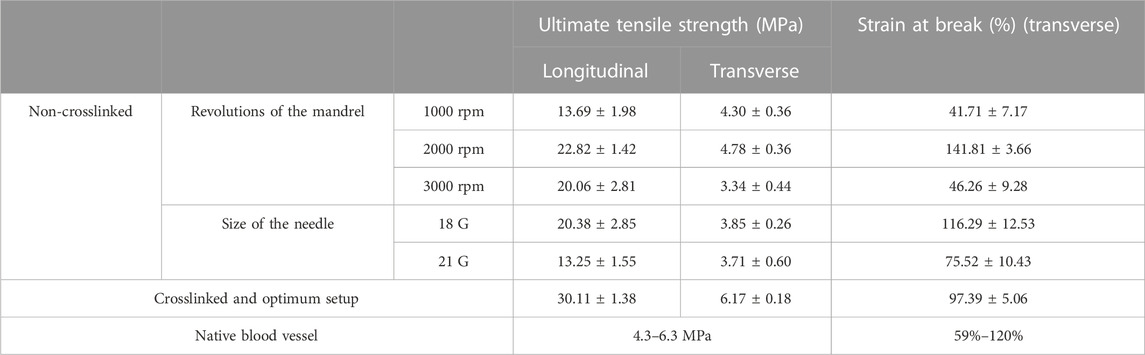
TABLE 4. Ultimate longitudinal and transverse tensile strength and transverse strain at break.
From the results obtained, it was observed that the crosslinked samples, created with the optimum setup (2000 rpm, 18 G, 12% PVA, 1 ml/h, 20 kV, and 8 cm distance), increased their ultimate transverse tensile strength from 4.78 ± 0.36 MPa to 6.17 ± 0.18 MPa, and when the load was applied longitudinal to the direction of the fibres reached 30.11 MPa. The strain at break for crosslinked scaffolds produced with the optimum parameters was 97.39 ± 5.06. The observed ultimate tensile strength for crosslinked samples in the transverse direction and transverse strain at break exhibited comparable values to the ultimate tensile strength and strain at break of native blood vessels (4.3–6.3 MPa and 59%–120% [19]).
3.2.2 Artificial neural network
The importance of the different factors considered in the study to predict the ultimate tensile strength and strain at break was determined. The revolutions of the mandrel were the most important variable to predict the ultimate tensile strength and strain at break, with an importance of 53%, following by the gauge of the needle with a 27.8% of importance, the diameter of the fibres with 10.4%, and the inter-fibre separation with an 8.8% of importance.
The model produced good predictions of strain at break with MSE of 0.0497 for the training and 0.0309 for the testing. However, the variability of the ultimate tensile strength was small between different factors; therefore, the accuracy of the predictions of the ultimate tensile strength was low, with high-MSE errors (0.797 for the training and 0.354 for the testing).
The values of the observed strain at break versus the predicted strain at break and the observed ultimate tensile strength vs. the predicted one obtained from the ANN model were represented in Figure 9. The ideal fit and the linear fit did not differ significantly in the strain at break graph (Figure 9A), and the observed vs. predicted data fitted the regression line with R2 of 0.749, which demonstrated the goodness of the fit of the ANN model. However, the coefficient of determination to predict the ultimate tensile strength was 0.223 (Figure 9B), showing a low prediction of this endogenous variable.
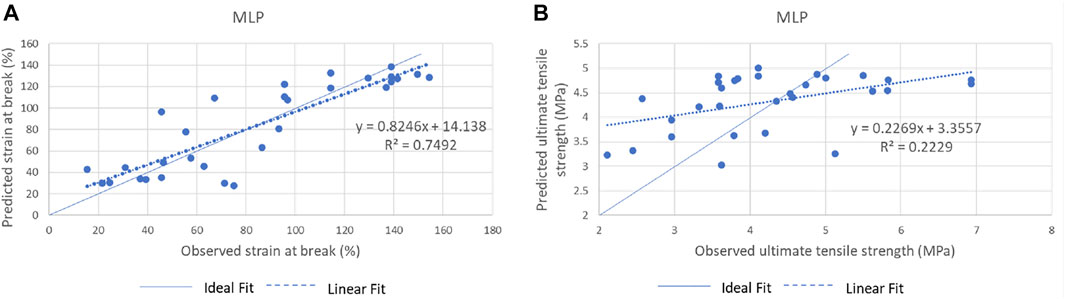
FIGURE 9. Observed values vs. predicted values with multilayer perceptron: (A) strain at break (%) vs. predicted strain at break (%) and (B) observed ultimate tensile strength (MPa) vs. predicted ultimate tensile strength (MPa).
As in Section 3.1.3, an exploratory statistical analysis of the predicted variables was performed per each factor to determine the optimum setup. Factors which produced ultimate tensile strength and strain at break comparable to the vascular tissue were considered optimum. The optimum setup found from this ANN model was 18 G gauge of the needle and 2000 rpm, (12% concentration of the polymer, 20 kV, 8 cm between the needle and the collector, and 1 ml/h flow rate were fixed).
3.2.3 Multivariate analysis of variance
The MANCOVA analysis showed that the variance of the means of the different categories of the variables was significantly different for gauge of the needle and revolutions of the mandrel, which produced different effects of the strain (Table 5); however, the diameter of the fibres and the inter-fibre separation did not present significant differences. The MANCOVA model predicted the strain at break with R2 of 0.810, demonstrating a goodness of the fit.
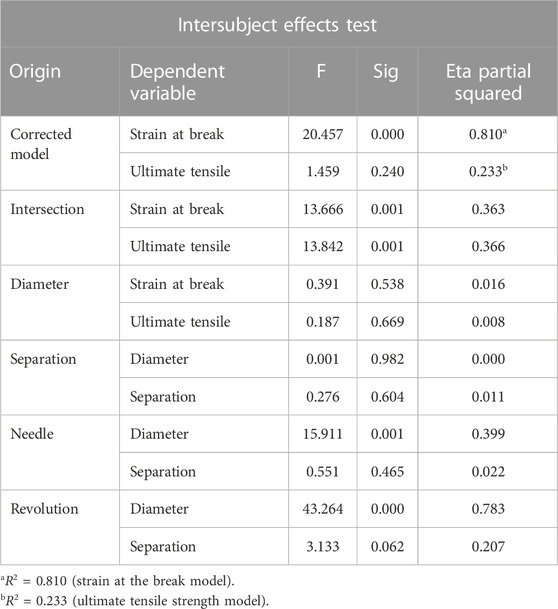
TABLE 5. MANCOVA for strain at break and ultimate tensile strength.
However, this model predicted the ultimate tensile strength with a coefficient of determination of 0.233, in the same range of the one obtained with the ANN model. This was due to the low variability of the means of this variable for each factor, what leaded to non-significant factors and covariates and consequently a non-significant model to predict the ultimate tensile strength (p-value 0.24, Table 5).
Both the Box test for equality of covariance matrices and the Levene test for homogeneity of variances confirmed that the parametric conditions were met with a p-value of 0.448 and 0.506, respectively.
Figure 10A presents the values of the observed strain at break versus the predicted strain at break from the MANCOVA model. As in the previous section, the ideal fit and the linear fit did not differ significantly, and the observed vs. predicted data fitted the regression line with R2 of 0.8008, which demonstrated the goodness of the fit of the MANCOVA model. Figure 10B shows a regression line with analogues gradient, y-intersect and R2 to the regression line obtained with the ANN model (0.227, 3.356, and 0.223 against the 0.233, 3.273, and 0.233 obtained with the MANCOVA, respectively).
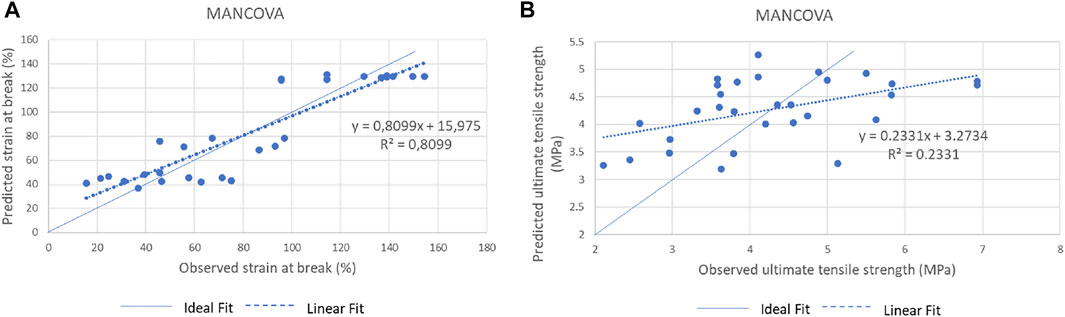
FIGURE 10. Observed values vs. predicted values with MANCOVA: (A) strain at break (%) vs. predicted strain at break (%) and (B) observed ultimate tensile strength (MPa) vs. predicted ultimate tensile strength (MPa).
Regression models generated with multilayer perceptron (Figure 9) exhibited gradients and y-intercepts comparable to the ones obtained through the MANCOVA model (Figure 10), also the R2 were comparable in both cases, which ratified that ANN can successfully substitute the MANCOVA models when the parametric conditions are not meet.
4 Discussion
Decision trees were shown to be a novel and powerful tool in electrospinning to identify the importance of the different exogenous variables and identify the path to follow to obtain a specific objective (in this research to achieve biomimetic vascular grafts). Due to its ability to classify data, it was the most time effective method to easily find the optimum setup of the parameters without any additional analysis. Moreover, they are easy to interpret and understand, they support non-parametric and parametric conditions, they are robust to outliers, divide independent variables into significant subgroups simplifying complex relationships between exogenous and endogenous variables and it is not needed data transformation when the data are heavily skewed [28]. However, if the dataset is small, issues related to overfitting or underfitting could appear which compromised the robustness of the models [28]. Moreover, CHAID and QUEST need to operate with categorical data for the dependent variable, therefore, if this variable is continuous, it must be previously categorised. Despite their lower accuracy (82% accuracy in this study) compared to other machine learning techniques such as ANN, predictions and importance of the variables were in agreement to the ANN; therefore, the use of this technique is highly recommended by the authors for its easier interpretation of the results, which can be used for the optimisation of the manufacturing of different biological tissues.
Machine learning, especially ANN, offers great possibilities for programming the parameterization of electrospinning by freeing the constraints to the parametric conditions, as well as the typologies of the dependent or independent variables of the analysis of variance and covariance. ANNs have great flexibility to interpret and adapt to different types of variables and high efficiency in non-linear systems modelling [33, 42, 43]. The self-organization of information enables to distinguish inconsequential information (noise) from relevant information. As a consequence of their learning processes, they are easy to optimise the quality of the predictions; however, once the optimal results are obtained, they must be replicated by activating the initialiser of the active random generator, introducing the data and factors in the same order and keeping the same configuration of the model [44]. After 15 interactions, the MSE remained stable and the coefficient of variation was 3.2% for the training sample, demonstrating the good stability of the ANN model. As mentioned in methods Section 2.2, a calibration process was performed to identify the operational range of each parameter for PVA, inferior or superior values to the range would not produce fibres or the quality of the electrospun scaffold would be highly affected by factors such as bead formation, problems with solvent evaporation, and unstable Taylor cone. Therefore, the optimal parameters are within the interval defined during the calibration process. This study demonstrated that ANN can successfully substitute popular statistical techniques such as ANOVA, MANOVA, ANCOVA, MANCOVA, and linear regression models being an excellent option, especially when the parametric conditions are not meet. Moreover, the optimum setup parameters can be determined though an exploratory analysis of all the variables and their levels and finding the levels that minimise the diameter of the fibre and maximise the inter-fibre separation.
MANOVA and MANCOVA are able to predict a specific variable from each observation and assess the accuracy of the model with predicted values versus observed value plots. The regression obtained for these plots were used in this study to compare the accuracy between different techniques (MANOVA and MANCOVA vs. ANN) and models. However, the parametric conditions of the distribution of the variables must be met in order to apply MANOVA and MANCOVA models, otherwise post hoc analysis such as Tamhane, Dunnett, Games–Howell, or non-parametric analysis such as the Kruskal–Wallis or U de Mann–Whitney test must be performed. These statistical methods revealed a good accuracy (R2 = 0.91) comparable to the ANN.
It is worth mentioning that the inclusion of seven independent variables with fixed levels for the morphological predictions allowed to minimise the bias error and the interactions did not affect the significance of the calculated F of each input variable. These approaches, in addition to the low number of significant interactions detected for the MANOVA (2 interactions out of 127 possible interactions. Table 3), the high R2 of the model (diameters: 0.912 and inter-fibre separation: 0.816), insignificant MSEs (diameters: 0.000164 and inter-fibre separation: 0.039601), and the high significance of the independent variables, demonstrates the simplicity of the model with a very low representativeness of the interactions.
MLR exhibited the lowest accuracy (R2 = 0.6) of all the prediction models. This fact was also reported by Kalantary et al., Vle et al., and Siafaka et al. [33, 45, 46]. Kalantary et al. (2020) developed an ANN and MLR to predict the fibre diameter in electrospun scaffolds made with poly (3-caprolactone) and gelatin, the results of ANN modelling presented higher accuracy than the MLR (R2 = 0.959 vs. R2 = 0.564). Vle et al. (2015) studied physical properties such as shrinkage and tenacity in drawn nylon-6 fibres through MLR and ANN, this study concluded that ANN is an effective technique for prediction of the physical properties of drawn fibres, providing a better fit for measured response than the regression model. Siafaka et al. (2016) investigated the effect of content of poly (lactic acid) and poly (butylene adipate) on an initial burst effect and dissolution behaviour with ANN and MLR, these models presented R2 = 0.945 and R2 = 0.85.
In summary, decision trees are the initial tool that indicates the “path to follow” and provide a clear indication of the optimum parameter setup; however, their accuracy is lower than ANN (82% accuracy). When there is more than one dependent variable, the ANNs are a very useful tool, especially in the event of non-compliance with the parametric conditions of the MANOVAS/MANCOVAS/MLR or when the interpretation of their results is found cumbersome. ANNs are the most accurate technique (cross-validation MSE = 0.000194 and R2 = 0.91), and they are able to identify the importance of the independent variables. However, the optimum parameter setup is not straight forward founded and an exhaustive exploratory analysis is required. MANOVA and MANCOVA models exhibited a good accuracy (R2 = 0.91) like the ANN; however, the parametric conditions must be met. MLR showed the lowest accuracy (R2 = 0.6) of all of the prediction models. Finally, traditional characterisation methods were a very intuitive alternative and help narrowing the initial values of the parameters; however, they are subjective, do not estimate errors or evaluate the reliability and they are based on the trial-and-error method, which significantly increases the number of experiments, and therefore the time invested, material used, and the cost, these disadvantages can be avoided with machine learning or statistical models.
All these prediction techniques provided similar importance of the variables, being the concentration of the polymer, gauge of the needle, and the revolutions being the most important to predict the diameter of the fibres, and the revolutions of the mandrel, concentration and gauge of the needle being the most important to predict the inter-fibre separation. The distance between the needle and the collector, type of collector, and the flow rate were found as the least important factors in the prediction of the morphology.
Decision trees, ANN, MANOVA/MANCOVA, and MRL showed similar tendencies of the independent variables to respect the dependent variables, and therefore a similar optimisation of the inputs which were also consistent with the traditional characterisation method based on laboratory observations. Regarding the diameter of the fibres, ANN and MLR showed positive correlations for polymer concentration, flow rate, both conclusions in agreement with Li et al. [47]; negative correlations for gauge of the needle, distance between the needle and the collector and revolutions of the mandrel, also reported in several studies [9, 47, 48]; and unclear impact on the diameter of the fibres for the applied voltage, fact also observed by Reneker et al. [49]. The morphological ANN model found a relationship between the inter-fibre separation and the independent variables that followed, in most of the cases, a second order polynomial relation with maximum inter-fibre separation for values between 12% and 14% of concentration, 8–9 cm distance between the needle and the collector, 18–20 kV, Ø 15 cm mandrel, 2000–3000 rpm, 1 ml/h, and 18–21 G, helping to determine the optimum input variables.
This article proved the suitability of machine learning and statistical modelling to find the optimum manufacturing parameters to develop biomimetic vascular grafts. Following modelling techniques (machine learning and statistical modelling) and the traditional method, the optimum setup found was 12% PVA, 1 ml/h, 20 kV, 15 cm mandrel, 8 cm distance, 2000 rpm, and 18 G. Scaffolds produced with this configuration reporting excellent values of maximum tensile strength (6.17 ± 0.18 MPa) comparable to 4.3–6.3 MPa exhibited in the vascular tissue [19] and strain at break of 97.39 ± 5.06 comparable to the 59%–120% reported for this natural tissue [19]. Moreover, the scaffolds showed values of fibre diameter between 120 and 140 nm comparable to the values of the collagen fibrils of the native ECM (40–150 nm [14–17]).
It is worth notice that the relationships found between the exogenous and endogenous variables in this study are highly affected by the polymer used [33]; however, once the predicted models are created, they can be used to find the optimum setup for different kinds of biological tissues with the same polymer.
5 Conclusion
This study demonstrated for the first time that vascular substitutes, with comparable biomechanical behaviour and physical structure to the native vascular tissue, can be successfully achieved through an optimisation of the manufacturing inputs, based on a novel CHAID prediction model, two-output ANN models, MANOVA/MANCOVA/MLR models, and characterisation methods. Decision trees and ANN demonstrated to be powerful tools to predict the morphology and the mechanical properties of electrospun scaffolds and they are able to determine the optimum manufacturing setup reducing the number of trails currently needed in the electrospinning technique. In addition, once machine learning models are created, these can be used to find the most appropriate set-up for different kind of biological tissue. Moreover, it was verified that ANN algorithms can substitute ANOVAS, MANOVAS, ANCOVAS, and MANCOVAS when the parametrical conditions are not meet.
Scaffolds created with an optimum setup reported ultimate tensile strength of 4.78 ± 0.36 MPa for the non-crosslinked samples and 6.17 ± 0.18 MPa for crosslinked samples, when the load was applied transverse to the direction of the fibres. Both crosslinked and non-crosslinked samples exhibited values of maximum tensile strength similar to the native vascular tissue 4.3–6.3 MPa [19]. Moreover, the strain at break in the transverse direction was 141.81 ± 3.66 for the non-crosslinked samples and 97.39 ± 5.06 for the crosslinked samples, exhibited values analogous to the vascular tissue 59%–120% [19]. Regarding the morphology, the scaffolds produced with the optimum input parameters presented fibre diameter between 120 and 140 nm comparable to the diameter of the collagen fibrils in the extracellular matrix (40–150 nm [14–17]).
Data availability statement
The raw data supporting the conclusion of this article will be made available by the authors, without undue reservation.
Author contributions
Conception of the article, experiment performance, statistical and machine learning studies, and writing the article: ER. Experimental design, analysis, and interpretation of the results: ER, KA, GC, and NR. Critical revision of the article and final approval: ER, KA, GC, and NR.
Funding
This research was funded by the Faculty of Science and Engineering, Manchester Metropolitan University.
Acknowledgments
Some experimental work included in this study was partially performed in the Manchester Institute of Biotechnology (University of Manchester). The authors would like to acknowledge Professor Paulo Jorge Da Silva Bartolo for his support allowing the use of the University of Manchester facilities. They would also like to thank the technical staff of the Manchester Metropolitan University, Mike Green and Hayley Andrews, for training ER on the use of the tensiometer and the SEM.
Conflict of interest
The authors declare that the research was conducted in the absence of any commercial or financial relationships that could be construed as a potential conflict of interest.
Publisher’s note
All claims expressed in this article are solely those of the authors and do not necessarily represent those of their affiliated organizations, or those of the publisher, the editors, and the reviewers. Any product that may be evaluated in this article, or claim that may be made by its manufacturer, is not guaranteed or endorsed by the publisher.
References
1. Herman IP. Physics of the human body. Cham: Springer International Publishing (2016). doi:10.1007/978-3-319-23932-3
2. Laslett LJ, Alagona P, Clark BA, Drozda JP, Saldivar F, Wilson SR, et al. The worldwide environment of cardiovascular disease: Prevalence, diagnosis, therapy, and policy issues. J Am Coll Cardiol (2012) 60:S1–49. doi:10.1016/j.jacc.2012.11.002
3.IntechOpen Epidemiology of coronary artery disease (2012) | IntechOpen, London. Available at: https://www.intechopen.com/chapters/32288 [Accessed September 27, 2022].
4. Deb S, Wijeysundera HC, Ko DT, Tsubota H, Hill S, Fremes SE. Coronary artery bypass graft surgery vs percutaneous interventions in coronary revascularization: A systematic review. JAMA (2013) 310:2086–95. doi:10.1001/jama.2013.281718
5. Rashid ST, Fuller B, Hamilton G, Seifalian AM. Tissue engineering of a hybrid bypass graft for coronary and lower limb bypass surgery. FASEB J (2008) 22:2084–9. doi:10.1096/fj.07-096586
6. Wagenseil JE, Mecham RP. Vascular extracellular matrix and arterial mechanics. Physiol Rev (2009) 89:957–89. doi:10.1152/physrev.00041.2008
7. Parikh V, Kadiwala J, Hidalgo Bastida A, Holt C, Sanami M, Miraftab M, et al. Small diameter helical vascular scaffolds support endothelial cell survival. Nanomedicine (2018) 14:2598–608. doi:10.1016/j.nano.2018.08.005
8. O’Connor RA, Cahill PA, McGuinness GB. Effect of electrospinning parameters on the mechanical and morphological characteristics of small diameter PCL tissue engineered blood vessel scaffolds having distinct micro and nano fibre populations – a DOE approach. Polym Test (2021) 96:107119. doi:10.1016/j.polymertesting.2021.107119
9. Haider A, Haider S, Kang I-K. A comprehensive review summarizing the effect of electrospinning parameters and potential applications of nanofibers in biomedical and biotechnology. Arabian J Chem (2018) 11:1165–88. doi:10.1016/j.arabjc.2015.11.015
10. Li WJ, Tuan RS. Fabrication and application of nanofibrous scaffolds in tissue engineering. Curr Protoc Cel Biol (2009) 25:Unit 25.2. doi:10.1002/0471143030.cb2502s42
11. Pham QP, Sharma U, Mikos AG. Electrospinning of polymeric nanofibers for tissue engineering applications: A review. TISSUE ENGINEERING (2006) 12:1197–211. doi:10.1089/ten.2006.12.1197
12. Ladd MR, Hill TK, Yoo JJ, Lee SJ. Electrospun nanofibers in tissue engineering. In: Nanofibers - production, properties and functional applications (2011). doi:10.5772/24095
13. Sánchez LMD, Rodriguez L, López M. Electrospinning: La era de las nanofibras. Revista Iberoamericana de Polímeros (2014) 14:10–27.
14. Shino K, Oakes BW, Horibe S, Nakata K, Nakamura N. Collagen fibril populations in human anterior cruciate ligament allografts. Electron microscopic analysis. Am J Sports Med (1995) 23:203–9. discussion 209. doi:10.1177/036354659502300213
15. Moeller HD, Bosch U, Decker B. Collagen fibril diameter distribution in patellar tendon autografts after posterior cruciate ligament reconstruction in sheep: Changes over time. J Anat (1995) 187:161–7.
16. Bancelin S, Aimé C, Gusachenko I, Kowalczuk L, Latour G, Coradin T, et al. Determination of collagen fibril size via absolute measurements of second-harmonic generation signals. Nat Commun (2014) 5:4920. doi:10.1038/ncomms5920
17. Strocchi R, De Pasquale V, Facchini A, Raspanti M, Zaffagnini S, Marcacci M. Age-related changes in human anterior cruciate ligament (ACL) collagen fibrils. Ital J Anat Embryol (1996) 101:213–20.
18. Maleki S, Shamloo A, Kalantarnia F. Tubular TPU/SF nanofibers covered with chitosan-based hydrogels as small-diameter vascular grafts with enhanced mechanical properties. Scientific Rep (2022) 12:6179. doi:10.1038/s41598-022-10264-2
19. Camasão DB, Mantovani D. The mechanical characterization of blood vessels and their substitutes in the continuous quest for physiological-relevant performances. A critical review. Mater Today Bio (2021) 10:100106. doi:10.1016/j.mtbio.2021.100106
20. Liu G, Gu Z, Hong Y, Cheng L, Li C. Electrospun starch nanofibers: Recent advances, challenges, and strategies for potential pharmaceutical applications. J Controlled Release (2017) 252:95–107. doi:10.1016/j.jconrel.2017.03.016
21. Tarus B, Fadel N, Al-Oufy A, El-Messiry M. Effect of polymer concentration on the morphology and mechanical characteristics of electrospun cellulose acetate and poly (vinyl chloride) nanofiber mats. Alexandria Eng J (2016) 55:2975–84. doi:10.1016/j.aej.2016.04.025
22. Lakshmi Narayana P, Wang X-S, Yeom J-T, Maurya AK, Bang W-S, Srikanth O, et al. Correlating the 3D melt electrospun polycaprolactone fiber diameter and process parameters using neural networks. J Appl Polym Sci (2021) 138:50956. doi:10.1002/app.50956
23. Bzdok D, Altman N, Krzywinski M. Statistics versus machine learning. Nat Methods (2018) 15:233–4. doi:10.1038/nmeth.4642
24. Bzdok D. Classical statistics and statistical learning in imaging neuroscience. Front Neurosci (2017) 11:543. doi:10.3389/fnins.2017.00543
25. Breiman L. Statistical modeling: The two cultures (with comments and a rejoinder by the author). Stat Sci (2001) 16:199–231. doi:10.1214/ss/1009213726
26. He F, Mazumdar S, Tang G, Bhatia T, Anderson SJ, Dew MA, et al. Non-parametric MANOVA approaches for non-normal multivariate outcomes with missing values. Commun Stat - Theor Methods (2017) 46:7188–200. doi:10.1080/03610926.2016.1146767
27. Breiman L. Classification and regression trees. New York: Routledge (2017). doi:10.1201/9781315139470
28. Song Y-Y, Lu Y. Decision tree methods: Applications for classification and prediction. Shanghai Arch Psychiatry (2015) 27:130–5. doi:10.11919/j.issn.1002-0829.215044
29. Jin C, De-lin L, Fen-xiang M. An improved ID3 decision tree algorithm. In: Proceeding of the 2009 4th International Conference on Computer Science and Education; July 2009; Nanning. IEEE. (2015), 127–30. doi:10.1109/ICCSE.2009.5228509
31. Kass GV. An exploratory technique for investigating large quantities of categorical data. J R Stat Soc Ser C (Applied Statistics) (1980) 29:119–27. doi:10.2307/2986296
32. Loh W-Y, Shih Y-S. Split selection methods for classification trees. Stat Sinica (1997) 7:815–40.
33. Kalantary S, Jahani A, Jahani R. MLR and ANN approaches for prediction of synthetic/natural nanofibers diameter in the environmental and medical applications. Sci Rep (2020) 10:8117. doi:10.1038/s41598-020-65121-x
34. Brooks H, Tucker N. Electrospinning predictions using artificial neural networks. Polymer (2015) 58:22–9. doi:10.1016/j.polymer.2014.12.046
35. Karimi MA, Pourhakkak P, Adabi M, Firoozi S, Adabi M, Naghibzadeh M. Using an artificial neural network for the evaluation of the parameters controlling PVA/chitosan electrospun nanofibers diameter. e-Polymers (2015) 15:127–38. doi:10.1515/epoly-2014-0198
36. Vatankhah E, Semnani D, Prabhakaran MP, Tadayon M, Razavi S, Ramakrishna S. Artificial neural network for modeling the elastic modulus of electrospun polycaprolactone/gelatin scaffolds. Acta Biomater (2014) 10:709–21. doi:10.1016/j.actbio.2013.09.015
37. Denis P, Dulnik J, Sajkiewicz P. Electrospinning and structure of bicomponent polycaprolactone/gelatin nanofibers obtained using alternative solvent system. Int J Polymeric Mater Polymeric Biomater (2015) 64:354–64. doi:10.1080/00914037.2014.945208
38. Ghobeira R, Asadian M, Vercruysse C, Declercq H, De Geyter N, Morent R. Wide-ranging diameter scale of random and highly aligned PCL fibers electrospun using controlled working parameters. Polymer (2018) 157:19–31. doi:10.1016/j.polymer.2018.10.022
39. McClure MJ, Sell SA, Ayres CE, Simpson DG, Bowlin GL. Electrospinning-aligned and random polydioxanone–polycaprolactone–silk fibroin-blended scaffolds: Geometry for a vascular matrix. Biomed Mater (2009) 4:055010. doi:10.1088/1748-6041/4/5/055010
40.FAQ (2021). FAQ/effectSize - CBU statistics Wiki. Available at: https://imaging.mrc-cbu.cam.ac.uk/statswiki/FAQ/effectSize (Accessed October 24, 2022).
41. Tehran MA, Maleki M. Artificial neural network prosperities in textile applications. IntechOpen, London (2011). doi:10.5772/16095
42. Nurwaha D, Wang X. The use of adaptive neuro-fuzzy inference systems and support vector machines techniques for evaluation of electrospun nanofiber diameter. J Comput Theor Nanoscience (2013) 10:637–42. doi:10.1166/jctn.2013.2747
44. Siafaka PI, Barmbalexis P, Bikiaris DN. Novel electrospun nanofibrous matrices prepared from poly(lactic acid)/poly(butylene adipate) blends for controlled release formulations of an anti-rheumatoid agent. Eur J Pharm Sci (2016) 88:12–25. doi:10.1016/j.ejps.2016.03.021
45. Rahbar RS, Vadood M. Predicting the physical properties of drawn Nylon-6 fibers using an artificial-neural-network model. Mater Tehnol (2015) 49:325–32. doi:10.17222/mit.2013.128
46. Li Z, Wang C. Effects of working parameters on electrospinning. In: Z Li, and C Wang, editors. One-Dimensional nanostructures: Electrospinning Technique and unique nanofibers SpringerBriefs in materials. Berlin, Heidelberg: Springer. (2004), 15–28. doi:10.1007/978-3-642-36427-3_2
47. Xu CY, Inai R, Kotaki M, Ramakrishna S. Aligned biodegradable nanofibrous structure: A potential scaffold for blood vessel engineering. Biomaterials (2004) 25:877–86. doi:10.1016/s0142-9612(03)00593-3
Keywords: optimisation, machine learning, CHAID, ANN, electrospinning, PVA, characterisation, blood vessels
Citation: Roldán E, Reeves ND, Cooper G and Andrews K (2023) Towards the ideal vascular implant: Use of machine learning and statistical approaches to optimise manufacturing parameters. Front. Phys. 11:1112218. doi: 10.3389/fphy.2023.1112218
Received: 30 November 2022; Accepted: 18 January 2023;
Published: 07 February 2023.
Edited by:
Aike Qiao, Beijing University of Technology, ChinaCopyright © 2023 Roldán, Reeves, Cooper and Andrews. This is an open-access article distributed under the terms of the Creative Commons Attribution License (CC BY). The use, distribution or reproduction in other forums is permitted, provided the original author(s) and the copyright owner(s) are credited and that the original publication in this journal is cited, in accordance with accepted academic practice. No use, distribution or reproduction is permitted which does not comply with these terms.
*Correspondence: Elisa Roldán, ZWxpc2Eucm9sZGFuLWNpdWRhZEBtbXUuYWMudWs=