- 1Department of Nanoscience and Materials, Central University of Jammu, Jammu, India
- 2Inter University Accelerator Centre, New Delhi, India
- 3Department of Physics, University of Petroleum and Energy Studies, Uttarakhand, India
- 4Department of Physics and Astrophysics, Central University of Haryana, Mahendergarh, India
Introduction: This study focuses on the detection of rhodamine-6G using surface-enhanced Raman scattering (SERS) on gold nanostructures (AuNS) of different sizes. Ion beam irradiation has been carried out to tune the size of AuNS and investigate the underlying mechanisms of sputtering and diffusion that govern their growth. Additionally, the study established a correlation between fractal growth parameters, water contact angle, and SERS detection of R6G. The results of this study offer new insights into the mechanisms of SERS detection on roughened metallic surfaces.
Methods: Thermal evaporation was used to deposit an Au thin film on a glass substrate. Subsequent 10 keV Ar+ irradiation was done on Au thin film for fluences ranging from 3×10¹⁴ to 3×10¹⁶ ions/cm2 to tune the size of AuNS. Rutherford backscattering spectroscopy (RBS) was used to confirm that the decrease in Au concentration under ion beam sputtering was responsible for the tuning in size and structure of AuNS. Fractal dimension (Df) and interface width (w) were used as statistical parameters to control the wettable characteristics of the AuNS surfaces.
Results and discussion: The researchers found that the growth of AuNS was governed by ion beam induced sputtering and diffusion mechanisms. They established a correlation between fractal growth parameters, water contact angle, and SERS detection of R6G. They found that a higher surface coverage area of Au NPs with lower fractal dimensions and water contact angles favoured the SERS detection of R6G. This study provides new insights into the mechanisms of SERS detection on roughened metallic surfaces. It is found that the growth of AuNS was governed by ion beam-induced sputtering and diffusion mechanisms, and established a correlation between fractal growth parameters, water contact angle, and SERS detection of R6G. The findings of this study may have applications in the development of more sensitive and efficient SERS-based chemical sensors.
1 Introduction
In recent years, food and water safety have become a significant concern for human health, economic growth, and social stability [1–3]. Rhodamine is a bright pink synthetic dye used in colored glasses, pyrotechnics, and fluorescent cells and gets mixed with water through industrial waste. Also, rhodamine is widely used as a food color, whose intake may cause cancer. Therefore, sensitive detection of rhodamine is desperately needed. Surface-enhanced Raman scattering (SERS) through noble metal nanoparticles is gaining much scientific interest due to its potential applications in chemical detection, pollutant detection, biomedical engineering, biosensors, and photonics [4–8]. Metal nanostructures differ from their bulk counterparts in optical, electrical, and chemical properties because of their nano-dimensional size. They exhibit a recognizable absorption peak in the UV-Vis spectrum compared to the infrared region brought on by surface plasmon resonance (SPR) under collective electron oscillation. The spectrum intensity, location, and full width at half maximum (FWHM) of the SPR peak are all influenced by the size, shape, interparticle spacing, and refractive indices of the metal [9]. For precise chemical detection in water, it is crucial to comprehend how surface morphology has changed over time.
Ion beam treatment allows for the controlled engineering of nanostructures (NSs), including aligned and partially embedded NSs, aligned nanodots, and nano-ripples [10–13]. However, the ion treatment generation of NSs is a complicated process that involves interactions between smoothening and surface instability [10, 14]. In low-energy regions (a few keV/amu), an ion loses energy through the elastic interactions with the substance atoms. As a result, the ion causes a sequence of collisions by generating recoiling atoms and cascade collisions in the film and substrate [15, 16]. Compared with traditional analysis approaches, surface scaling perception provides more information on complicated surface features [17, 18]. In addition to the knowledge gained through conventional analysis, ideas from fractal geometry offer extra helpful details on surface morphology. For example, the surface fractal dimension can provide crucial information about the physical processes involved in developing a physical object [19]. It can also assist in identifying strategies to create NSs with the desired physical and chemical properties.
Understanding the mechanism of solid surface wettability is crucial for various medical and industrial applications. For example, hydrophilic surfaces are essential for detecting various biological or chemical molecules for biosensors to work. Hydrophobic coatings, on the other hand, can shield some materials against aqueous fluids and act as antifogging agents [20]. As a result, the tunability of materials for wettability is extremely important in practice. The full intent of the fields of the study has been used to generate the distinctive properties of metal NSs with required wettability. The wettability of ion beam-produced nanostructures has been addressed in various materials; nevertheless, it is of interest to investigate the kinetics of wettability and nanostructuring in Au under the elastic collision-dominated regime of ion treatment. Investigating the kinetics of wettability and nanostructuring in Au under the elastic collision-dominated regime of ion treatment can provide a deeper understanding of the relationship between wettability and SERS, which can ultimately lead to the optimization of SERS-activated surfaces for practical applications.
The surface structure and wettability of Au thin films are investigated after the ion beam treatment with 10 keV Kr+ ions based on theoretical principles of the ion interaction with the material. The two-dimensional fractal analyses have been applied to characterize the fractal features of the surfaces. Rhodamine-6G on ion beam nanostructured Au thin films was detected using SERS by correlating with fractal growth, contact angle, and Raman intensity. The wettability of ion beam-produced nanostructures affects the effectiveness of surface-enhanced Raman scattering (SERS) because it influences the distribution and orientation of the nanostructures on the substrate surface in a better way than other chemical methods.
2 Experiment
Figure 1 shows a schematic diagram of the thermal evaporation system used to evaporate the Au wire in a molybdenum boat. Gold thin films of thickness ∼5 nm were deposited on glass surfaces by resistive heating of the Au wire having 99.9% purity. The chamber’s base pressure during deposition was kept stabilized at 1 × 10⁻⁶ mbar. During deposition, a quartz crystal monitor was used to monitor the thickness of the thin coating. The deposition has been carried out at a rate of 0.1 nm/s. Figure 1 shows the 10 keV Ar+ irradiation of deposited films at normal incidence for different fluences from 3 × 10¹⁴ to 3 × 10¹⁶ ions/cm2. An irradiation experiment has been performed using a table-top accelerator facility at the Inter-University Accelerator Centre (IUAC), New Delhi. The base pressure during irradiation was measured to be 1 × 10⁻⁶ mbar. To assess the metal content and thickness of the coating, samples were studied via Rutherford backscattering spectroscopy (RBS) with a 2-MeV alpha particle at the IUAC, New Delhi. A solid silicon surface barrier detector was set at 165⁰ from the beam direction inside the RBS chamber. A dual-beam Hitachi U-3300 UV-Vis spectrophotometer was used to record the optical absorption spectra of samples. Veeco digital multimode scanning probe microscopy with Nanoscope IIIa in the tapping mode was used to examine sample surface morphology. The KRUSS setup was used by IUAC, New Delhi, to measure the contact angle of a water drop. Sensitive chemical detection of rhodamine has been achieved on Au surfaces excited at a laser wavelength of 532 nm using a Raman spectrophotometer at the University of Petroleum and Energy Studies (UPES), Dehradun.
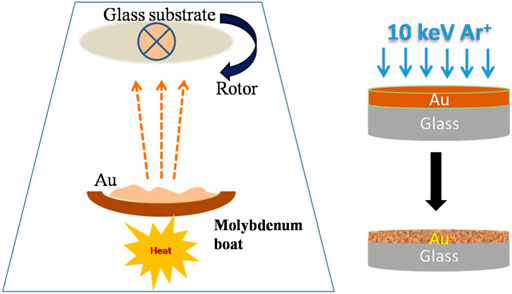
FIGURE 1. Schematic diagram of the thermal evaporation system. Nanostructuring of the Au film using 10 keV Ar+ irradiation at a normal incidence.
3 Results and discussion
3.1 Rutherford backscattering spectroscopy (RBS)
Rutherford backscattering spectroscopy (RBS) has been used to determine the film thickness and areal concentrations of the elements in pristine and ion-irradiated films. The peaks of Au and edges of Si, Ca, Na, and O, as shown in Figure 2A, correspond to Au thin films on the glass substrate (SiO2, CaCO3, and Na2CO3) at different ion fluences. Figure 2B shows the fitting of the RBS spectrum of the pristine Au thin film with SIMNRA 6.05 simulation, and the thickness of the film is found to be ∼ 5 nm, which is in close agreement with the thickness recorded by the quartz crystal monitor during deposition. Figure 2C shows the drop in the region under the RBS peak of Au caused by ion irradiation indicates a decrease in the Au concentration as the fluence of Ar+ ions increases. A standard procedure of SIMNRA simulation has been used to calculate the concentration of Au for all samples [21]. As illustrated in Figure 2D, the areal concentrations of Au in pristine and irradiated samples at different fluences are measured (from RBS spectra). The estimated concentration of Au on the surface of the glass is found to be lower at a fluence of 1×10¹⁶ ions/cm2. A decrease in the areal concentration with ion fluence demonstrates the ejection of Au atoms from the surface under sputtering [22]. A linear fitting of the areal concentration with fluence provides the average sputtering yield ∼1.97 ± 0.18 atoms/ion, which is lower than the previous findings [23]. The estimated value of sputtering yield from SRIM-2008 is found to be 7.5 atoms/ion. The lower sputtering yield of Au with the increasing fluence is attributed to the fact that for extremely thin films, such as the one used here, the metal covering area of the substrate falls with the fluence [24]. Hence, all incoming ions do not reach the metal nanostructures. This finding of lower sputtering yield in the present study is found to be well supported by the formation of isolated Au nanoparticles at higher fluences in the AFM study in the next section. The decrease in the metal content and the large exposed surface area of glass to the free surface are expected to significantly influence R6G detection by Raman spectroscopy, UV-Vis absorption characteristics, surface morphology, and wetting property, which are discussed in the following sections.
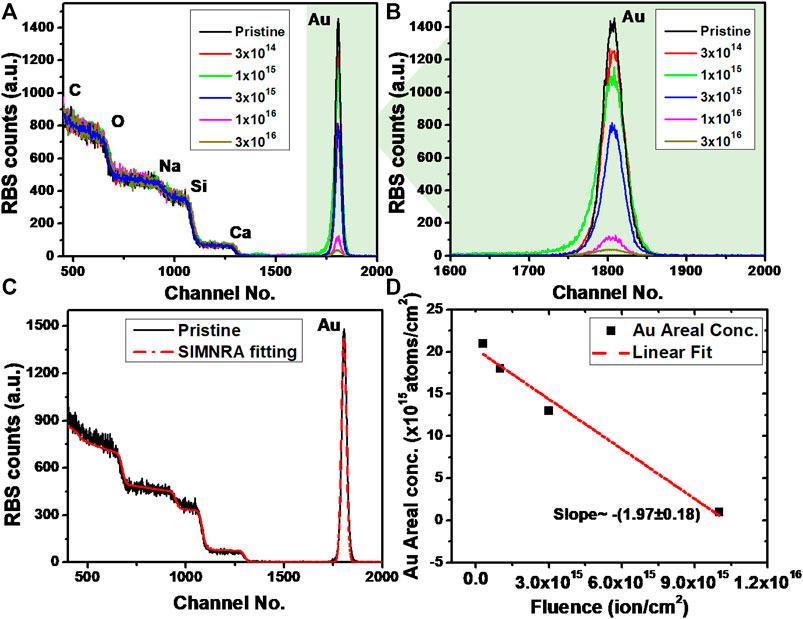
FIGURE 2. (A) RBS spectra of the as-deposited and irradiated Au films on glass substrate composition. (B) Magnified view of the Au peak. (C) SIMNRA fitting of the RBS spectrum for the as-deposited Au film. (D) Variation of the Au areal concentration with irradiation fluence confirms the sputtering of the surface.
3.2 Atomic force microscopy (AFM)
AFM micrographs of the 5-nm pristine and irradiated Au thin films at different fluences, (a) pristine, (b) 3×10¹⁴, (c) 1×10¹⁵, (d) 3×10¹⁵, (e) 1×10¹⁶, and (f) 3×10¹⁶ ions/cm2, are shown in Figure 3. The surface morphology of the pristine sample exhibits a discontinuous film composed of densely packed grains (Figure 3A), which is a characteristic for resistive heating thin film deposition. No isolated and organized nanostructures of Au are visible on the pristine sample. The existence of grains in the as-deposited Au thin film is anticipated by nucleation growth. Metal membranes occur on non-metallic surfaces after the nucleation and growth of small clusters, as described by the Volmer–Weber mode [25]. The film progresses in this manner by generating islands. Sputtering and surface dewetting influence the structural change from grains to nanostructures caused by ion beam irradiation.
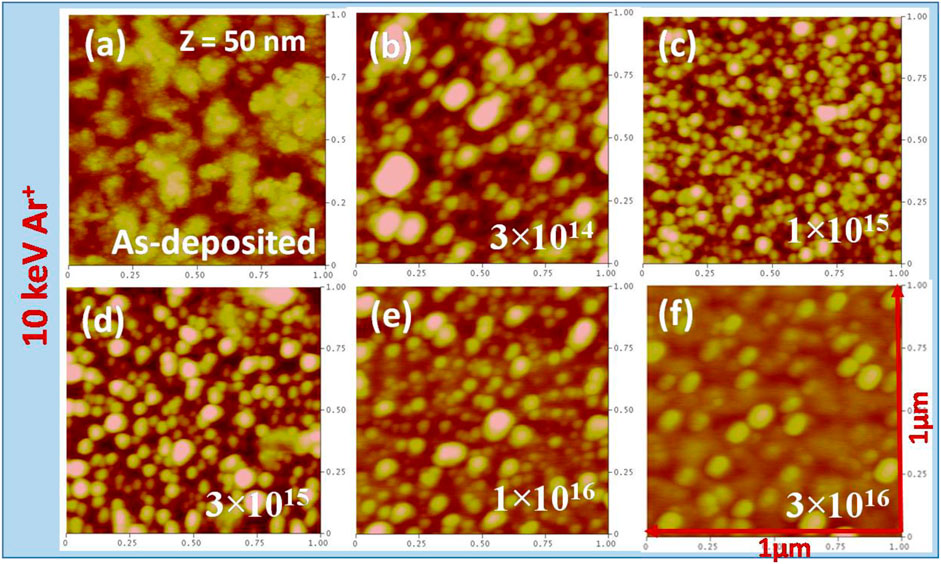
FIGURE 3. Atomic force microscopic (AFM) micrographs of:(A) as-deposited Au thin film, and (B–F) subsequently irradiated at different fluences ranging from 3×10¹⁴ to 1×10¹⁶ ions/cm2. The scale bar (z) is 50 nm for all the samples.
As shown in Figures 3B–D, irradiation with Ar+ ions causes the development of Au nanostructures (AuNS) on the surface, which become highly structured with increasing ion fluence. The ImageJ program has been used to compute the lateral size distribution of the AuNS [26], which is presented in Figure 4 of the irradiated samples. An initial ion fluence of 3×10¹⁴ ions/cm2 shows the development of the small and big sizes of AuNS with an average lateral size of 57.914 ± 2.7 nm. Further irradiation at a fluence 3×10¹⁵ ions/cm2 led to the well-arranged, uniform-sized, and overlapped Au. With a narrow spread of size distribution, AuNS are found to be ∼75.8 ± 6.6 nm for 3×10¹⁵ ions/cm2.
Furthermore, after exposure to the highest fluence of 3×10¹⁶ ions/cm2, the size distribution reduces to an average lateral size of 88.05 ± 7.8 nm. Also, the reduction in the overlapping of AuNS is found to be higher for fluence 3×10¹⁶ ions/cm2 under high sputtering of the gold content. Because approximately one-third of the metal is sputtered at the fluence of 3×10¹⁶ ions/cm2, the planner spaces of glass are primarily visible in-between isolated Au nanostructures, as observed in the AFM image of Figure 3F. A transition from overlapped-to-isolated AuNS of different sizes with increasing irradiation fluences has also been investigated using the surface fractal analysis approach in the following section.
3.3 Fractal analysis and the correlation function
A statistical index known as a fractal geometrical dimension gives information about the growth mechanisms of surface patterns. It denotes a pattern’s ability to cover the surface on which it is implanted. Self-affine surfaces have a fractal-like structure, with dimensions that depend on the roughness exponent [27, 28]. By treating the surface as the periodic arrangement of N boxes with a size of ‘ε’ each, a correlation between the fractal dimension (Df) and roughness exponents (α) may be found. To determine the roughness exponent (α) of the self-affine surfaces, the height–height correlation function (H) is a significant quantity, which is derived using the sample surfaces as follows:
This function has a lateral correlation length (ξ)-dependent coupling with the interface width as
Here, the roughness exponent (α) falls between 0 and 1 [28]. For a smooth surface, α equals 1, but a lesser number denotes a roughening of the surface. Figure 5A shows the log–log plot of H (r) function with r, which has been extracted from the AFM images of pristine and ion-irradiated Au films. It could be seen that H (r) rises linearly and follows the power scaling rule ∼ r2α for smaller values of r. In addition, the roughness exponent (α) provides information about the significant impact of sputtering and/or diffusion in surface alteration under ion irradiation. A lower value of 0.35 strongly encourages surface modification under the ion beam sputtering process. When surface diffusion dominates the surface dynamics, greater values of α are predicted, especially in the range of 0.66–1 [29, 30]. The measured values of α are presented in Table 1, confirming that the observed surface roughness and fracture development during ion irradiation are significantly influenced by surface diffusion over the sputtering.
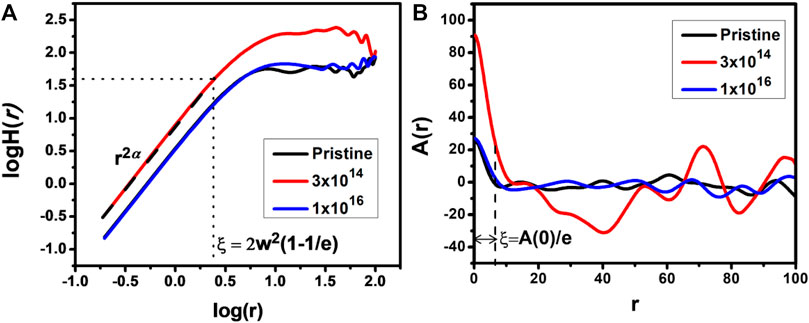
FIGURE 5. (A) Height–height correlation (H) function; and (B) auto-correlation (A), as a function of ‘r’.

TABLE 1. Roughness exponent (α), fractal dimension (Df), and correlation length (ξ) for pristine and irradiated samples.
A(r) has been used to determine lateral correlation length, whereas H(r) functions were used to estimate Df [31, 32]. Table 1 shows the computed values of αα w, α, and Df as a function of ion fluence. In Figure 5B, A(r) is shown as a function of ‘r’ for both pristine and ion-irradiated samples. Self-affinity is implied by the exponential decrease of A(r). There is a point at which the A(r) for the pristine sample falls by 1/e of its initial value. The decay rate of A(r) for irradiated Au thin films is exponential and becomes quasi-periodic after the correlation length. If two close particles on the surface are separated by ξ, their heights become correlated; otherwise, they remain independent. Recent papers apply fractal analysis to link surface patterns to sensing and wettability properties of the materials [33]. The fractal dimension (Df) has the following relationship with α, Df = d + 1-α, where d is the sample dimension, which—in the present study—is 2. Df is a measure of the surface’s complexity. Higher Df or complexity reduces a pattern’s space-filling capability. From Table 1, the higher values of Df and ξ at lower and higher fluences are owing to the higher lateral ordering of Au nanostructures.
3.4 UV-Vis study
Absorbance spectra of (1) pristine; and the irradiated gold thin films at different fluences: (2) 3×10¹⁴ ions/cm2, (3) 1×10¹⁵ ions/cm2, (4) 3×10¹⁵ ions/cm2, (5) 1×10¹⁶ ions/cm2, and (6) 3×10¹⁶ ions/cm2 are shown in Figure 6. The absorption band for the pristine samples is found to be broad and centered around ∼560 nm. The surface plasmon resonance in the as-deposited Au film is responsible for this absorption band. We could see the three changes in the surface plasmon resonance (SPR) peak of the irradiated sample: 1) peak intensity drops in the visible area, 2) peak spectral position changes toward lower wavelength, and 3) full-width at half maxima (FWHM) of the absorption peak decreases with irradiation fluence. All these three changes are governed by the decrease in the Au content (as observed in RBS) and shape reconfiguration of the produced Au nanostructures with an increase in ion fluences. The optical absorption peak of gold films is connected with the SPR of microscopic metallic structures distributed at the insulator matrix. It reaches its highest point when the inner field created by electromagnetic excitation is strong. For spherical metal nanoparticles in a non-absorbing host matrix, the maximum of the SPR peak may be approximated by using the Freöhlich equation (εm(ω) = −Kεh(ω)). Here, εm and εh are the real parts of the complex permittivity of the metal and the host medium, respectively, and K is a topological component that depends on the geometry alignment of nanostructures with electromagnetic excitement (for spheres, K = 2) [34]. Because the pristine sample has a significant red shift in the SPR peak, we conclude that it comprises non-spherical densely packed AuNS. When the shape is randomly distorted, Au/Ag nanostructures often display a red-shifted peak of pristine samples [35, 36]. However, in the present case, we observed the formation of nanoparticles distributed over the surface after irradiation. A decrease of interaction among nearby nanostructures also potentially contributes to the blue shift in absorbance. When the samples are subjected to ion beam irradiation with increasing fluence, the eccentricity of the nanostructures diminishes and K approaches the value of 2. This is why when the fluence is increased from 3 × 10¹⁴ to 3 × 10¹⁶ ions/cm2, the blue-shift in the peak of SPR was observed with a decrease in FWHM [22].
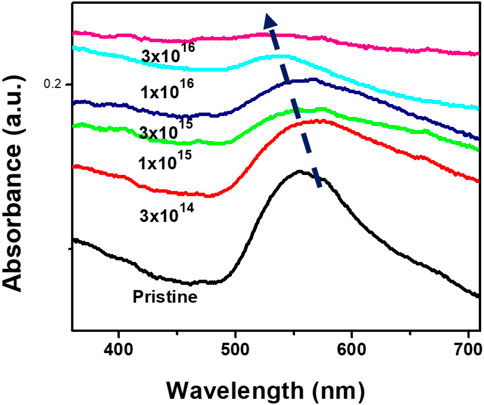
FIGURE 6. Optical absorption spectra of pristine and 10 keV Ar+-irradiated 5-nm Au on glass at different fluences.
3.5 Contact angle (CA)
The wettability of a surface is defined by the interfacial free energy per unit area at the solid–liquid (γsl), liquid–vapor (γlv), and solid–vapor (γsv) interfaces, as illustrated in Figure 7. Young demonstrates the mathematical relationship between both the contact angle (θ) and interfacial free energies [37]:

FIGURE 7. Schematic representation of the water droplet interaction with the solid surface based on Young’s equation.
If a surface has hydrophilic properties, then θ< 90˚; in this case, γsl will be smaller than γsv. Conversely, if a surface has a hydrophobic characteristic, then θ> 90˚, and γsl will be higher than γsv in certain circumstances. Wenzel [38] further demonstrated that the effective contact angle (θe) might be written as follows for rough surfaces:
where r is the roughness ratio, defined as the ratio of the solid surface’s actual area to the projected area on the reference plane [39]. For a rough surface, the effective area of a solid tends to increase by a factor of r. The relationship between a fractal dimension Df of a surface and r for a first-order approximation is given by
As a result, a surface’s contact angle may be controlled favorably by adjusting both the surface energy and the physical roughness. According to this correlation, wettable surfaces get wetter as surface roughness increases, while repellent surfaces become more repellent [39–41].
The present study uses the sessile drop method to measure the images of a water drop’s contact angle (CA) with the surface. Figure 8 displays the snapshots of all measurements. The findings suggest that the wettability of nano-structured surfaces can be modified significantly with ion treatment. The as-deposited 5-nm thin film surfaces have a somewhat hydrophilic characteristic with a contact angle of water equal to θ = 44.6. The surface composition and roughness (interface width, w) significantly affect the surface’s wettability.
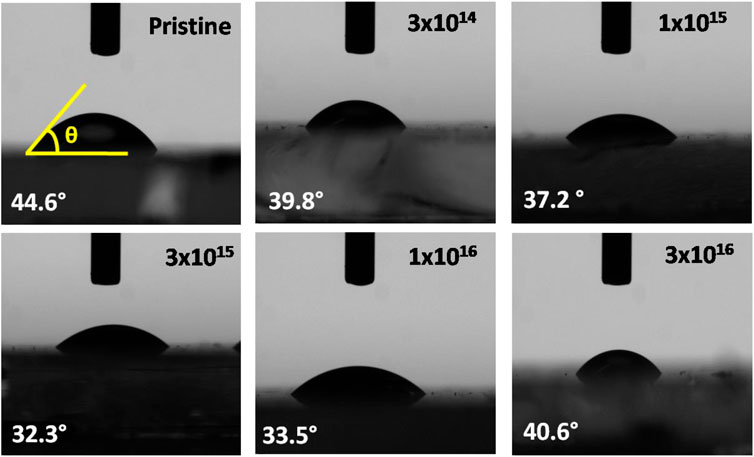
FIGURE 8. Variation in contact angles of the water droplet on pristine and irradiated surfaces at different ion fluences.
Figures 9A, B show the variation of the contact angle with fractal dimension and interface width, respectively, as a function of ion fluence. According to research by Quere [42], the interface width (roughness) should be maximized for optimal hydrophilicity. However, some reports contradict this finding with the maximum hydrophilicity at the lowest surface roughness. In the present study, the variation of the contact angle with ion fluence can be divided into to two regions, I and II, respectively. In region I, a significant decrease in CA up to 32.3 has been observed with a reduction in both ‘fractal dimension (Df)’ and “interface width” up to a fluence of 3 ×10¹⁵ ions/cm2. Df measures the complexity of the surface. The decrease in Df up to 3 ×10¹⁵ ions/cm2 is related to the higher surface coverage of gold nanoparticles with a less complicated boundary at glass substrate contacts, which dominates over the interface width factor. Hence, a decrease in unoccupied spaces across the surface favors the increase in the hydrophilic characteristic of the surface.

FIGURE 9. Correlation between the (A) contact angle of the water droplet and the fractal dimension and (B) contact angle of the water droplet with interface width and ion irradiation on the Au films at different fluences. (C) Combined effect of fractal dimension and interface width with contact angle.
The behavior of CA switches from more hydrophilic to less hydrophilic in region “II” after a critical fluence of 3×10¹⁵ ions/cm2. With the increase in ion fluence after the critical fluence, the interface width (w) has decreased from 6.7 nm to 2.8 nm, although the CA of the treated films exhibited a modest rise up to 36.1 at the dose of 1 × 10¹⁶ ions/cm2. The significant increase in CA after a critical fluence is attributed to the wettable surfaces becoming less wettable as interface width decreases as proposed in the Wenzel model. Additionally, the fractal dimension (Df) favors the rise in CA due to the appearance of vacant spaces in-between isolated gold nanoparticles, as observed in the AFM images. The direct appearance of dangling bonds in glass regions and more complex boundaries of Au glass (higher Df) results in an increase in water droplet’s contact angles.
In this work, a correlation between wettability and fractal parameters (Df and w) has been established as
(a) When low-energy ions hit a thin film on a substrate, target atoms can get sputtered from the surface. Ion-induced sputtering reduces the film thicknesses and creates nanostructures. The substrate glass area that is not covered by the Au film is additionally sputtered and roughened. The contact angle is affected by both nanostructures and roughened surfaces.
(b) When two materials are on the surface, their contact angles are determined by their relative areas and contact angles [43]. In this scenario, the Au coverage area on the glass substrate decreases with the ion fluence, affecting the contact angle.
(c) Ion irradiation produces surface dangling bonds. After irradiation, exposure to air causes the production of -OH and -O dangling bonds at the free surface, which influences the contact angle [44].
The present study of contact angle measurements and their dependency on fractal dimensions and interface width can potentially be useful in the detection of R6G in water, which has been discussed in the following section.
3.6 Detection of R6G using Raman measurements
Figure 10 shows the Raman spectra of rhodamine (R6G) on (a) glass and (b) pristine (as-deposited) gold films for different R6G molar concentrations of 0.005, 0.05, and 0.1 mM, respectively. AuNS are thought to make hot sites for SERS detection of R6G. Although there is an absence of Au on the bared glass surfaces, almost a very low R6G Raman signal has been observed for all concentrations of R6G, as shown in Figure 10A. For the pristine 5-nm gold film, the Au concentration on the glass is spread out compared to nanostructured Au films and hence provides a lower number of “hot spots” to boost SERS [45]. When the as-deposited gold film was used as SERS substrates to detect R6B, significant Raman peaks at 612 cm−1, 774 cm−1, 1,089 cm−1, 1,186 cm−1, 1,364 cm−1, 1,509 cm−1, 1,574 cm−1, and 1,647 cm−1 were observed with good agreement to previous studies [46], as shown in Figure 10B. An increase in Raman intensity is evident with an increase in the concentration from 0.005 to 0.1 mM due to the enhanced interaction of R6G with active sites.
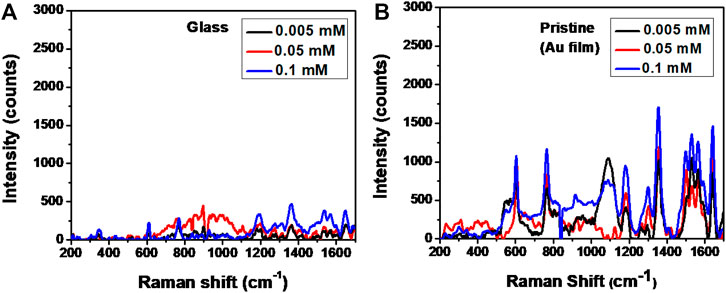
FIGURE 10. Raman spectra of rhodamine-6G(R6G) on (A) glass and (B) pristine (as-deposited) gold films.
The Raman signal can only be strongly boosted up where the AuNS have more clusters. A uniform AuNS distribution could help metal nanoparticles stick together better and make a better SERS R6G detection. Therefore, to achieve higher SERS enhancement, the uniform AuNS distribution has been acquired by 10 keV Ar+ irradiation for the fluence ranging from 3×10¹⁴ ions/cm2 to 3×10¹⁶ ions/cm2 ion/cm2, as shown in Figures 11A–F. For all samples, it could be seen that a rise in Raman intensity is visible with the increase in the concentration of R6G from 0.005 mM to 0.1 mM due to more interactions of R6G with Au. Also, a rise in relative intensity of Raman peaks has been observed up to the fluence of 3×10¹⁵ ions/cm2, up to which the increase in the uniformity of AuNS is observed with a higher interface width and lower wettability of surface with water.
After the critical fluence of 3×10¹⁵ ions/cm2, R6G SERS intensity is relatively found to be decreased due to the higher sputtering of Au atoms, resulting in isolated AuNS. In general, SERS intensity may be represented as I (t, θ) = C(t)I(θ), where C(t) is the optical force’s effective coefficient and I(θ) is the polarization-driven Raman intensity [47]. As the AuNS are dispersed throughout the surface with varying interparticle distances, the average effect of the optical force may be C(t)=(1/d)β, where β = 4 and d is the effective interparticle distance. With the increase in the value of “d” with the irradiation fluence from 3×10¹⁵ ions/cm2 to 3×10¹⁶ ions/cm2, as could be seen in AFM images, the contribution of C(t) in Raman intensity is decreased. Recently, Dapeng Xu et al. [48] have studied the SERS detection of rhodamine B as a function of nanoscale roughness and fractal dimension. A higher fractal dimension due to macroscopic dendritic structures of AuNP/AgNW composites has also been proposed to achieve high SERS detection of rhodamine B. The limit of detection (LOD) is also an important parameter defined as the lowest concentration of an analyte in a sample that can be detected consistently with a specified probability (usually 95% confidence). As an example, a zoom SERS spectrum for the fluence of 1×10¹⁶ ions/cm2 is shown in Figure 11F, which can help estimate the LOD. Figure 12 shows the variation of LOD for a peak of 1,186 cm−1 of irradiated samples with surface statistical parameters (w, Df), water contact angle (θ), and Au concentration as a function of the ion fluence. It could be seen that a lower water contact angle (θ) and fractal dimension (Df), and higher interface width (w) and Au concentration help the adherence of R6G to Au-NS and hence a better LOD at a fluence of 3×10¹⁵ ions/cm2. Thus, it is evident that the increase in the contact angle and lower Au concentration with increasing Ar+ ion irradiation after 3×10¹⁵ ions/cm2 results in a higher LOD for R6G. It is observed that a uniform AuNS distribution with a lower water contact angle (θ) along with a higher w value favors the interaction of R6G with hot-spots of AuNS and enhances its sensitive detection. Therefore, the present findings have important implications for developing chemical nanodevices for reliable trace detection technologies.
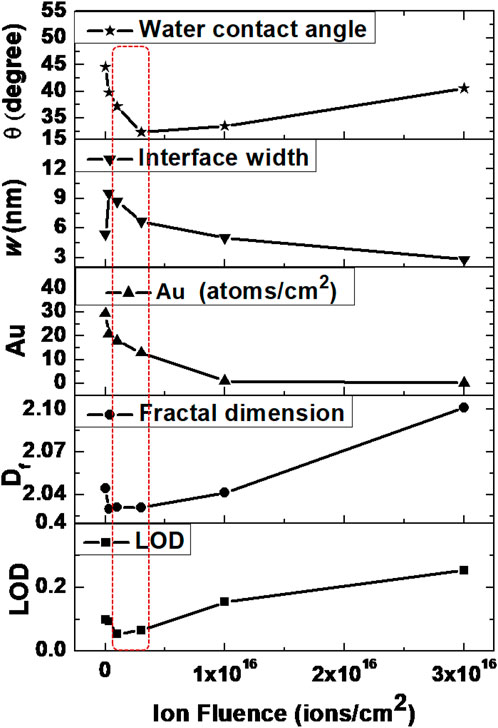
FIGURE 12. Comparison of the LOD of R6G on ion-irradiated Au surfaces for different surface statistical parameters and Au concentrations.
4 Summary
We report on the increased SERS detection of R-6G on AuNS of various lateral sizes under ion beam irradiation. Atomic force microscopy measurements demonstrate that the size and separation of AuNS vary as a function of ion fluence. Sputtering and diffusion processes are identified to regulate the formation of AuNS on a glass substrate under ion irradiation. The average size of AuNS is observed to be dependent on statistical fractal dimension analysis. The formation of AuNS caused by the decrease in Au content under ion irradiation is confirmed by RBS. SPR of as-deposited and irradiated samples indicates a change in resonance peak depending on the concentration of Au. The improved SERS detection of R-6G is facilitated by a higher surface coverage area of AuNS, which is in conjunction with reduced fractal dimensions and a water contact angle. The current research study provides a novel understanding of SERS chemical detection underlying mechanism(s) for a broader class of roughened metallic surfaces.
Data availability statement
The raw data supporting the conclusion of this article will be made available by the authors, without undue reservation.
Author contributions
PJ and TK planned the experiment and performed it with RK and BP at IUAC, New Delhi. TK performed the AFM and contact angle measurement and analysis. PB and AV performed the Raman characterization and analysis. All authors contributed to the article and approved the submitted version.
Acknowledgments
The authors would like to thank Dr. Vinay Kumar, Central University of Jammu (CUJ), for his unwavering support; Mr. Raj Kumar, IUAC, New Delhi, for allowing tabletop accelerator use; and Satish Dhawan Space Center facility, CUJ, for characterization facilities.
Conflict of interest
The authors declare that the research was conducted in the absence of any commercial or financial relationships that could be construed as a potential conflict of interest.
The handling editor IS declared a past co-authorship with the author TK.
Publisher’s note
All claims expressed in this article are solely those of the authors and do not necessarily represent those of their affiliated organizations, or those of the publisher, the editors, and the reviewers. Any product that may be evaluated in this article, or claim that may be made by its manufacturer, is not guaranteed or endorsed by the publisher.
References
1. Nyarugwe SP, Linnemann AR, Luning PA. Prevailing food safety culture in companies operating in a transition economy-Does product riskiness matter? Food Control (2020) 107:106803. doi:10.1016/j.foodcont.2019.106803
2. Nardi VAM, Teixeira R, Ladeira WJ, de Oliveira Santini F. A meta-analytic review of food safety risk perception. Food Control (2020) 112:107089. doi:10.1016/j.foodcont.2020.107089
3. Wu ST, Hammons SR, Silver R, Neal JA, Oliver HF. Retail deli managers and associates have better food safety culture in stores with lower Listeria monocytogenes contamination. Food Control (2020) 110:106983. doi:10.1016/j.foodcont.2019.106983
4. Gupta S, Banaszak A. Detection of DNA bases and environmentally relevant biomolecules and monitoring ssDNA hybridization by noble metal nanoparticles decorated graphene nanosheets as ultrasensitive G-SERS platforms. J Raman Spectrosc (2021) 52:930–48. doi:10.1002/jrs.6087
5. Song L, Chen J, Xu BB, Huang Y. Flexible plasmonic biosensors for healthcare monitoring: Progress and prospects. ACS nano (2021) 15:18822–47. doi:10.1021/acsnano.1c07176
6. Prakash J, Sun S, Swart HC, Gupta RK. Noble metals-TiO2 nanocomposites: From fundamental mechanisms to photocatalysis, surface enhanced Raman scattering and antibacterial applications. Appl Mater Today (2018) 11:82–135. doi:10.1016/j.apmt.2018.02.002
7. Augustine S, Saini M, Sooraj K, Parida BK, Hans S, Pachchigar V, et al. Au/Ag SERS active substrate for broader wavelength excitation. Opt Mater (2023) 135:113319. doi:10.1016/j.optmat.2022.113319
8. Saini M, Augustine S, Ranjan M, Som T. In-plane optical anisotropy and SERS detection efficiency of self-organized gold nanoparticles on silicon nanoripples: Roles of growth angle and postgrowth annealing. Appl Surf Sci (2020) 512:145703. doi:10.1016/j.apsusc.2020.145703
9. Kreibig U, Vollmer M. Optical properties of metal clusters. Springer Science & Business Media (2013).
10. Munoz-Garcia J, Vazquez L, Castro M, Gago R, Redondo-Cubero A, Moreno-Barrado A, et al. Self-organized nanopatterning of silicon surfaces by ion beam sputtering. Mater Sci Eng R: Rep (2014) 86:1–44. doi:10.1016/j.mser.2014.09.001
11. Sulania I, Avasthi D, Tripathi A, Hussain M. Nanopattern Formation on indium phosphide using energetic ions: An overview with various ion beam parameters. ECS Trans (2022) 107:3107–16. doi:10.1149/10701.3107ecst
12. Sulania I, Agarwal D, Husain M, Avasthi DK. Investigations of ripple pattern formation on Germanium surfaces using 100-keV Ar+ ions. Nanoscale Res Lett (2015) 10:88–8. doi:10.1186/s11671-015-0751-4
13. Sulania I, Dk Avasthi M, Agarwal D, Kumar M. Low energy bombardment induced formation of Ge nanoparticles. Adv Mater Lett (2013) 4:402–7. doi:10.5185/amlett.2012.ib.103
14. Bradley RM, Harper JM. Theory of ripple topography induced by ion bombardment. J Vacuum Sci Tech A: Vacuum, Surf Films (1988) 6:2390–5. doi:10.1116/1.575561
15. Robinson MT, Torrens IM. Computer simulation of atomic-displacement cascades in solids in the binary-collision approximation. Phys Rev B (1974) 9:5008–24. doi:10.1103/physrevb.9.5008
16. Sigmund P. Theory of sputtering. I. Sputtering yield of amorphous and polycrystalline targets. Phys Rev (1969) 184:768. doi:10.1103/physrev.187.768
17. Cuerno R, Barabási A-L. Dynamic scaling of ion-sputtered surfaces. Phys Rev Lett (1995) 74:4746–9. doi:10.1103/physrevlett.74.4746
18. Pandey RK, Kumar M, Kumar T, Yadav AC, Singh UB, Khan SA, et al. Dynamic scaling of swift heavy ion induced surface restructuring of BaF2 thin film. Mater Lett (2015) 143:309–11. doi:10.1016/j.matlet.2014.12.131
20. Durán IR, Laroche G. Water drop-surface interactions as the basis for the design of anti-fogging surfaces: Theory, practice, and applications trends. Adv Colloid Interf Sci (2019) 263:68–94. doi:10.1016/j.cis.2018.11.005
22. Singh UB, Agarwal D, Khan S, Kumar M, Tripathi A, Singhal R, et al. Engineering of hydrophilic and plasmonic properties of Ag thin film by atom beam irradiation. Appl Surf Sci (2011) 258:1464–9. doi:10.1016/j.apsusc.2011.09.105
23. Singh UB, Yadav R, Kumar R, Ojha S, Mittal A, Ghosh S, et al. Nanostructuring and wettability of ion treated Au thin films. J Appl Phys (2017) 122:185303. doi:10.1063/1.4995542
24. Kumar M, Pandey RK, Pathak S, Ojha S, Kumar T, Kumar R, et al. Surface engineering of Pt thin films by low energy heavy ion irradiation. Appl Surf Sci (2021) 540:148338. doi:10.1016/j.apsusc.2020.148338
26. Abràmoff MD, Magalhães PJ, Ram SJ. Image processing with ImageJ. Biophotonics Int (2004) 11:36–42.
27. Mandelbrot BB. Self-affine fractal sets, I: The basic fractal dimensions. In: Fractals in physics. Elsevier (1986). p. 3–15.
29. Eklund EA, Bruinsma R, Rudnick J, Williams RS. Submicron-scale surface roughening induced by ion bombardment. Phys Rev Lett (1991) 67:1759–62. doi:10.1103/physrevlett.67.1759
30. Kardar M, Parisi G, Zhang Y-C. Dynamic scaling of growing interfaces. Phys Rev Lett (1986) 56:889–92. doi:10.1103/physrevlett.56.889
31. Bottiglione F, Carbone G, Persson BN. Fluid contact angle on solid surfaces: Role of multiscale surface roughness. J Chem Phys (2015) 143:134705. doi:10.1063/1.4932104
32. Yadav R, Dwivedi S, Mittal A, Kumar M, Pandey A. Fractal and multifractal analysis of LiF thin film surface. Appl Surf Sci (2012) 261:547–53. doi:10.1016/j.apsusc.2012.08.053
33. Ghosh K, Pandey R. Fractal assessment of ZnO thin films using Higuchi’s algorithm. In: AIP conference proceedings. New York, USA: AIP Publishing LLC (2019). p. 030280.
34. Foss CA, Hornyak GL, Stockert JA, Martin CR. Template-synthesized nanoscopic gold particles: Optical spectra and the effects of particle size and shape. J Phys Chem (1994) 98:2963–71. doi:10.1021/j100062a037
35. Xia Y, Halas NJ. Shape-controlled synthesis and surface plasmonic properties of metallic nanostructures. MRS Bull (2005) 30:338–48. doi:10.1557/mrs2005.96
36. Ranjan M, Oates TW, Facsko S, Mller W. Optical properties of silver nanowire arrays with 35 nm periodicity. Opt Lett (2010) 35:2576–8. doi:10.1364/ol.35.002576
37. Young T. An essay on the cohesion of fluids. London: Philosophical transactions of the royal society of London (1805). p. 65–87.
38. R.N. Wenzel . Surface roughness and contact angle. J Phys Chem (1949) 53:1466–7. doi:10.1021/j150474a015
39. Yang RY, Chang LC, Hsu JC, Weng BB, Palada MC, Chadha M, et al. Nutritional and functional properties of Moringa leaves–From germplasm, to plant, to food, to health In: Moringa leaves: Strategies, standards and markets for a better impact on nutrition in Africa. Paris: Moringanews, CDE, CTA, GFU (2006). p. 1–9.
40. Yadav R, Kumar T, Baranwal V, Vandana , Kumar M, Priya P, et al. Fractal characterization and wettability of ion treated silicon surfaces. J Appl Phys (2017) 121:055301. doi:10.1063/1.4975115
41. Sulania I, Kumar P, Priya P, Bhasker H, Singh U, Karn RK, et al. formation of self-organized nano-dimensional structures on InP surfaces using ion irradiation and their wettability: A study based on experimental and theoretical concepts of surface. Radiat Phys Chem (2022) 199:110353. doi:10.1016/j.radphyschem.2022.110353
42. Quéré D. Rough ideas on wetting. Physica A: Stat Mech its Appl (2002) 313:32–46. doi:10.1016/s0378-4371(02)01033-6
43. Lundgren M, Allan NL, Cosgrove T. Modeling of wetting: A study of nanowetting at rough and heterogeneous surfaces. Langmuir (2007) 23:1187–94. doi:10.1021/la060712o
44. Vijay Y, Dhayal M, Awasthi K, Kulshrestha V, Acharya N, Choi J. Surface modification and synthesis of polymeric membrane for energy and biological applications. J Biomed Nanotechnology (2006) 2:144–51. doi:10.1166/jbn.2006.026
45. Le Ru E, Etchegoin P. Principles of surface-enhanced Raman spectroscopy: And related plasmonic effects. Elsevier (2008).
46. Huang Y, Ferhan AR, Cho S-J, Lee H, Kim D-H. Gold nanowire bundles grown radially outward from silicon micropillars. ACS Appl Mater Inter (2015) 7:17582–6. doi:10.1021/acsami.5b05161
47. Chen J., Mårtensson T, Dick KA, Deppert K, Xu H, Samuelson L, et al. Surface-enhanced Raman scattering of rhodamine 6G on nanowire arrays decorated with gold nanoparticles. Nanotechnology (2008) 19:275712. doi:10.1088/0957-4484/19/27/275712
Keywords: ion beam, sputtering, SERS, rhodamine-6G (R6G), atomic force microscopy (AFM)
Citation: Jasrotia P, Priya B, Kumar R, Bishnoi P, vij A and Kumar T (2023) A correlation between fractal growth, water contact angle, and SERS intensity of R6G on ion beam nanostructured ultra-thin gold (Au) films. Front. Phys. 11:1125004. doi: 10.3389/fphy.2023.1125004
Received: 15 December 2022; Accepted: 15 February 2023;
Published: 13 March 2023.
Edited by:
Indra Sulania, Inter-University Accelerator Centre (IUAC), IndiaReviewed by:
Mukesh Ranjan, Institute for Plasma Research (IPR), IndiaRam Pratap Yadav, University of Allahabad, India
Copyright © 2023 Jasrotia, Priya, Kumar, Bishnoi, vij and Kumar. This is an open-access article distributed under the terms of the Creative Commons Attribution License (CC BY). The use, distribution or reproduction in other forums is permitted, provided the original author(s) and the copyright owner(s) are credited and that the original publication in this journal is cited, in accordance with accepted academic practice. No use, distribution or reproduction is permitted which does not comply with these terms.
*Correspondence: Tanuj Kumar, dGFudWoubnNtQGN1amFtbXUuYWMuaW4=
 Priya Jasrotia1
 Tanuj Kumar
