 Muhammad Shiddiq Sayyid Hashuro
 Kotaro Daibo4
 Makoto Ohta
- 1Institute of Fluid Science, Tohoku University, Sendai, Miyagi, Japan
- 2Graduate School of Engineering, Tohoku University, Sendai, Miyagi, Japan
- 3Biomedical Engineering Department, School of Electrical Engineering and Informatics, Institut Teknologi Bandung, Bandung, Indonesia
- 4Graduate School of Biomedical Engineering, Tohoku University, Sendai, Miyagi, Japan
- 5Frontier Research Institute for Interdisciplinary Sciences, Tohoku University, Sendai, Miyagi, Japan
- 6Biomedical Engineering Department, Tohoku University, Sendai, Miyagi, Japan
Detecting abnormal blood flow is possible through transcranial Doppler (TCD) ultrasound by measuring blood velocity in cerebral arteries. Velocity measurements are at the highest precision when the direction of blood flow coincides with the ultrasound beam. However, because TCD is typically performed blindly (i.e., without a B-mode), a 0° interrogation angle is usually assumed. This leads to a common issue of angular mismatch. This study quantitatively shows the angular mismatch effects on the measured velocities using a TCD ultrasound flow phantom compared with the velocities measured by optical particle image velocimetry (PIV) as control. Resulting errors with and without ultrasound machine angular correction were also considered. An ultrasound phantom developed by combining polyvinyl alcohol hydrogel (PVA-H), quartz glass as a scatterer, and a gypsum plate as a skull bone was utilized to approximate the middle cerebral artery TCD measurement from the temporal window. The PVA-H and quartz glass compositions were controlled to achieve transparency and enable PIV velocity measurement. Then, TCD velocity measurement was conducted on several interrogation and mismatch angles. Comparison results revealed that without an ultrasound machine angle correction, all measurements yielded underestimation with 73.9% at the highest in the 80° interrogation window at the 130 mL/min flow. On the other hand, with the correction, the errors in almost all angles were comparatively lower; however, at 80° at the 124 mL/min flow, a maximum overestimation rate of 113.7% was found, showing a larger error magnitude. Therefore, we find that angular mismatch, especially in larger angles, leads to inaccurate velocity measurements in TCD. Our results suggest that despite angle correction, velocity errors may still occur when the interrogation angle changes.
1 Introduction
Transcranial Doppler (TCD) ultrasound is a non-invasive method used in measuring blood velocity intracranially. TCD is usually performed blindly in the absence of B-mode or color flow mode superimposed simultaneously, and diagnosing some diseases is possible by observing the measured velocities [1]. TCD is performed from the outer surface of the skull and can only be conducted from a few positions on the skull because of its acoustic properties and non-uniform thickness.
TCD is also affected by the interrogation angle like other Doppler examinations. The angle shows the ultrasound beam inclination to the blood velocity direction in the vessels. Strictly speaking, a 0° interrogation angle is desirable in Doppler measurements; else, angle correction must take place due to the fact that Doppler measurements only pick up movements that are in line with the ultrasound beam (either toward or away from the beam). Because the examiner may change the interrogation angle, angle correction may insufficiently lessen the error. Hence, angular mismatch potentially affects velocity measurements.
Transcranial duplex sonography may provide better visualization due to its simultaneous color and spectral Doppler analysis. Therefore, angular correction can be performed during visible angular mismatch. In addition, during Doppler interrogation, the examiner may slightly change the angle even after corrections. Velocity measurement related to angular mismatch in a realistic setup will determine the approximate angular mismatch effect on the measured velocity.
Interrogation windows are skull surface locations where an ultrasound signal is available for Doppler measurement. The temporal or transtemporal interrogation windows are commonly used for middle cerebral artery (MCA) Doppler assessment. The window is positioned just beside our eyes toward the sides of our head (i.e., the temple). Blood velocity measurement in the MCA may help medical doctors diagnose multiple diseases such as stroke probability in children with sickle cell disease [2], traumatic brain injuries [3], and stenosis [4].
Blind TCD is usually used in the MCA Doppler interrogation from the temporal window. One study demonstrated that angular mismatch during blind TCD measurement may occur [5]. Typically, the angular mismatch cannot be seen by the TCD operator because of TCD’s visual unavailability from the temporal window. This leads to possible inaccurate velocity values reported by the TCD examiner, resulting in misinformed diagnosis.
For example, in stroke prevention in sickle cell disease, the obtained MCA velocity values through blind TCD were used as bases in categorizing patients according to their corresponding severity levels [2]. In this setup, blind TCD typically assumes a 0° MCA interrogation angle from the temporal window. Thus, no angle correction is necessary. In this same study, approximately 18% of the measured velocity may change the patient’s actual category, thus changing patient treatment. Hence, whether changes in the measured velocity may lie within the errors produced by the angular vessel mismatch is a topic that warrants further investigation.
Similar to MCA velocity values acquired through blind TCD, flow phantoms are also used in analyzing velocities in in vitro setups. Technicians and doctors use flow phantoms in acquiring supporting data for real-life Doppler procedures. Few flow phantoms are being researched in a TCD setup, and this is especially due to their ability to accurately show velocity measurement errors. Unfortunately, these flow phantoms that can validate flow velocities in a TCD setup are not available commercially.
Moreover, particle image velocimetry (PIV) is a velocity measurement method that is typically tailored to measure fluids. In general, seed particle tracers are mixed into the fluid and are traced using high-frame rate cameras. PIV is ideally used in blood vessel models due to its quite good agreement with theoretical values [6, 7]. Despite its accuracy, PIV is incompatible with ultrasound phantoms due to its need for transparency in the particle recording part, because ultrasound phantoms are usually not transparent enough for particle tracings due to the characteristic of the agar materials and the addition of scatterers. Nevertheless, TCD and PIV may complement each other as a validation system for velocity measurement in an in vitro environment such as in a flow phantom.
Polyvinyl alcohol hydrogel (PVA-H) is a hydrogel type that can be used to mimic blood vessels [8] and is highly transparent, making it suitable for optical-based measurements. PVA-H is also sonolucent and is thus compatible as an ultrasound phantom [9]. By adding scatterers to PVA-H, an ultrasound phantom with similar tissue visuals can be manufactured [7]. PVA-H softness can be controlled by changing the PVA powder concentration in the solvent. Multiple softness variations can be used in a single phantom to simulate real-life conditions, e.g., brain tissue surrounding blood vessels. A TCD setup can be approximated by placing a gypsum material between the PVA-H phantom and the ultrasound probe.
This study is aimed at investigating the effect of angular mismatch TCD measurements by utilizing a flow phantom derived from PVA-H and gypsum to approximate a TCD measurement and to compare the measured velocities with a PIV measurement.
2 Materials and methods
2.1 Phantom manufacturing
The phantom used in this study was made of PVA-H with scatterer particles and gypsum (R’Tech, Japan).
2.1.1 Scatterer
We used quartz glass (Daico MFG Co., Ltd., Japan) as the phantom scatterer material in the experiments. PVA-H refractive index (RI) was matched to the glass RI [7]. By using sodium iodide (NaI) solution and a checkered pattern, the RI of the glass was first acquired. The RI of the NaI solution was modified systematically by modifying its concentration at the range of 1.45–1.51 with a 0.005 resolution [10]. Then, the glass was submerged into the NaI solution. A matched condition with an undisturbed pattern will be visible to the observer through the NaI solution and the submerged glass. Once the RI of the glass was identified, the NaI concentration in the solution during the matched condition was recorded. The same solution was replicated to find the concentration of the PVA in the PVA-H and the ratio of water and DMSO in the solvent of the PVA-H. The same NaI solution and pattern were used while the concentration of the PVA in the PVA-H and the ratio of water and DMSO in the solvent of the PVA-H were changed.
2.1.2 PVA-H
PVA-H was prepared using a solvent and PVA powder (Japan Vam and Poval Co., Ltd., Japan) [11, 12]. The solvent consisted of dimethyl sulfoxide (DMSO) and water. The PVA powder and a scatterer were mixed into the solvent, and both were heated to 135°C for 2 h while being stirred. The phantom consisted of two parts: an internal tubular channel and a surrounding tissue. The tubular channel was manufactured using the PVA powder (11.5 mass%) and DMSO and water at a 3:1 ratio. The surrounding tissue consisted of PVA powder (5 mass%) and DMSO and water at a 4:1 ratio. After heating and stirring for 2 h, the mixture was placed in a vacuum oven for degassing for another 2 h. The mixture was then placed into a mold. For the tubular channel, the mold was an acrylic pipe with a 4-mm inner diameter. A 4-mm stainless steel rod was inserted. The stainless steel rod was then carefully positioned in the middle of the acrylic pipe by a special connector on each end of the acrylic pipe. The PVA mixture was carefully inserted into the volume between the inner acrylic wall and the stainless steel rod. Both ends of the acrylic pipe were shut, and the molded PVA-H was cooled in a refrigerator at −35°C for 24 h.
Then, the resulting tubular PVA-H was cut to 180 mm. The tube was then placed into an acrylic box (50 mm × 50 mm × 150 mm), connecting the two sides of the box. Each end of the tube was secured into a channel connector in the acrylic box wall using a rubber band. Then, the surrounding tissue PVA-H mixture was placed into the acrylic box and placed into the refrigerator for another 24 h. The phantom was then thawed and ready to be used. Finally, the phantom consisted of a straight PVA-H tube surrounded by softer PVA-H inside the acrylic box. A gypsum plate was placed between the probe and the PVA-H to mimic the skull in a TCD setup.
2.1.3 Gypsum
A 4.07-mm-thick gypsum plate was used to mimic a skull bone [13].
2.2 Working fluids
Separate fluids were used for the PIV and Doppler measurements. For the PIV, a mixture of sodium iodide (NaI) and glycerin (C3H8O3) solutions was used. The mixture provides the adjustable transparency needed for the PIV measurements. The mixture of both solutions provides the viscosity (which was contributed more by glycerin) and density (by NaI) closer to those of blood characteristics [10]. The NaI and glycerin concentrations in the resulting liquid were set to 0.35 and 0.65, respectively, to match the RI of PVA-H and the quartz glass. Working fluid RI was 1.4558, working fluid density was 1,418 kg/m3, and the dynamic viscosity was 7.4 mPa·s. Tracking particles (Kanomax, Japan) were mixed into the resulting liquid. The particles excite 550 nm and emit 580 nm of wavelengths; they absorb the green shade laser and reflect orange shade color, which results in cleaner PIV images. For the Doppler measurement, a commercial blood mimicking Doppler fluid was used (CIRS, United States).
2.3 Acoustic measurements
Sound velocity and attenuation were measured for tissue specimens using an insertion method. A reflective plate from aluminum was placed under the specimen. An ultrasound probe acted as a transmitter and receiver. For the sound velocity measurement, the time needed for the first reflected signal was measured. For attenuation, measurement was performed for each specimen and water, and tissue specimens were 13 mm thick. We used a research ultrasound machine (Verasonics, United States) for the measurements using an L11-5v probe and 9 MHz center frequency (see Figure 1 for the schematic of the probe and the specimen). For the sound velocity, we used the time needed for the reflected signal to arrive and twice the specimen thickness.
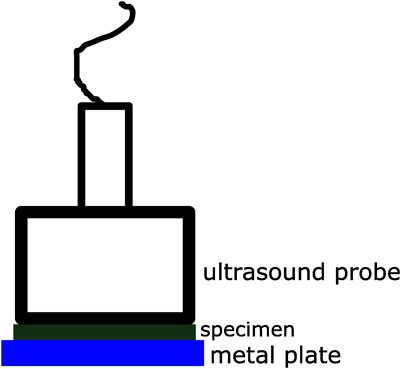
FIGURE 1. Schematic of the ultrasound probe, specimen, and metal plate during acoustic experiment.
For the attenuation, multiple successive reflections were recorded between the probe and aluminum plate. The reflected signals became weaker for each successive reflection. Lower signal values were converted into a logarithmic scale and were plotted, and a trendline was fitted for each specimen. The trendline slope was the attenuation. Calculation was performed for all tissue specimens and the gypsum plate (αspecimen+system). Another measurement was also performed for pure water (αwater+system), replacing the corresponding specimen volume. The attenuation of water (αwater) was set to 0.02 dB/cm/MHz [14]. Each specimen’s attenuation was calculated using Equation 1:
2.4 Flow measurements
2.4.1 Theoretical equation
The PIV measurement results were compared to the values acquired from calculating the Hagen-Poiseuille theoretical equation or laminar flow through a pipe of uniform circular cross-section. Velocity equation u in the position of r in diameter R in the pipe is as follows [15]:
where
and
which means that
where
2.4.2 PIV measurement
The PIV system acts as the control to which we compare the measurement results. The PIV system [6] consisted of a circulation system, a 532-nm laser sheet (B&W Tek, United States), and a camera (Photron, Japan) (Figure 2). A pump (Fuyo, Japan) was used as a flow source. The circulation system used a 4-mm acrylic tube as the main channel. The phantom was connected in the middle of the circulation system. Connected before and after the phantom were two pressure sensors (Keyence, Japan) and two flow meters (Keyence, Japan), with one pressure sensor and one flow meter on each phantom end (Figure 3). We tested two steady flow rates in the experiments: 124 and 130 mL/min. The pressure in the phantom outlet was set to 14 KPa. The camera was set to capture 1000 FPS on a 1,024 × 1,024 pixel resolution. PIVLAB toolbox [16] in MATLAB (MATLAB, United States) environment was used. A multiple ensemble correlation method with 64 × 64 pixel and 32 × 32 pixel interrogation windows with 50% window shift was used.
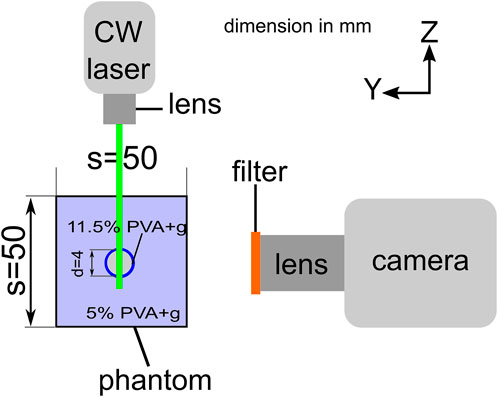
FIGURE 2. Camera and laser configuration for PIV measurement.
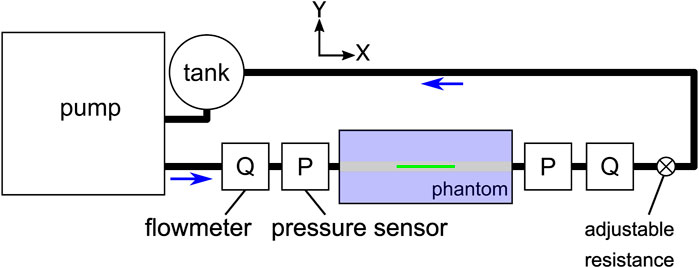
FIGURE 3. Circulation configuration for PIV measurement.
2.5 Doppler measurement
The circulation system of the Doppler measurement was similar to the PIV system circulation, only without a laser and cameras. A medical ultrasound (Canon, Japan) system with a 1–5 MHz probe was used. 2 MHz center frequency was used. The depth of the channel from the probe was between 3 and 6 cm. The sample volume was set to be 5 mm wide. The gypsum plate (Figure 4) was attached immediately to the probe and positioned at an angle relative to the channel. To compensate for the horizontal surface, some ultrasound gel was put between the gypsum and the gel surface to fill the gap. Five interrogation angles were employed for the experiments. For each angle, the maximum velocity was measured to be compared with PIV measurements. The best performing angle was further investigated by adding angular mismatches in 10° step towards both larger and smaller angles. The measured maximum velocities were again compared with the PIV measurements. Figure 5 shows the schematic of the phantom and Figure 6 shows the setup.
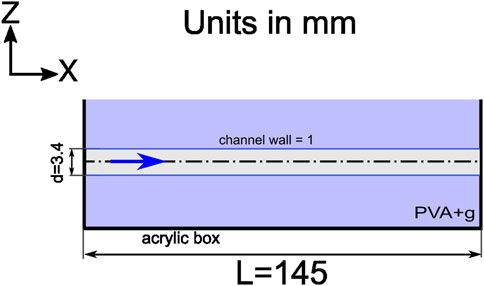
FIGURE 4. A schematic of the phantom in the study.
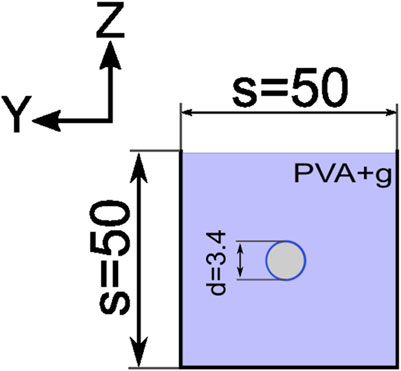
FIGURE 5. An image of the gypsum plate in the study.
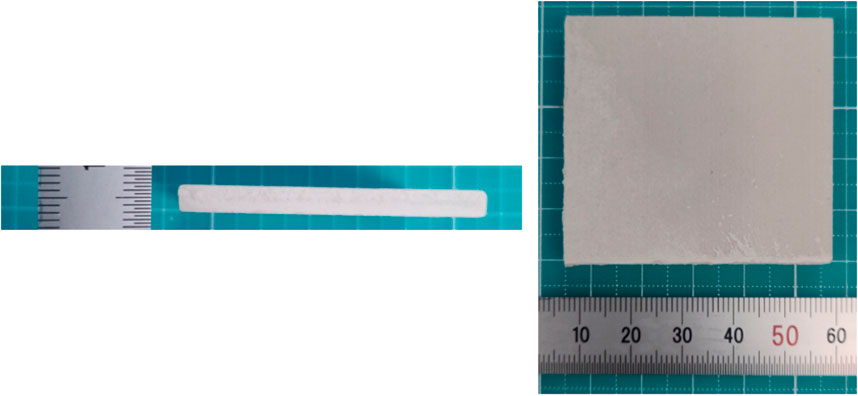
FIGURE 6. An overview of the phantom in the TCD experiment.
The standard Doppler velocity for interrogation angle θ was used as expressed by the following formula:
where V is the blood velocity, FD is the Doppler shift, C is the sound velocity in tissue, and F is the transmitted frequency from the probe. Measured velocity (V) is divided by the cos θ) value or the cosine of the interrogation angle to apply the angle correction.
The error is calculated by the following equation:
2.6 Results
2.6.1 Flow phantom
Figure 7 shows the flow phantom in the study. The phantom included scatterers and was still transparent enough to be used for PIV with a diameter of 3.4 mm, instead of 4 mm.
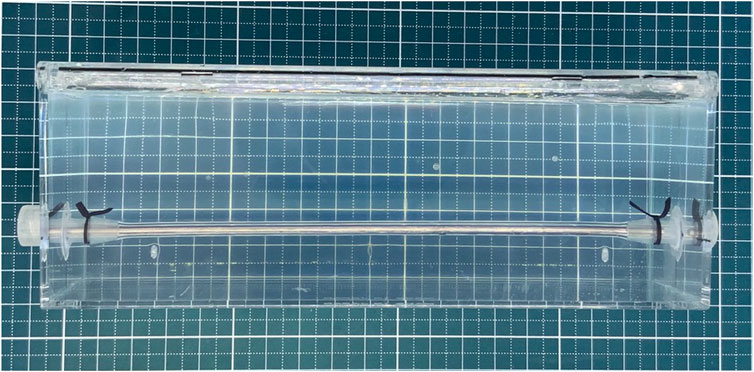
FIGURE 7. An image of the phantom in the study. The smallest squares behind are 5 mm × 5 mm.
The gypsum gives significant attenuation to the signal received by the TCD probe. Without the gypsum plate, the received signals would have been so high that no observation can be deduced due to a high B-mode intensity. Hence, with the gypsum plate, the image intensity was lowered enough for the right visibility.
2.6.2 Acoustic measurement
Table 1 lists the acoustic measurement results. As can be observed, attenuation values were within the recommended value of 0.5% ± 10% dB/cm/MHz. Thus, the signal levels that are detected by TCD are supposed to act similarly when compared with the standard measurement. The sound velocities of both the softer and stiffer tissues were higher than the values recommended by IEC 61685 at 1,540% ± 1% m/s. However, it is worth highlighting that, according to Browne et al., some inaccuracies of the characteristics of the phantom are of insignificant consequence if the velocity control is accurately done [17].
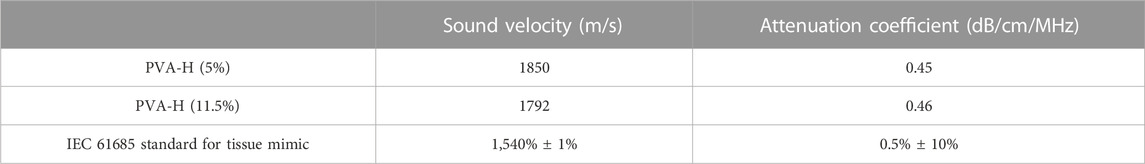
TABLE 1. Sound velocity and attenuation coefficient of PVA-H concentration materials.
2.6.3 PIV measurement
Figure 8 shows the PIV measurement and theoretical equation velocity profiles for both flows. In Table 2, we show the maximum PIV velocities and theoretical values calculated from Equation 2. From the equation, the diameter R was set to 3.4 mm, which was derived from the measurement in the PIV image and B-mode ultrasound. The PIV measurement errors compared with the theoretical equation are −1.56% and −3.19% for 124 and 130 mL/min flows, respectively.
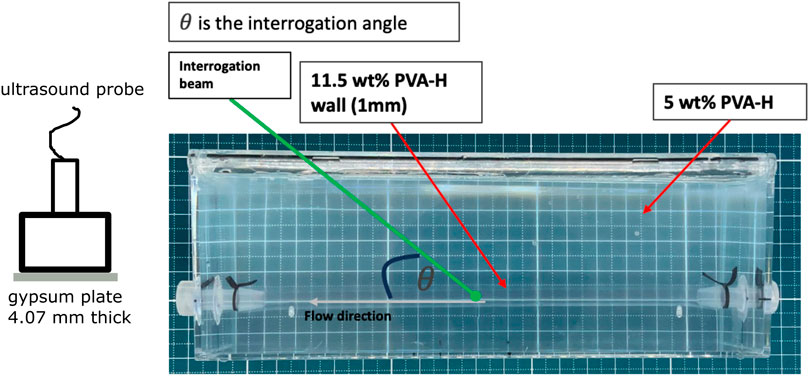
FIGURE 8. PIV measurement results compared to theoretical values.
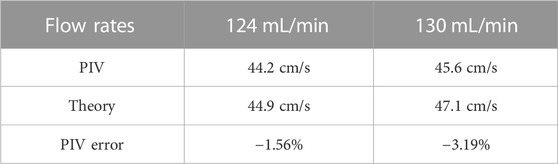
TABLE 2. Maximum velocities of PIV and theoretical values and the error for both flow rates.
The PIV measurement values are compatible with the theoretical values. Thus, as demonstrated in this study, the PIV measurement is a reliable validation tool for Doppler measurement (see Figure 8; Table 2). Values were not as reliable near the channel wall because the PIV measurement lacks the ability to track those particles near the wall [18]. However, this is not considered a limitation in this study because the observed velocities are the maximum velocities.
2.6.4 Doppler measurement
Table 3 details the error values of various interrogation angles and flow rates. One more flow rate, 115 mL/min, is added to this measurement. Without correction, TCD underestimates velocity by approximately 30% in a 40° interrogation window while steadily increasing the underestimation, reaching to approximately 60% at an 80° interrogation angle (see Table 3). After correction for lower interrogation angles (40° and 50°), TCD tends to underestimate the maximum velocity as low as 10.4% at a 40° interrogation angle and 130 mL/min flow. For higher angles (60°, 70°, and 80°) and 124 mL/min flow, TCD increasingly overestimates velocity as the angle expands, reaching a maximum velocity error of 113.7% at an 80° interrogation angle. In the 115 mL/min flow, TCD underestimates the velocities for 40°, 50°, and 60° interrogation angles by similar values, and it reaches the least error at 70° and overestimates the velocity of 80° interrogation angles, although not as severe as those in the 124 mL/min and 130 mL/min flows.
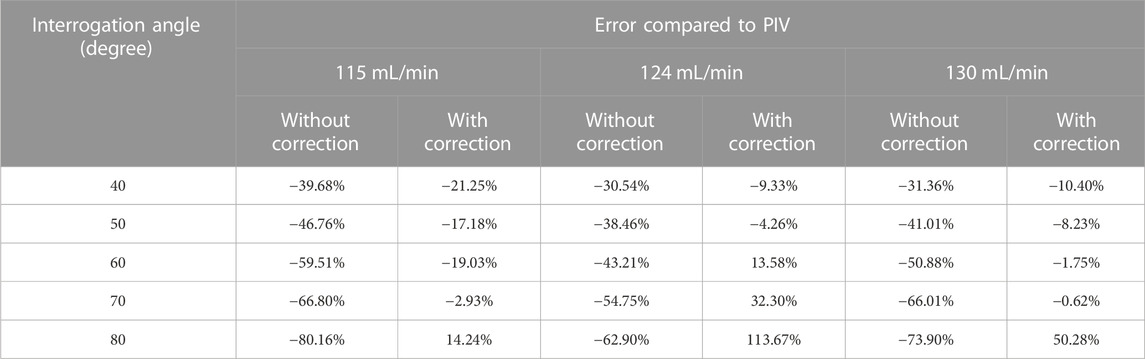
TABLE 3. Velocity measurement error compared with PIV values on several interrogation angles.
3 Discussion
We investigated the effects of various interrogation angles and angular mismatches on the measured Doppler maximum velocities in a TCD setup. Without correction, the measured velocities were underestimated for all the interrogation angles, resulting in higher error values in larger angles. In comparison, those with correction, the errors were suppressed, except for the larger angles.
Undoubtedly, there is little research on angular mismatch effects. Winkler et al. attempted some error corrections implicated by angular mismatch, but their subject was the intrinsic spectral broadening of the probe/machine, not the occurrence during usage. No effects were studied with comparison to an accurate modality of velocity measurement tools in a TCD setup both in vivo and in vitro.
This study presents elaborative quantitative data on Doppler measurement inaccuracies in a TCD setup. From the results presented in Table 2, we can observe that in lower interrogation angles (up to 60°), angle correction worked in lowering the error magnitude into a more acceptable range.
Moreover, the mismatch effects on the measured velocities in this study are shown in Table 4. We selected the best-performing interrogation angle at 50° for this table. From the table, we can see that in the 50° interrogation window, positive mismatch angles will produce higher errors compared to negative mismatch angles. This is due to the non-linear cosine change in higher angles. A slight 80° angle change gives a considerable change in that angle’s reciprocal cosine
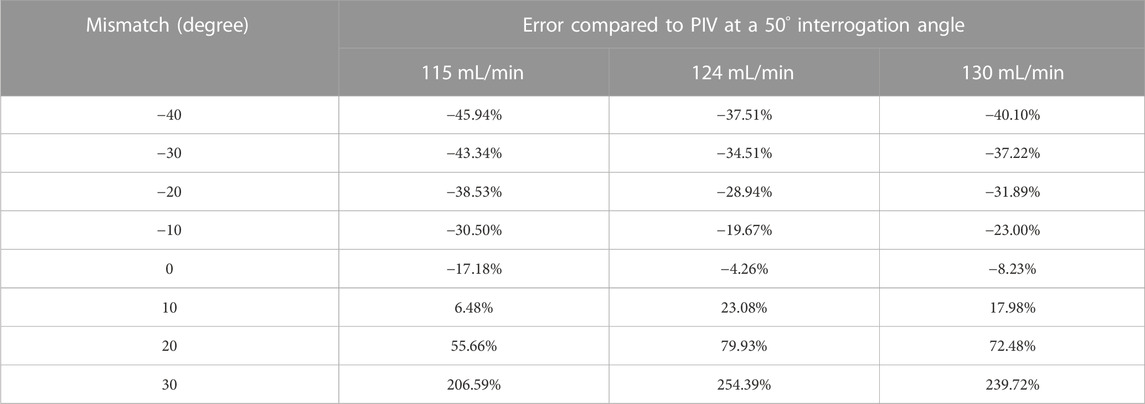
TABLE 4. Velocity measurement error at 50° interrogation angle for several angular mismatches.
Based on these values, it is recommended that the actual interrogation angle should be investigated and appropriate angle correction should be considered prior to operating blind TCD. Furthermore, it has been reported by Jarquin-Valdivia et al. that from 400 MCA measurements, approximately 20% had 79° of angular mismatch or more with respect to the temporal window [5]. This means that the measured velocities of these 20% MCAs may have been underestimated by approximately 63%. Thus, as a precaution, if possible, examiners must maintain the interrogation angle at a maximum of 50° with the application of 40–60° angular mismatch during the measurement to be within the least magnitude of errors. Still, identifying the actual interrogation angle and slight mismatch by other tools is more desirable.
Further ultrasound probe development may be advantageous, for instance, an in-probe angular change detector. A type of gyrometer and sound alarm can be built into a probe to notify if an angular change is detected after a certain angular correction application. Such development may enhance precision in-probe control of ultrasound interrogation. From another point of view, it was also recommended that correction in Doppler ultrasound systems may acquire more robustness from a slight interrogation angle change, especially for higher angles.
The proposed study opens the possibilities to ultrasound Doppler phantom usage, particularly for TCD procedures. In this study, a single phantom can be used for both TCD and optical PIV measurements. The setup enables TCD examiners to directly check and compare the vasculature sections in the brain that are otherwise difficult to see in real TCDs. Adding gypsum to a flow phantom may help researchers approximate the TCD setup by providing attenuation for the actual TCD probes. Gypsums are known for CT phantoms [19] or MRI phantoms [20], but their use in a TCD setup as a skull mimic has not been currently explored. However, it was reported before that the speed of sound and the attenuation of a gypsum material were shown to be within the values of the human skull [21, 22].
This study also helps the numerical simulation scenery by providing a way to measure the velocities as an initial condition. These velocities are important because the simulated object effects, such as stent [23, 24], should be compared to the initial values. In some TCD cases, these values are difficult to obtain because of the low accessibility of the velocity measurement in the vessels of interest. The proposed setup may help in obtaining the values based on in vitro approximation.
4 Conclusion
The effects of various interrogation angles and angular mismatches on Doppler measurement were investigated by comparison with PIV values. A Doppler flow phantom from PVA-H and gypsum was developed and used for investigation in the TCD setup. By looking at the blind TCD measurement case for MCA from a temporal window, it was found that various interrogation angles introduced errors as high as 113% at 124 mL/min flow and an 80° interrogation angle even with correction in the measured velocities. In-machine angle correction helped in lowering the error rates, but having less reliable effects on larger interrogation angles. Supported by measurement values in this study, it was found that even for the best-performing interrogation angle, if some angular change was introduced, further errors might still occur despite the initial angle correction. Hence, more robust in-machine angle corrections should be achieved in the future, especially for higher interrogation angles. The flow phantom for the TCD setup developed in this study showed the effects of various interrogation angles and angular mismatches on the measured Doppler maximum velocities by comparison with a PIV setup.
Data availability statement
The raw data supporting the conclusions of this article will be made available by the authors, without undue reservation.
Author contributions
MH: Phantom manufacture, PIV and Doppler measurement KD: PIV and Doppler measurement TI: Accoustic measurement, Doppler measurement YS: supervising MO: Supervising.
Funding
This work was partially funded by the Indonesian Endowment Fund for Education (LPDP) by the Indonesian Government.
Conflict of interest
The authors declare that the research was conducted in the absence of any commercial or financial relationships that could be construed as a potential conflict of interest.
Publisher’s note
All claims expressed in this article are solely those of the authors and do not necessarily represent those of their affiliated organizations, or those of the publisher, the editors and the reviewers. Any product that may be evaluated in this article, or claim that may be made by its manufacturer, is not guaranteed or endorsed by the publisher.
References
1. Bonow RH, Young CC, Bass DI, Moore A, Levitt MR. Transcranial Doppler ultrasonography in neurological surgery and neurocritical care. Neurosurg Focus (2019) 47(6):E2–8. doi:10.3171/2019.9.focus19611
2. Nichols FT, Jones AM, Adams RJ. Stroke prevention in sickle cell disease (STOP) study guidelines for transcranial Doppler testing. J Neuroimaging (2001) 11(4):354–62. doi:10.1111/j.1552-6569.2001.tb00063.x
3. Fatima N, Shuaib A, Chughtai T, Ayyad A, Saqqur M. The role of transcranial Doppler in traumatic brain injury: A systemic review and meta-analysis. Asian J Neurosurg (2019) 14(03):626–33. doi:10.4103/ajns.ajns_42_19
4. Rajamani K, Gorman M. Trancranial Doppler in stroke. Biomed Pharmacother (2001) 55(5):247–57. doi:10.1016/s0753-3322(01)00063-4
5. Jarquin-Valdivia AA, Mitsky NN. The horizontal angle of the middle cerebral artery from the middle TCD temporal window. J Diagn Med Sonogr (2004) 20(1):16–9. doi:10.1177/8756479303260951
6. Tupin S, Saqr KM, Ohta M. Effects of wall compliance on multiharmonic pulsatile flow in idealized cerebral aneurysm models: Comparative PIV experiments. Exp Fluids [Internet] (2020) 61(7):164–11. doi:10.1007/s00348-020-02998-4
7. Hashuro MSS, Tupin S, Putra NK, Daibo K, Inoue K, Ishii T, et al. Development of ultrasound phantom made of transparent material: Feasibility of optical particle image velocimetry. Ultrasound Med Biol (2023) S0301-5629(22):00685–8. doi:10.1016/j.ultrasmedbio.2022.12.020
8. Kosukegawa H, Mamada K, Kuroki K, Liu L, Inoue K, Hayase T, et al. Measurements of dynamic viscoelasticity of poly (vinyl alcohol) hydrogel for the development of blood vessel biomodeling. J Fluid Sci Technol [Internet] (2008) 3(4):533–43. doi:10.1299/jfst.3.533
9. Funamoto K, Yamashita O, Hayase T. Poly(vinyl alcohol) gel ultrasound phantom with durability and visibility of internal flow. J Med Ultrason (2015) 42(1):17–23. doi:10.1007/s10396-014-0560-x
10. Shida S, Kosukegawa H, Ohta M. Development of a methodology for adaptation of refractive index under controlling kinematic viscosity for PIV. ASME Int Mech Eng Congress Exposition (2011) Vol. 2:313–21. doi:10.1115/IMECE2011-64388
11. Ohta M, Handa A, Iwata H, Rüfenacht DA, Tsutsumi S. Poly-vinyl alcohol hydrogel vascular models for in vitro aneurysm simulations: The key to low friction surfaces. Technol Heal Care (2004) 12(3):225–33. doi:10.3233/thc-2004-12302
12. Kosukegawa H, Mamada K, Kuroki K, Liu L, Hayase T, Ohta M. Measurements of mechanical properties of PVA-hydrogel for blood vessel biomodeling.
13. Jarquin-Valdivia AA, McCartney J, Palestrant D, Johnston SC, Gress D. The thickness of the temporal squama and its implication for transcranial sonography. J Neuroimaging (2004) 14(2):139–42. doi:10.1111/j.1552-6569.2004.tb00230.x
14. Hoskins P, Martin K, Thrush A, editors. Diagnostic ultrasound: Physics and equipment [internet]. 3rd ed. CRC Press (2019). doi:10.1201/9781138893603
15. Batchelor CK, Batchelor GK. An introduction to fluid dynamics. Cambridge University Press (2000).
16. Thielicke W, Sonntag R. Particle image velocimetry for MATLAB: Accuracy and enhanced algorithms in PIVlab. J Open Res Softw (2021) 9(1):12. doi:10.5334/jors.334
17. Browne JE, Ramnarine KV, Watson AJ, Hoskins PR. Assessment of the acoustic properties of common tissue-mimicking test phantoms. Ultrasound Med Biol (2003) 29:1053–60. doi:10.1016/s0301-5629(03)00053-x
18. Nguyen CV, Fouras A, Carberry J. Improvement of measurement accuracy in micro PIV by image overlapping. Exp Fluids (2010) 49(3):701–12. doi:10.1007/s00348-010-0837-9
19. Hazelaar C, Van Eijnatten M, Dahele M, Wolff J, Forouzanfar T, Slotman B, et al. Using 3D printing techniques to create an anthropomorphic thorax phantom for medical imaging purposes. Med Phys (2018) 45(1):92–100. doi:10.1002/mp.12644
20. Harries J, Jochimsen TH, Scholz T, Schlender T, Barthel H, Sabri O, et al. A realistic phantom of the human head for PET-MRI. EJNMMI Phys (2020) 7(1):52. doi:10.1186/s40658-020-00320-z
21. Zhang W, Trivedi H, Adams M, Losey AD, Diederich CJ, Ozhinsky E, et al. Anatomic thermochromic tissue-mimicking phantom of the lumbar spine for pre-clinical evaluation of MR-guided focused ultrasound (MRgFUS) ablation of the facet joint. Int J Hyperth [Internet] (2021) 38(1):130–5. Available from. doi:10.1080/02656736.2021.1880650
22. Pichardo S, Sin VW, Hynynen K. Multi-frequency characterization of the speed of sound and attenuation coefficient for longitudinal transmission of freshly excised human skulls. Phys Med Biol (2011) 56(1):219–50. doi:10.1088/0031-9155/56/1/014
23. Putra NK, Palar PS, Anzai H, Shimoyama K, Ohta M. Multiobjective design optimization of stent geometry with wall deformation for triangular and rectangular struts. Med Biol Eng Comput (2019) 57(1):15–26. doi:10.1007/s11517-018-1864-6
24. Zhang M, Li Y, Zhao X, Verrelli DI, Chong W, Ohta M, et al. Haemodynamic effects of stent diameter and compaction ratio on flow-diversion treatment of intracranial aneurysms: A numerical study of a successful and an unsuccessful case. J Biomech [Internet] (2017) 58:179–86. doi:10.1016/j.jbiomech.2017.05.001
Keywords: transcranial Doppler ultrasound, flow phantom, particle image velocimetry, angular mismatch, polyvinyl alcohol hydrogel
Citation: Hashuro MSS, Daibo K, Ishii T, Saijo Y and Ohta M (2023) Ultrasound flow phantom for transcranial Doppler: An assessment of angular mismatch effect on blood velocity measurement in comparison to optical particle image velocimetry. Front. Phys. 11:1134588. doi: 10.3389/fphy.2023.1134588
Received: 30 December 2022; Accepted: 20 March 2023;
Published: 06 April 2023.
Edited by:
Aidan D. Meade, Technological University Dublin, IrelandReviewed by:
Igor Petrov, Moscow Institute of Physics and Technology, RussiaHowuk Kim, Inha University, Republic of Korea
Copyright © 2023 Hashuro, Daibo, Ishii, Saijo and Ohta. This is an open-access article distributed under the terms of the Creative Commons Attribution License (CC BY). The use, distribution or reproduction in other forums is permitted, provided the original author(s) and the copyright owner(s) are credited and that the original publication in this journal is cited, in accordance with accepted academic practice. No use, distribution or reproduction is permitted which does not comply with these terms.
*Correspondence: Makoto Ohta, aGFzaHVyb0BzdGFmZi5zdGVpLml0Yi5hYy5pZA==