 Alberto García-Rodríguez1*
 R. A. Barrio1
 Tzipe Govezensky2Julia Tagüeña3,4Miguel Robles Pérez3
 Humberto Carrillo Calvet4,5
 José Luis Jiménez Andrade4,5Ricardo Arencibia-Jorge4
 Kimmo Kaski6
- 1Instituto de Física, Departmento de Sistemas Complejos, Universidad Nacional Autónoma de México (UNAM), Mexico City, Mexico
- 2Insituto de Investigaciones Biomédicas, Universidad Nacional Autónoma de México (UNAM), Mexico City, Mexico
- 3Institute of Renewable Energies (IER), National Autonomous University of México (UNAM), Col Centro, Temixco, Mexico
- 4Complexity Sciences Center, National Autonomous University of México, Circuito Centro Cultural s/n, México City, Mexico
- 5Faculty of Sciences and Complexity Sciences Center, National Autonomous University of México (UNAM), Circuito Centro Cultural s/n, Mexico City, Mexico
- 6Department of Computer Science, Aalto University School of Science, Helsinki, Finland
In this article, we will describe a model to examine the influence of differently organized institutions on their scientific productivity. We take two extreme cases, on one hand, an institution divided in departments with no collaboration between people in different departments. These could be disciplines or merely projects. On the other hand, we consider an institution that allows interactions between all individuals, without a departmental structure to a department. We compare the results with data from the Institute of Renewable Energy (IER) at UNAM, which has changed its organization and policies during the last 30 years, and we could quantitatively predict the changes observed in productivity and multidisciplinarity. This model can be applied to a broader set of institutions and processes.
1 Introduction
The organizational structure of a research institution is a determinant factor for internal communication processes between researchers. It can preclude or foster collaboration and as a result affect the magnitude and nature of the institution’s scientific production. After a long period of specialization focusing mostly on monodisciplinary research, multidisciplinary collaborative research has become increasingly prominent [1, 2]. This trend has enhanced our ability to address complex problems from a transdisciplinary perspective [3, 4].
Science itself can be considered a complex evolving system that involves network interactions between its constituents, such as researchers, institutions, and countries. Since the vast majority of research results are published in scientific papers (most of them available in digital form), data science techniques are pertinent to discover patterns or regularities in the scientific activity and output [5, 6]. In this context, different studies have focused on the characteristics of research productivity [7] and scientific collaboration [8], evolution of domestic and international collaboration networks [9, 10], and even the role of multidisciplinarity on social integration of scientists [11, 12]. However, there are only few studies that have quantitatively analyzed the relationship between scientific performance and the form of institutional organization, as well as the effects that these changes can have on the productivity and multidisciplinarity of institutions [13]. In a previous paper, we bibliometrically analyzed the impact of structural and organizational changes on the performance of a Mexican research institute [14].
As a next step, there is interest to find ways to describe the characteristics and dynamics of scientific production, as well as to identify the most relevant underlying factors. In addition, a more ambitious objective is to identify social interactions for enabling us to create mathematical models that could capture the main features of the system to describe its dynamics and, thorough simulations, help us in analyzing the effect of the underlying factors on the magnitude and characteristics of production. In the past, we have used this sort of system models to investigate the dynamical development of opinion in co-evolving social networks [15,16], as well as analyzing interactions in trading networks [17].
In order to contribute to the understanding of collaborative research systems, we develop a mathematical model that drives the dynamics of a researchers’ collaboration network. The model is adapted to investigate the effect of organizational changes on the performance of a scientific research institution. We analyzed the evolution of productivity and the multidisciplinary characteristics of research, resulting from the collaboration of researchers in different areas of specialization. According to this model, the institution is represented by a network in which each node represents a researcher characterized by two state variables that co-evolve in a collaboration network with links describing collaboration between researchers.
The model would allow us to follow and compare the system’s evolutionary paths under various organizational structures and, to some extent, qualitatively replicate the dynamics of a research institution during 35 years of development. As far as we know, this is the first study that mathematically models the evolution of productivity and multidisciplinarity of a research institution in the context of its organizational transitions.
2 Materials and methods
2.1 Description of the model
In order to devise a model for describing the activity of a group of researchers belonging to an academic or research institution, we first need to consider how it is structured. Most of them are structured in a hierarchical way, such that there is a director and under him or her, there are a few research coordinators or department heads coordinating several research groups that gather researchers with common interest in various research topics.
This hierarchical structure could be kept and reinforced by the authorities in various ways, ranging from a rigid policy, strictly forbidding cooperation between different groups and encouraging cooperation within each group, to a completely free policy that allows anybody in the institution to cooperate and join in various projects.
As stated previously, our aim is to investigate the influence or impact that different organizational structures or policies followed by a research institution have on the productivity and performance of its members. In order to do so, we have to consider the main attributes that compel a researcher to perform his job. Evidently, there are many, but for simplicity, let us consider only two. Undoubtedly, the main professional attribute is the interest and proficiency of the person facing the matter of research, project, or problem at hand. Let us call it the academic attribute, xi, which is a property of a person i in the institution’s network. On the other hand, the social aspect is also important since in order to collaborate with somebody, one has to get along reasonably well; let us call this social attribute yi, also being an attribute of each person.
In this model, linked agents interact (denoting exchange of ideas, maturation of the project, and social adaptation), causing the coevolution of xi and yi
We represent the dynamical evolution of the vector of attributes, formed by the two state variables,
where the first term on the right-hand side stands for the continuous pairwise interactions between two persons or agents, and it only depends on the attributes of the pair of agents forming a link. The second term represents an external actor or operator
2.1.1 Dynamics of the state variables
Next, we need to define all interactions. In order to keep the model simple, we only consider pairwise interactions between agents. For the personal xi and yi variables, we propose the following dynamics:
where the state variables (xi(t), yi(t)) are, for definitiveness, bounded ∈ [-1,1] and represent the instantaneous state of an agent i. Hence, the difference in academic attitude or social empathy of the agents forming a link is readily quantified between limits. The first term on the right-hand side describes a discussion or a direct interaction through a link represented by a non-zero element of the adjacency matrix, and we have denoted
The second terms of Eq. 2 account for the influence of other agents (higher-order neighbors) on agent i, and hence it represents the influence of the whole network on a single person, that is,
where the summation is over all agents that are not first neighbors. It is observed that between agents without a direct social interaction, there is a cross-wise interaction between the two state variables, i.e., x with y and y with x. This means that unlike in the case of direct social interactions, the influence of a good social environment and academic proficiency is equally important.
The state variables change all the time with the time scale dt, which could be the mean time span between pairwise discussions. The parameters αi and βi do not change in time, and they represent the particular way an agent interacts with others concerning their proficiency and empathy, and they are considered random bounded coefficients that define the inherent position of an agent with respect to the average fixed at that value. The coefficient αi is agent i’s way of interacting, being near −1 if the agent is inclined to go against the crowd and usually argues against other agents’ points of view, while it is near +1 if the agent is content to agree with other agents. βi takes values near 0 if agent i does not take into account others academic positions in the group and near +1 if the agent is influenced by them.
An example of the kind of dynamics obtained solving Eq. 2 by using the simple Euler method with dt = 0.002 is depicted in Figure 1. The state variables are fixed when they reached one of the two limit values. It is observed that there are some agents whose variables do not reach the limit values.
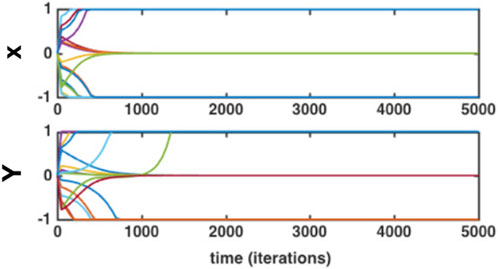
FIGURE 1. Dynamical behavior of academic attitude (x) (top panel) and social attribute (y) (lower panel) applying a simple Euler method. Each line represents the time history of an agent’s attribute.
Next, we need to describe the dynamics of the links in the network.
2.1.2 Dynamics of the adjacency matrix
As in any social network, the links are weighted. The weights could vary over time because of dyadic interactions. Some of the links weaken if the state variables of the individuals differ substantially and others are enhanced. The weights of elements Aij of the adjacency matrix depend on all the state variables of the two individuals interacting, and one could assume it to follow the simple dynamics:
where coefficient D sets the time scale and slope Mij is a linear function of the four state variables associated with a tie, namely, (xi, yi) and (xj, yj). For simplicity, we assume that,
It should be noted that the maximum value of the first term on the right-hand side is 4 and always non-negative. The parameter q is a positive constant setting the threshold, in which the slope becomes negative. For definiteness, we have taken q = 3/2 throughout all our calculations, considering that in social relations, people tolerate friends much more than they tolerate foes, and therefore q < 2. In Figure 2, we show the time evolution of the adjacency matrix elements. It is worth noticing that some of them grow linearly and others diminish and even become negative.
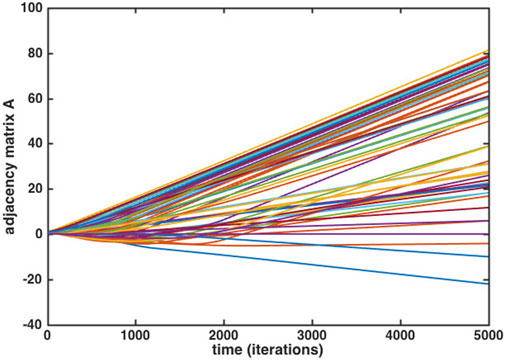
FIGURE 2. Evolution of the weights of the adjacency matrix elements A calculated from Eq. 5 using D =3. Each line corresponds to a different matrix element. It is worth noticing that some of them do not behave linearly due to the temporal changes of the state variables in Eq. 6.
2.1.3 Rewiring scheme
So far, we have not explained the role of the operator
In this work, we shall remove a link, when its weight diminishes below a certain value. It is reasonable to choose this value as 0 since a link with weight 0 is equivalent to losing the link. Obviously, the time scale in which a network changes links is not the same as the time scale in which the variables change. Therefore, during the calculation, we allow to run a time dT = mdt, where m is a number between 20 and 10,000, depending on the agents’ tolerance to bear with useless links, after which one counts the number of links that have reached the lower threshold and replace them with new links according to well-defined criteria.
2.2 Example calculations
2.2.1 Institutional network
Let us consider a typical research institution that is initially organized to a structure of hierarchical network, as depicted in Figure 3.
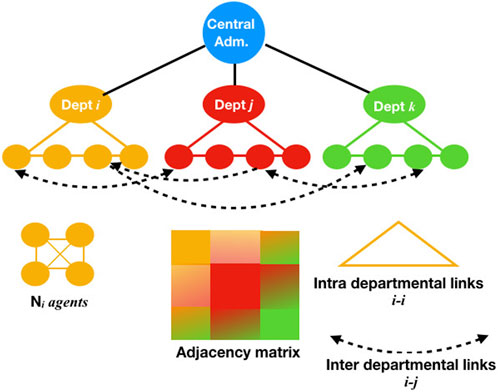
FIGURE 3. Structure of a simple network representing a research institution.
There is a central administration which does not take part in the research products. The black lines in the figure represent the links between the administration and the coordinators, who are linked to all the members of the department they lead. The members of one department form cliques (thin colored lines); therefore, the adjacency matrix has a block diagonal form with all non-zero elements within one block (colored square corresponding to each department). In the case the organization of the institution allows it, there will be links between different departments (broken lines in the figure, outside of the diagonal blocks).
2.2.2 Conserving the structure of the institution (no rewiring allowed)
Next, we consider an example calculation of an extreme case in which the structure of the institution is maintained strictly unchanged. For simplicity, we consider a simple structure with only two hierarchical levels and three departments, as the one shown in Figure 4. The initial groups colored on the left-hand side are unchanged after the calculation; however, their state variables have changed according to the legend.
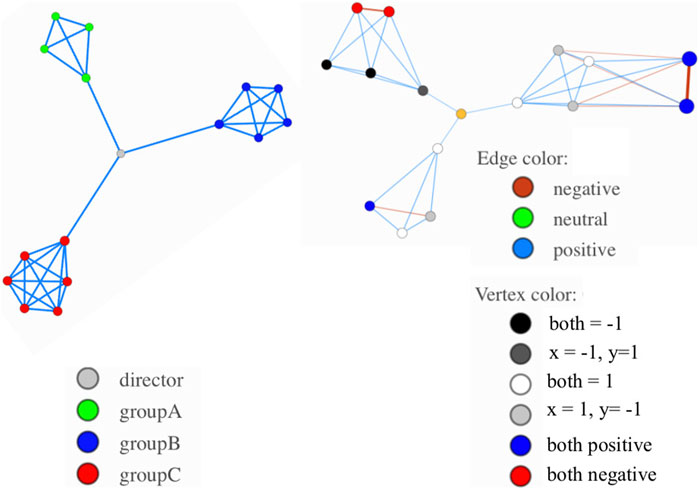
FIGURE 4. Example of a simple structure. On the left-hand side, the initial organization with the departments distinguish by a color code is shown; on the right-hand side, the final structure after computing the model for 100,000 iterations is shown.
We are interested in quantifying the number of research outcomes or products (articles, finished research, etc) as a function of time. This is carried out by setting an upper limit to the weights of the elements of A, when we consider that the cooperation between a pair of agents has attained some maturity. This value has to be fixed when setting the physical units of the parameters, by considering that an article or a report does not take less than 1 year of work. In order to quantify the products, we count the number of links having attained the limit and reset the weights of these bonds to half the limit value, considering that the cooperation continues working well. In Figure 5, we show the behavior of the adjacency matrix weights in the upper panel and the number of research products for every 20 iterations in the lower panel. In this preliminary calculation, we arbitrarily chose the upper limit as Alim = 5.
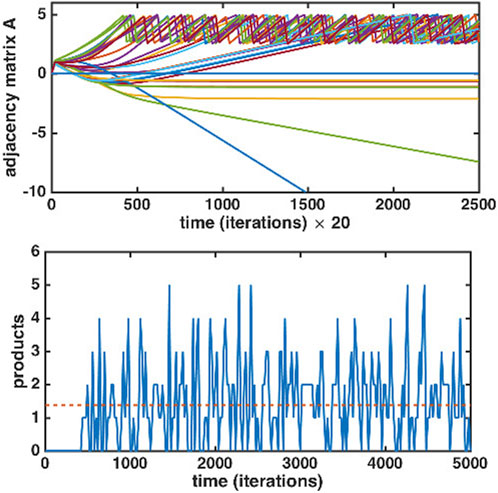
FIGURE 5. Upper panel: Dynamical behavior of the adjacency matrix elements. Notice that only few links continue to grow negative, and these are the bonds colored in red in Figure 4. Lower panel: Count of the products in time intervals of 20 iterations. The average number of products is 1.385 in this time span (broken yellow line).
2.2.3 Allowing rewiring
The other extreme case is when the structure is allowed to change without restriction according to the dynamics of the state variables. It is clear that the links that are growing robustly are responsible for the accumulation of research products. However, the links that are becoming slightly negative are considered not functioning properly, and then the agents prefer to change this link for another one. In this particular calculation, a link that becomes negative is removed and a new link is created at random, if possible.
Now, links that are multidisciplinary represent the ones that bond agents belonging to different departments and represent simply the link outside the block diagonal structure of the adjacency matrix. Starting with the initial network shown in Figure 4, we performed an example calculation allowing rewiring. The final network is depicted on the left-hand side of Figure 6, and the dynamical behavior of the variables is exhibited on the right-hand side.
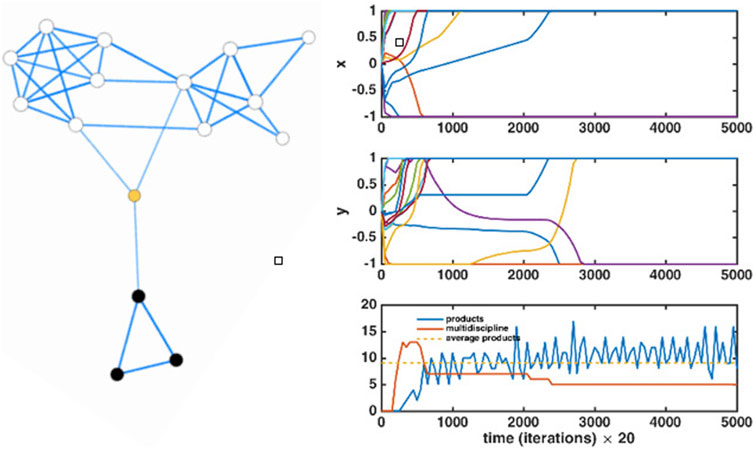
FIGURE 6. Final network obtained when rewiring is allowed. It is observed that all agents have reached the limiting values of their state variables. The plots on the right show the time evolution of the dynamical variables and the productivity count. We also show the number of multidisciplinary links as a red line.
As additional information, we show the changes of the agent’s degree during the running time in the upper panel of Figure 7. It is observed that they change rapidly at the beginning, but then they do not change anymore, when the network is stabilized, or when all the variables have reached their limiting values. In the lower panel of this figure, we show the dynamical behavior of the weights of the links. It is worth noticing that the ones that reach zero weight are removed and also that some links that were growing initially end up being cut, and some links with diminishing weight initially recover and end up successfully contributing to the count of research products.
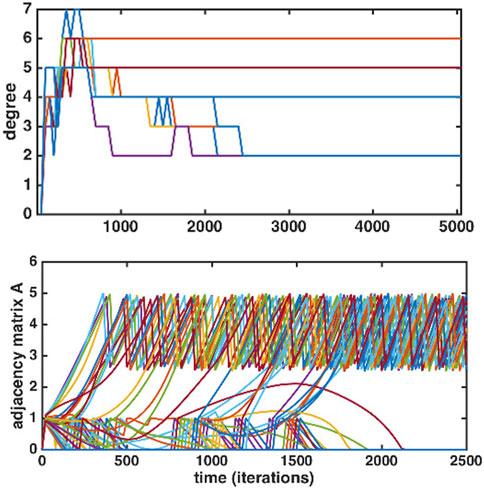
FIGURE 7. Upper panel: Dynamics of agents’ degree; after 3,000 iterations, they do not change any more. Lower panel: dynamical behavior of the adjacency matrix elements. It is worth noticing that there are no negative links since they are cut when their weight reaches 0. The observed dynamics is very rich, some links’ weight grows steadily, some grow for some time but then decrease and become 0, and others decrease, but after some time, they increase and become productive.
In the model, the initial network is not fully connected. Consequently, when rewiring is not allowed, the academic and social exchanges remain within a department; f2 and g2 are zero. In contrast, when rewiring exists, from the first interaction between departments, exchange of ideas and ways of solving problems flow among the members of both departments, and f2 and g2 do participate in the dynamics, enriching research ways of thinking.
3 Results
3.1 Application to a real case
In this section, we shall apply our model to a specific case, which is interesting because it has changed its organizational structure quite radically twice since its creation in 1985. This case has been examined by us in the past, and the data concerning the productivity, multidisciplinarity, and other features can be found in Ref. Jiménez-Andrade et al.
3.2 The Institute of Renewable Energy (IER)
The Institute of Renewable Energy (IER) is an institution of the Universidad Nacional Autónoma de México (UNAM), where renewable energies, sustainability, and related phenomena are investigated. The institute also includes a program of graduate and undergraduate studies. It started 37 years ago as a solar energy laboratory (LES) at Temixco, Morelos, attached to the Institute of Materials Research (IIM-UNAM), Campus Mexico City. The new site was chosen for its solar radiation quality required for the purpose of renewable energy research. Ten years later, it became an independent research center, named the Energy Research Centre (CIE), with new research lines and postgraduate studies. This center grew from 1996 to 2013 and diversified its disciplines even more to other renewable energy-related topics. As a center, it was organized in three separated departments, according to the general scope of its tasks. In 2013, it was upgraded to become the IER, and in the institutional hierarchy of UNAM, it is in a higher category. Later, in 2017, it abolished the departmental structure to become a network of 29 projects collaborating in eight research lines and having three main transversal goals: research, teaching, and innovation. In Figure 8, we illustrate the three organization structure changes that this institution underwent since its birth in 1985: from laboratory to a center in 1996 and then became an institute in 2013, with a departmental structure, that finally transitioned to develop a collaborative network.
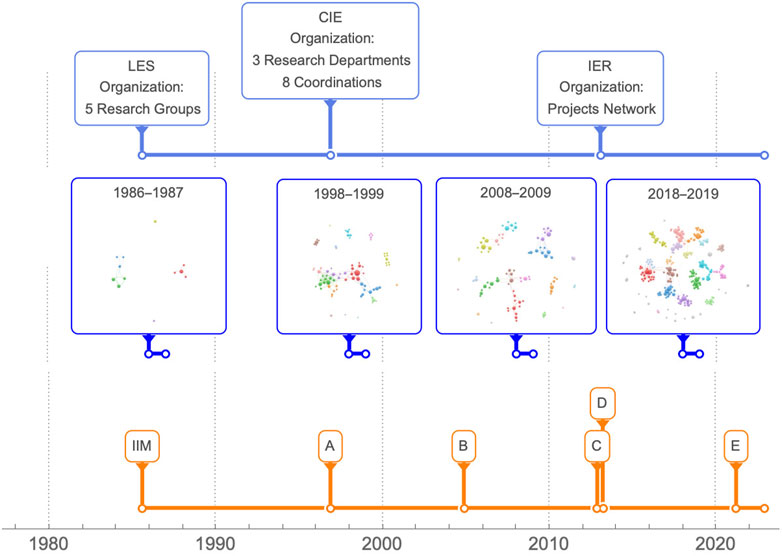
FIGURE 8. Timeline of the LES-CIE-IER UNAM. The upper line marks their organization structures. The lower line marks the change of director in capital letters. The middle line is the actual paper’s networks in which there are at least two authors from the institution.
In the upper time-line, the different administrative structure changes are indicated. The LES had five research groups, the CIE had three departments, and finally the IER changed to a flexible network structure.
In the lower time-line, the capital letters mark the change of director. In UNAM, each director has a 4-year period, with one possible re-election. In our example, C is an interim director serving during the transition from the center to the institute. The relevance for the purpose of this study is in the networks in the middle time-line, which were obtained from the actual productivity data of the institution.
3.3 Time evolution of the IER
In order to apply our model to the IER case, we have collected all the information, not only data of the organizational structure of each year but also the following bibliometrical measures we calculated previously Jiménez-Andrade et al.: the productivity of the institutional faculty (annual average of articles per researcher), and the institutional multidisciplinarity (using a thematic dispersion index) [18].
First, we calibrated the model parameters for the limiting case of not allowing rewiring, that is, when T > 1 year. The time scale of integration of the dynamical equations is 1 day = 20 × dt, and the best results were obtained for the time scale D = 2.5 and upper limit to the link weights Alim = 30. When rewiring is allowed between departments with a value of T = 90 days, the model gives reasonable results for both the productivity and the multidisciplinary index. These parameters were fixed for all the simulations.
Since the personality attributes αi and βi and the initial conditions for the state variables xi and yi are random, the results vary in each of the yearly simulations. Therefore, we performed 100 simulations for each year, by keeping the random values of the personality attributes α and β constant (i.e., assuming that people do not change) in all the simulations, but with different random initial conditions for the state variables xi and yi.
It is important to note that the model was fed with the data of the collaboration network for each year as an initial condition. These networks were extracted from the collaboration records of LES-CIE-IER-UNAM, and a selection of these networks representing the dates of the structural changes is shown in Figure 9. It is worth noticing that in 1986, the agents were grouped in five cliques, while in 1996, they were organized as departments. The departmental structure prevailed until 2017 and during this time, they grew with new researchers. After that, until 2021, the departmental structure was abolished, and the research was conducted by interdisciplinary groups.
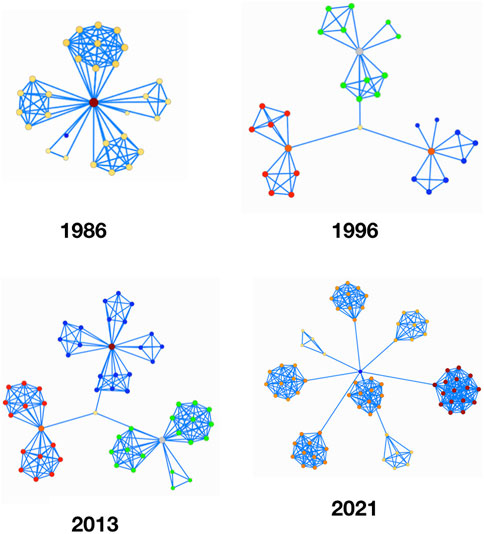
FIGURE 9. Examples of networks built following the structure of the IER in dates when the structure changed.
The results for the productivity are shown in Figure 10 in the upper panel and for the multidisciplinarity in the lower one. It is observed that the real data behave similarly to the data projected by the model, except for the period 1996–2000.
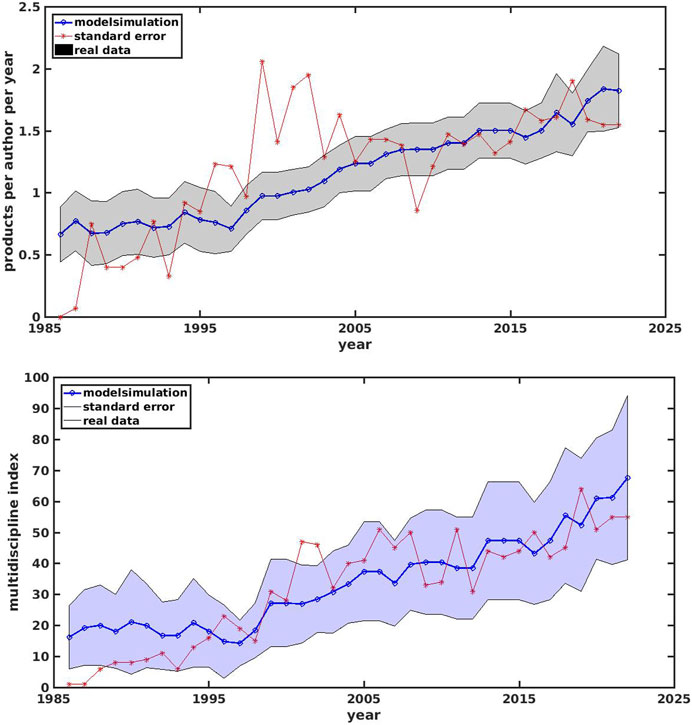
FIGURE 10. Results obtained for the IER using the model. The blue diamonds are the mean results of 100 simulations per year. The light blue shaded area is the standard deviation. The red stars represent real data of products (top) and multidisciplinarity (bottom).
We believe this discrepancy is due to several peculiar circumstances that were not included in the model but had a significant impact on the productivity and institutional multidisciplinarity:
1) The creation of the CIE involved a structural reorganization into departments and the increase in the number of the staff.
2) The increase of the institutional research lines, covering new and diverse thematic areas, and
3) The establishment of university postgraduate courses at UNAM as a transversal mechanism for the training of human resources, which fostered greater participation of master and doctoral students in institutional research.
We should also mention that there was an increase in the scientific meetings specialized in renewable energies, at the international level derived from the policies outlined at the United Nations Conference on Environment and Development, held in Rio de Janeiro in 1992. Many papers included in the proceedings of these events were then published by the mainstream journals, including papers developed by the CIE researchers.Although our study addressed the dynamics of internal collaboration, for a more complete analysis of institutional development, international and interinstitutional collaboration networks should be considered. In addition, the variables of socio-economic nature such as budgets and incentives for research, and even the characteristics of the disciplines addressed by the institution, their social impact, and the influence of the historical context could enhance the analysis even more. Nevertheless, our approach could constitute an important complement to the decision-making processes in research evaluation and contribute to the holistic analysis of this type of complex social problems.
After the year 2000, the real data showed a greater adjustment to the model, with a new increase in productivity and multidisciplinarity during the period 2013–2020. This period started with the creation of the IER in 2013 and the development of new structural changes in 2017, abolishing the departmental structure, and the development of new research lines with a greater convergence of disciplines.
It is worth noticing that the model exhibits two changes of behavior, one in 1996 when it passed from a constant low value of the production to a linear growing regime that was suddenly modified in 2014. In the multidisciplinarity index, the first change in 1996 is not very noticeable, but there was an increase in 2017, when the departmental structure of the institute was abolished. A better visualization when comparing with the real data is seen in Figure 11, where we show data averaged over our administrative year periods. Here, we could clearly distinguish the three stages of IER evolution.
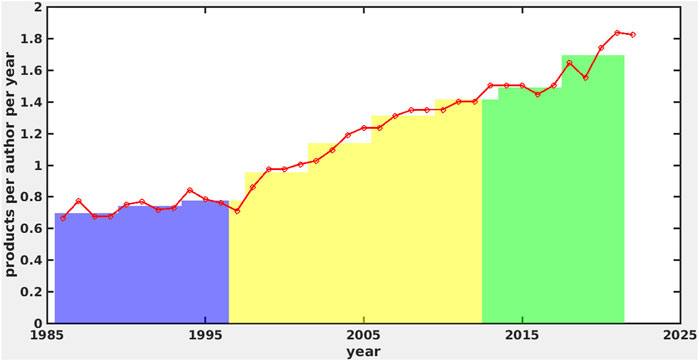
FIGURE 11. Timeline of the LES (in blue), CIE (in yellow), and ER (in green) averaged over 4-year periods. Average simulations’ results are shown in red.
4 Discussion
In this study, we have presented a model to investigate the impact of a research institutional organization on the performance of its members. Despite the simplicity of the model, it captures the main factors playing a role in such relation, namely, the academic proficiency of the persons and the social relations in their activities. These have been modeled with a minimum number of state variables, whose values modify the network of collaborations among the agents. The model stresses the importance of social relations on the research products and that multidisciplinary studies are favored by interdepartmental collaborations.
Modeling collaboration networks at an institutional level is always a challenge. There are multiple factors that could affect the model, such as disruptive changes in organizational structure, increase or decrease of institutional budgets, and changes in policy priorities. In our case study, it was possible to demonstrate how the organizational changes implemented in the IER had an effect on the dynamics of collaboration and institutional performance. Our model projected the effects on the productivity and multidisciplinarity of the institution, with an adjustment quite similar to the actual evolution of the institute.
Data availability statement
The datasets presented in this study can be found in online repositories. The names of the repository/repositories and accession number(s) can be found in the article/Supplementary Material.
Author contributions
RB, JT, HC, and MP contributed to the conception and design of the study. RB created the model. AG-R, TG, HC, JJ, and KK contributed to the design and adjustments of the model. RB wrote the first draft of the manuscript. JT, MP, RA-J, HC, TG, and KK wrote sections of the manuscript. All authors contributed to manuscript revision, read, and approved the submitted version.
Funding
This work was partially supported by Conacyt through project 283279.
Acknowledgments
We thank Ricardo Ruiz Sánchez for their support during the data normalization process.
Conflict of interest
The authors declare that the research was conducted in the absence of any commercial or financial relationships that could be construed as a potential conflict of interest.
Publisher’s note
All claims expressed in this article are solely those of the authors and do not necessarily represent those of their affiliated organizations, or those of the publisher, the editors, and the reviewers. Any product that may be evaluated in this article, or claim that may be made by its manufacturer, is not guaranteed or endorsed by the publisher.
References
1. Baldwin RG, Austin AE. Toward greater understanding of faculty research collaboration. Rev Higher Edu (1995) 19:45–70. doi:10.1353/rhe.1995.0002
2. Duncan S. Cooperative and collaborative mediated research. In: TM Harrison, and TD Stephen, editors. Computer networking and scholarly communication in the twenty-first-century university. New York: Sunny Press (1996).
3. Dalton A, Wolff K, Bekker B. Multidisciplinary research as a complex system. Int J Qual Methods (2021) 20:1–11. doi:10.1177/1609406921103840
4. Hara N, Solomon P, Kim SL, Sonnenwald DH. An emerging view of scientific collaboration: Scientists’ perspectives on collaboration and factors that impact collaboration. J Am Soc Inf Sci Tech (2003) 54:952–65. doi:10.1002/ASI.10291
5. Fortunato S, Bergstrom CT, Börner K, Evans JA, Helbing D, Milojević S, et al. Science of science. Science (2018) 359. doi:10.1126/science.aao0185
6. Wang D, Barabási AL. The science of science. United Kingdom: Cambridge University Press (2021). doi:10.1017/9781108610834
7. Abramo G, D’Angelo CA. How do you define and measure research productivity? Scientometrics (2014) 101:1129–44. doi:10.1007/s11192-014-1269-8
8. Katz JS, Martin BR. What is research collaboration? Res Pol (1997) 26:1–18. doi:10.1016/S0048-7333(96)00917-1
9. Barabási A, Jeong H, Néda Z, Ravasz E, Schubert A, Vicsek T. Evolution of the social network of scientific collaborations. Physica A: Stat Mech its Appl (2002) 311:590–614. doi:10.1016/S0378-4371(02)00736-7
10. Coccia M, Bozeman B. Allometric models to measure and analyze the evolution of international research collaboration. Scientometrics (2016) 108:1065–84. doi:10.1007/s11192-016-2027-x
11. Martín-Alcázar F, Ruiz-Martínez M, Sánchez-Gardey G. Deepening the consequences of multidisciplinarity on research: The moderating role of social capital. Minerva (2020) 58:559–83. doi:10.1007/s11024-020-09404-7
12. Zeng A, Fan Y, Di Z, Wang Y, Havlin S. Fresh teams are associated with original and multidisciplinary research. Nat Hum Behav (2021) 5:1314–22. doi:10.1038/s41562-021-01084-x
13. Wu L, Wang D, Evans JA. Large teams develop and small teams disrupt science and technology. Nature (2019) 566:378–82. doi:10.1038/s41586-019-0941-9
14. Jiménez-Andrade JL, Arencibia-Jorge R, Robles-Pérez M, Tagueña-Martínez J, Govezensky T, Carrillo-Calvet H, et al. Organizational changes and research performance: A multidimensional assessment (2023). Under review.
15. Iñiguez G, Kertész J, Kaski KK, Barrio RA. Opinion and community formation in coevolving networks. Phys Rev E - Stat Nonlinear, Soft Matter Phys (2009) 80:066119. doi:10.1103/physreve.80.066119
16. Iñiguez G, Tagüeña-Martínez J, Kaski KK, Barrio RA. Are opinions based on science: Modelling social response to scientific facts. PLOS ONE (2012) 7:e42122. doi:10.1371/JOURNAL.PONE.0042122
17. Barrio RA, Govezensky T, Ruiz-Gutiérrez É, Kaski KK. Modelling trading networks and the role of trust. Physica A: Stat Mech its Appl (2017) 471:68–79. doi:10.1016/j.physa.2016.11.144
Keywords: scientific collaborations, multidiscipline, research structure, social networks, mathematical modeling of society
Citation: García-Rodríguez A, Barrio RA, Govezensky T, Tagüeña J, Pérez MR, Calvet HC, Jiménez Andrade JL, Arencibia-Jorge R and Kaski K (2023) Impact of institutional organization on research productivity and multidisciplinarity. Front. Phys. 11:1161019. doi: 10.3389/fphy.2023.1161019
Received: 07 February 2023; Accepted: 16 May 2023;
Published: 28 June 2023.
Edited by:
Jiang Zhu, Netskope Inc., United StatesReviewed by:
Jordi Duch Gavalda, University of Rovira i Virgili, SpainMarija Mitrovic Dankulov, University of Belgrade, Serbia
Copyright © 2023 García-Rodríguez, Barrio, Govezensky, Tagüeña, Pérez, Calvet, Jiménez Andrade, Arencibia-Jorge and Kaski. This is an open-access article distributed under the terms of the Creative Commons Attribution License (CC BY). The use, distribution or reproduction in other forums is permitted, provided the original author(s) and the copyright owner(s) are credited and that the original publication in this journal is cited, in accordance with accepted academic practice. No use, distribution or reproduction is permitted which does not comply with these terms.
*Correspondence: Alberto García-Rodríguez, YWxiZXJ0by5nLnJvZGd6QGdtYWlsLmNvbQ==